Waste and recycling tracking - 2020 data
This page shows graphs of data I collected in 2020 on the amount of rubbish I disposed of that year. I started collecting data in August of 2019, so 2020 was my first full year of data. For more recent data, see my current waste data page.
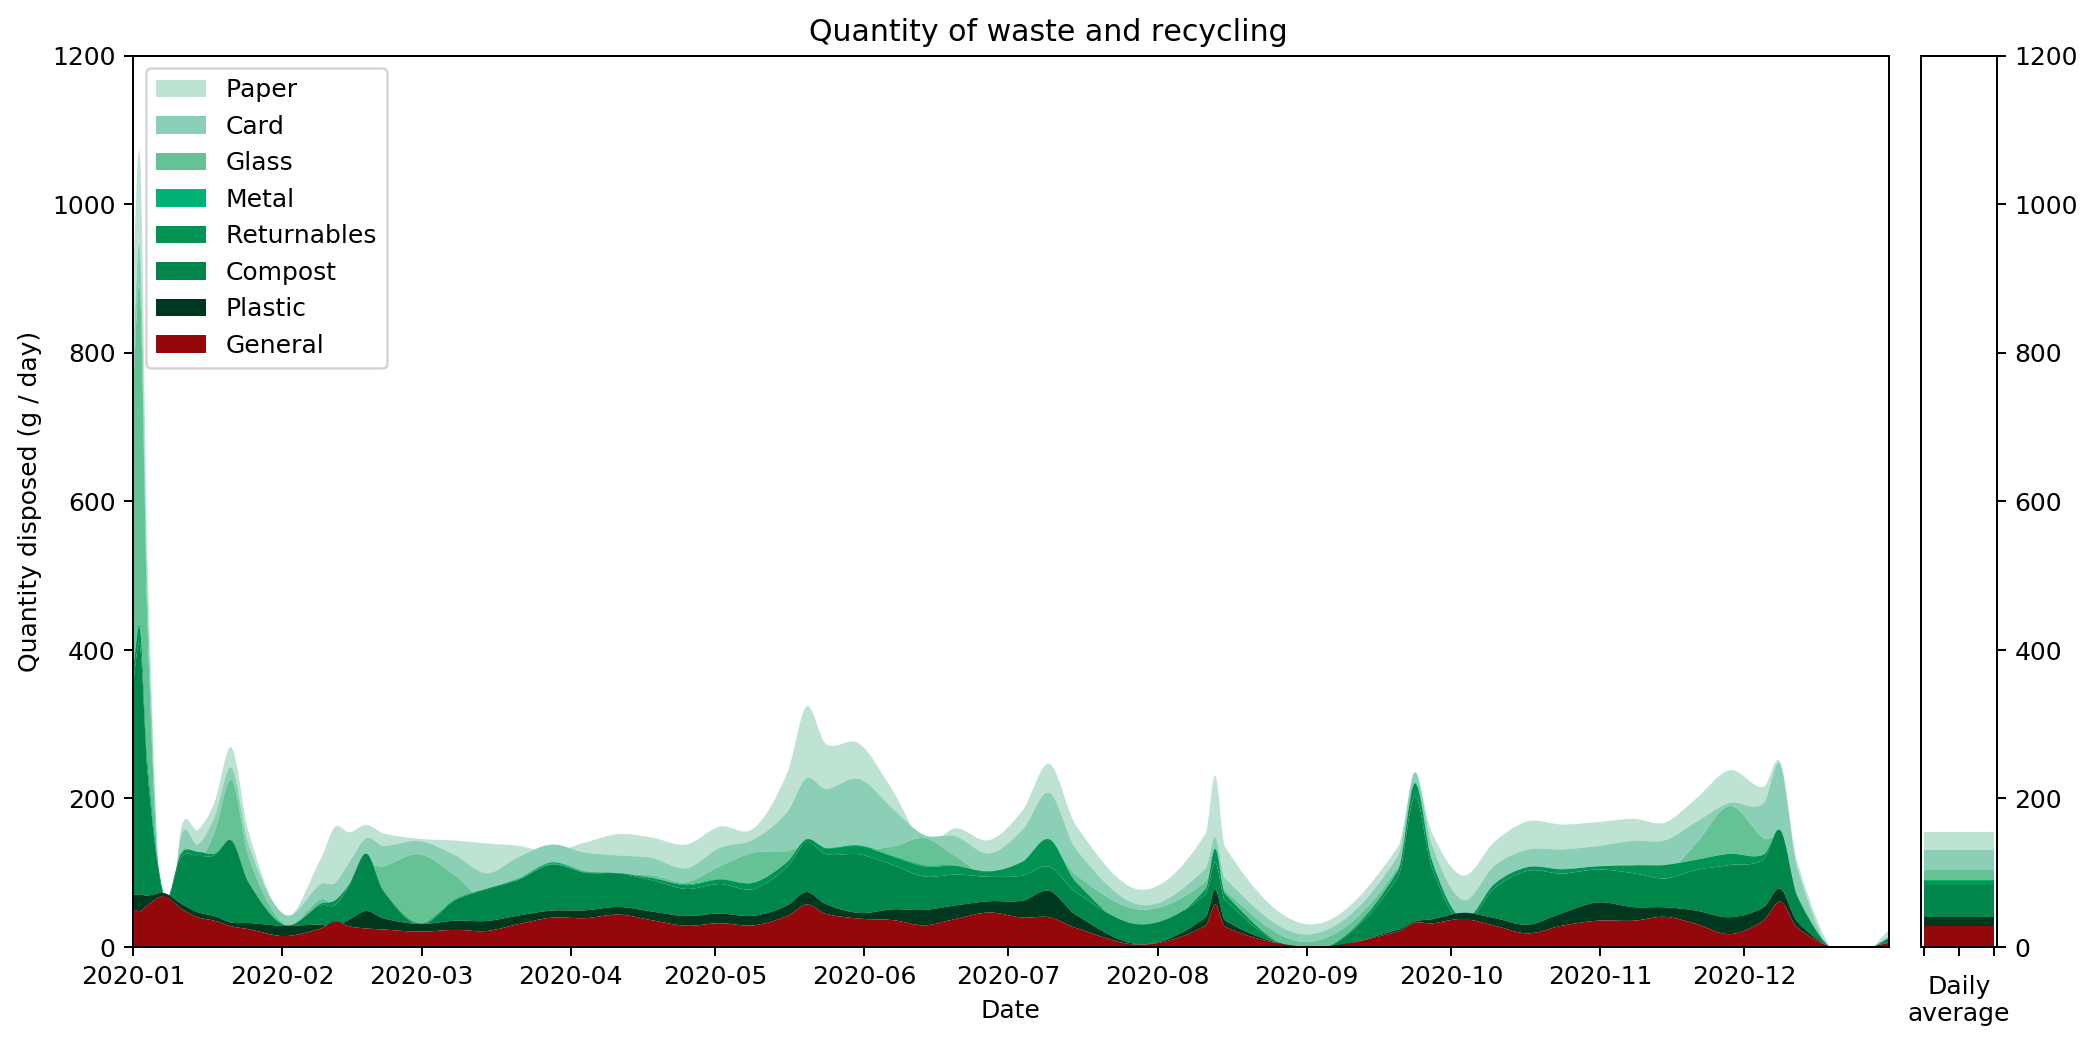
My overall average daily waste output for the year was 154.98 g/day.
Below is a stacked histocurve showing the weight of waste I produced split by recycling category. The area under the graph represents my total waste output. Click on the graphs for larger versions.
Some brief points to note about the graphs:
- Green categories are recycled by the council; general waste in red isn't recycled.
- This is output for a single person.
- Data points correspond to when I do the bins, roughtly fortnightly.
- For info about how the graphs are generated, see my Graphs of Waste posts on the topic.
- The script used to generate the graphs can be found on GitHub.
To view histograms showing the actual values recorded for each of the waste types, select one of the graphs below. They all have different scales on the y-axis, so they're not visually comparable.
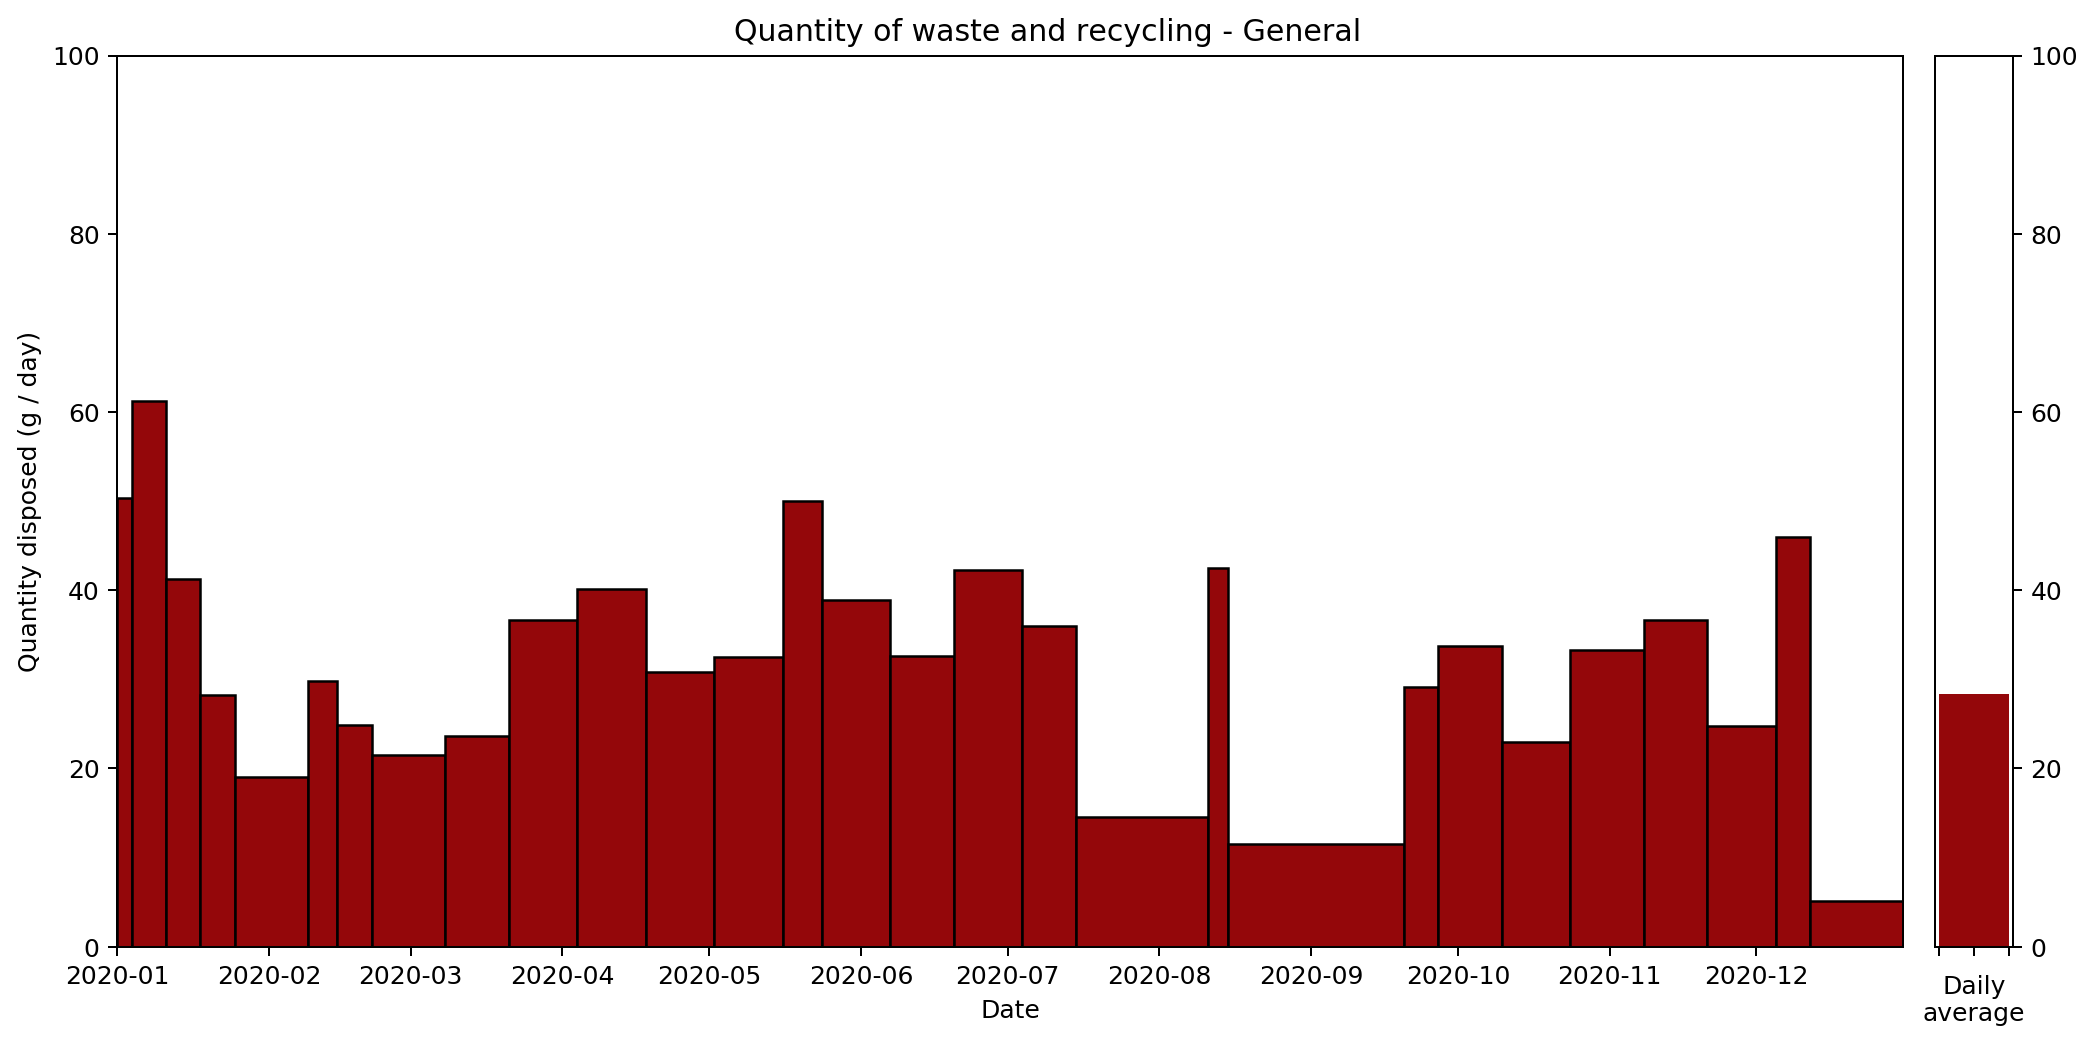
General

Plastic
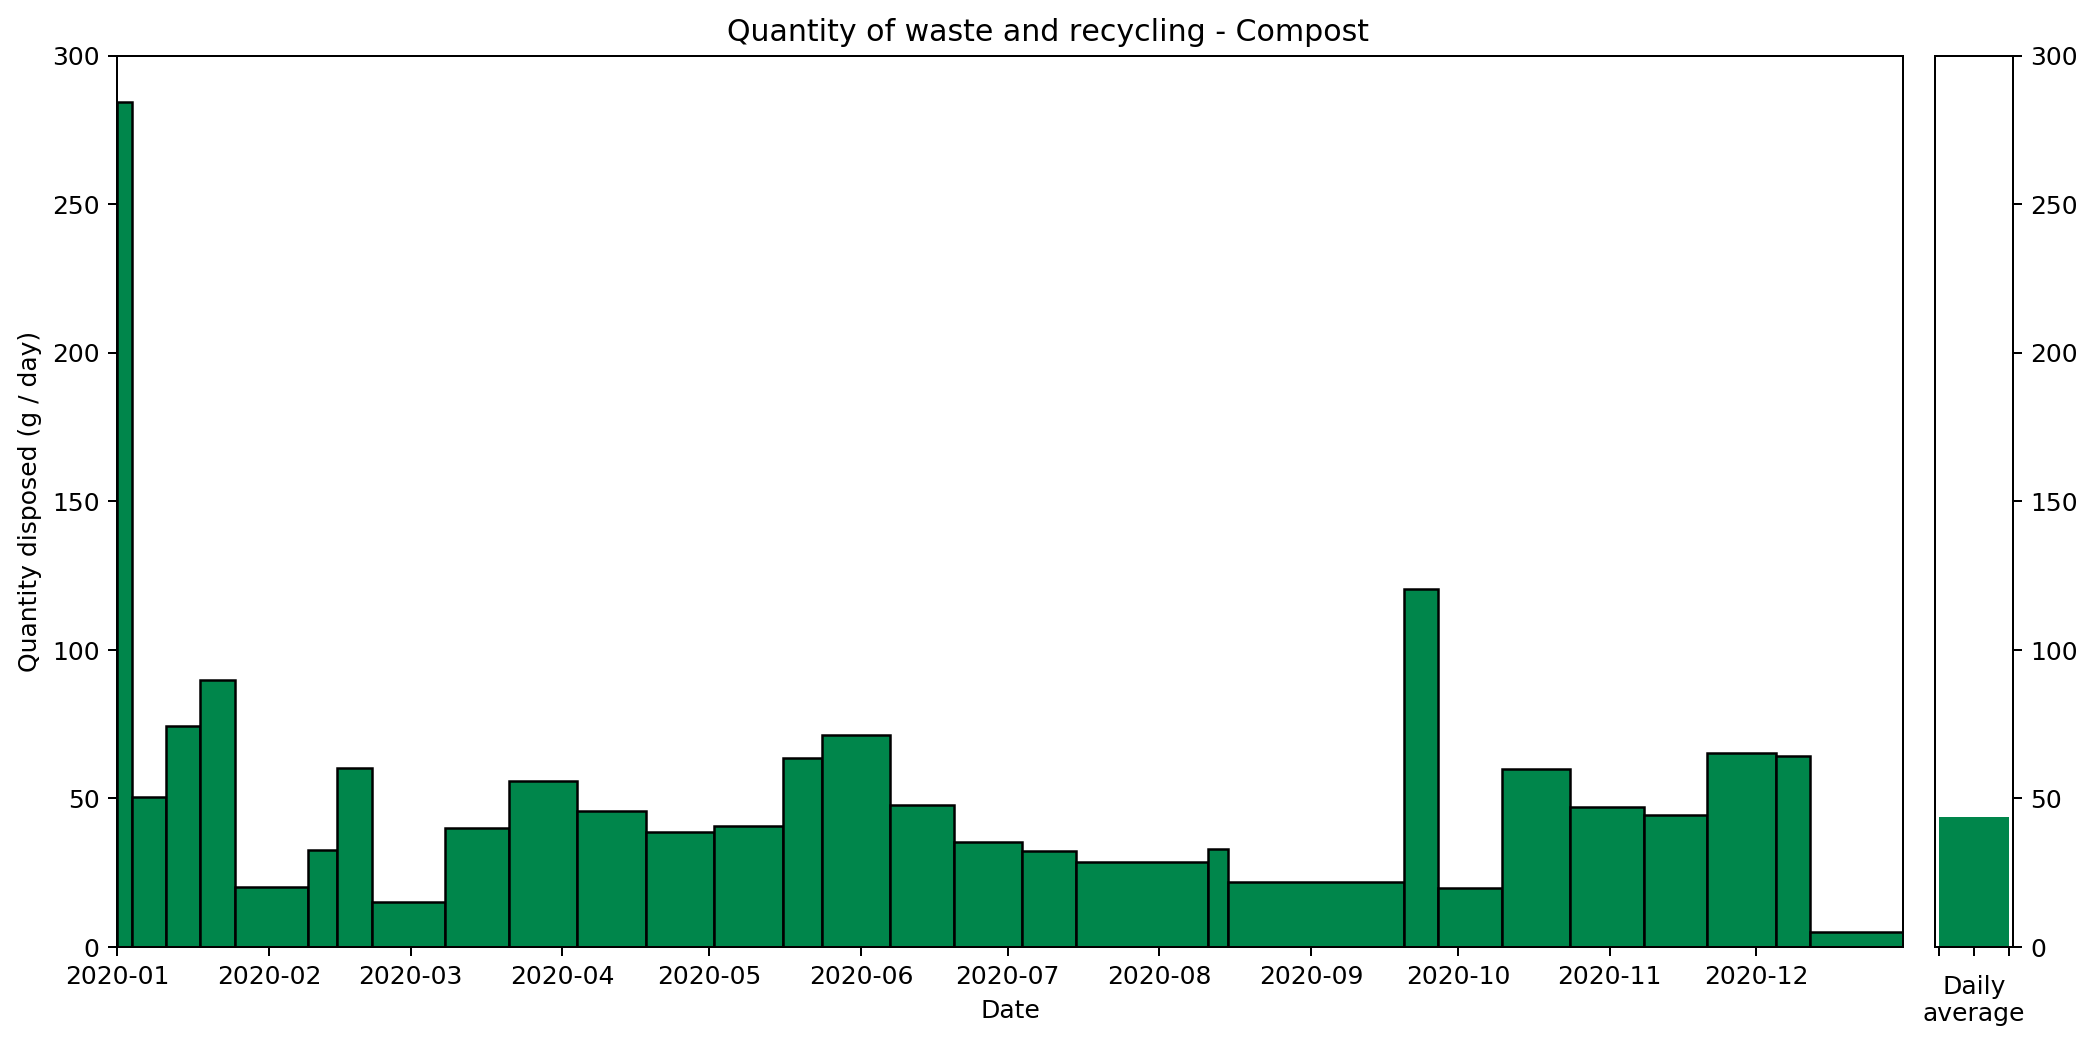
Compost
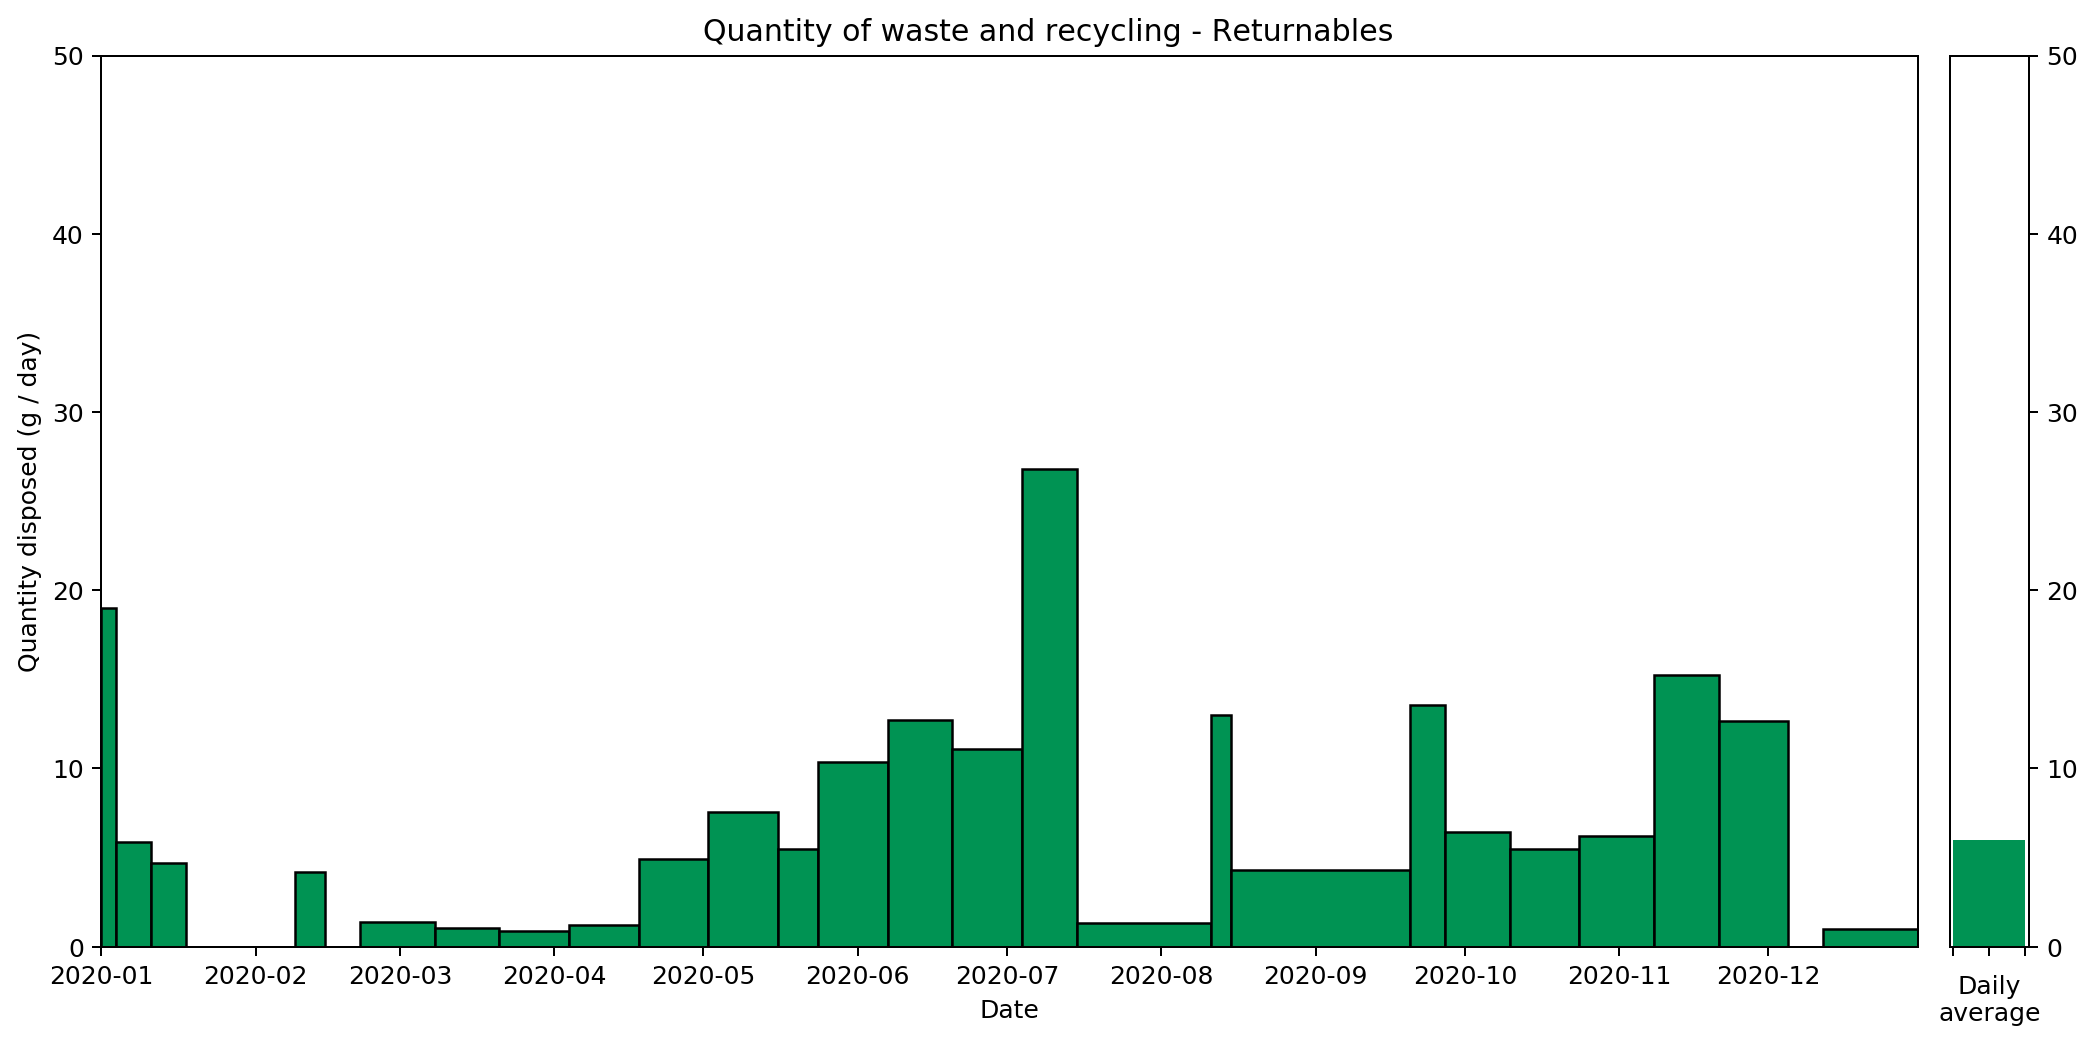
Returnables
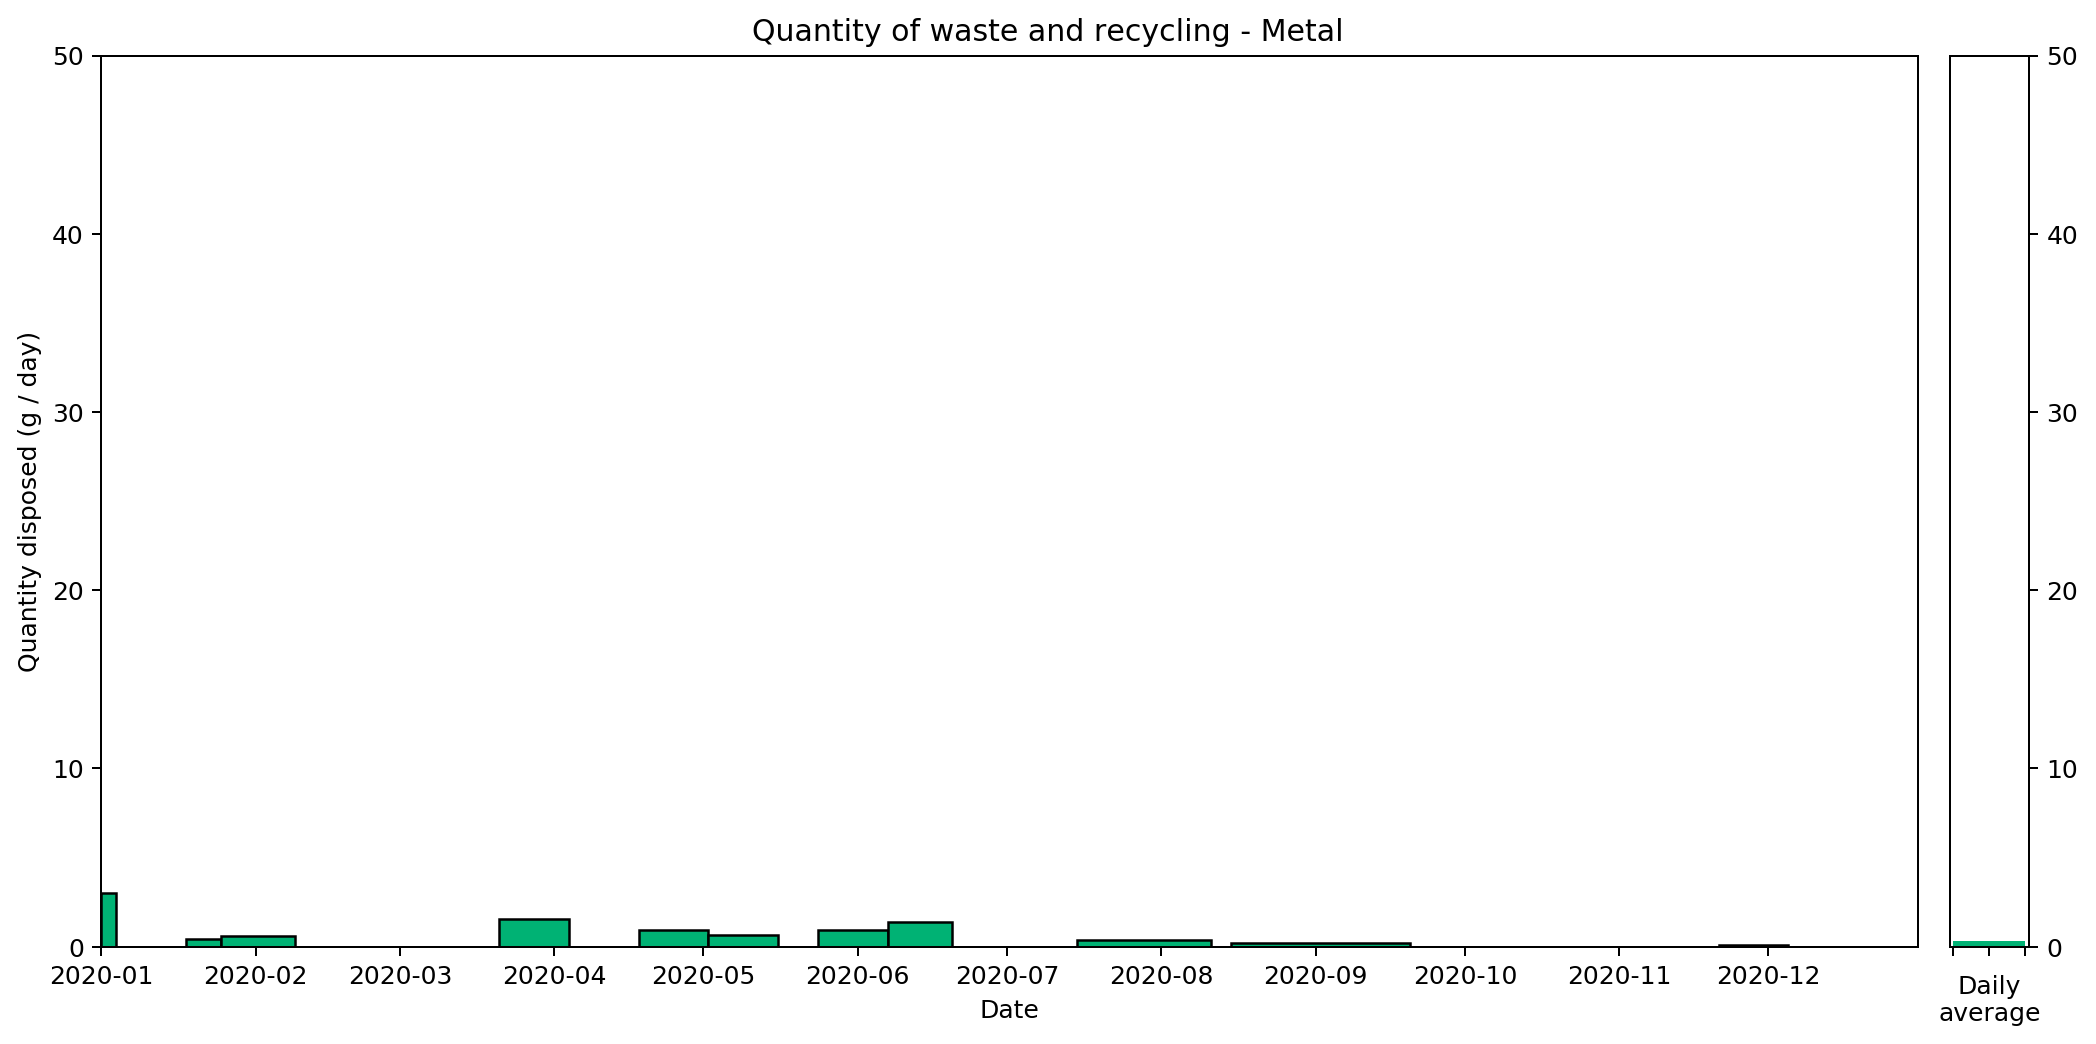
Metal
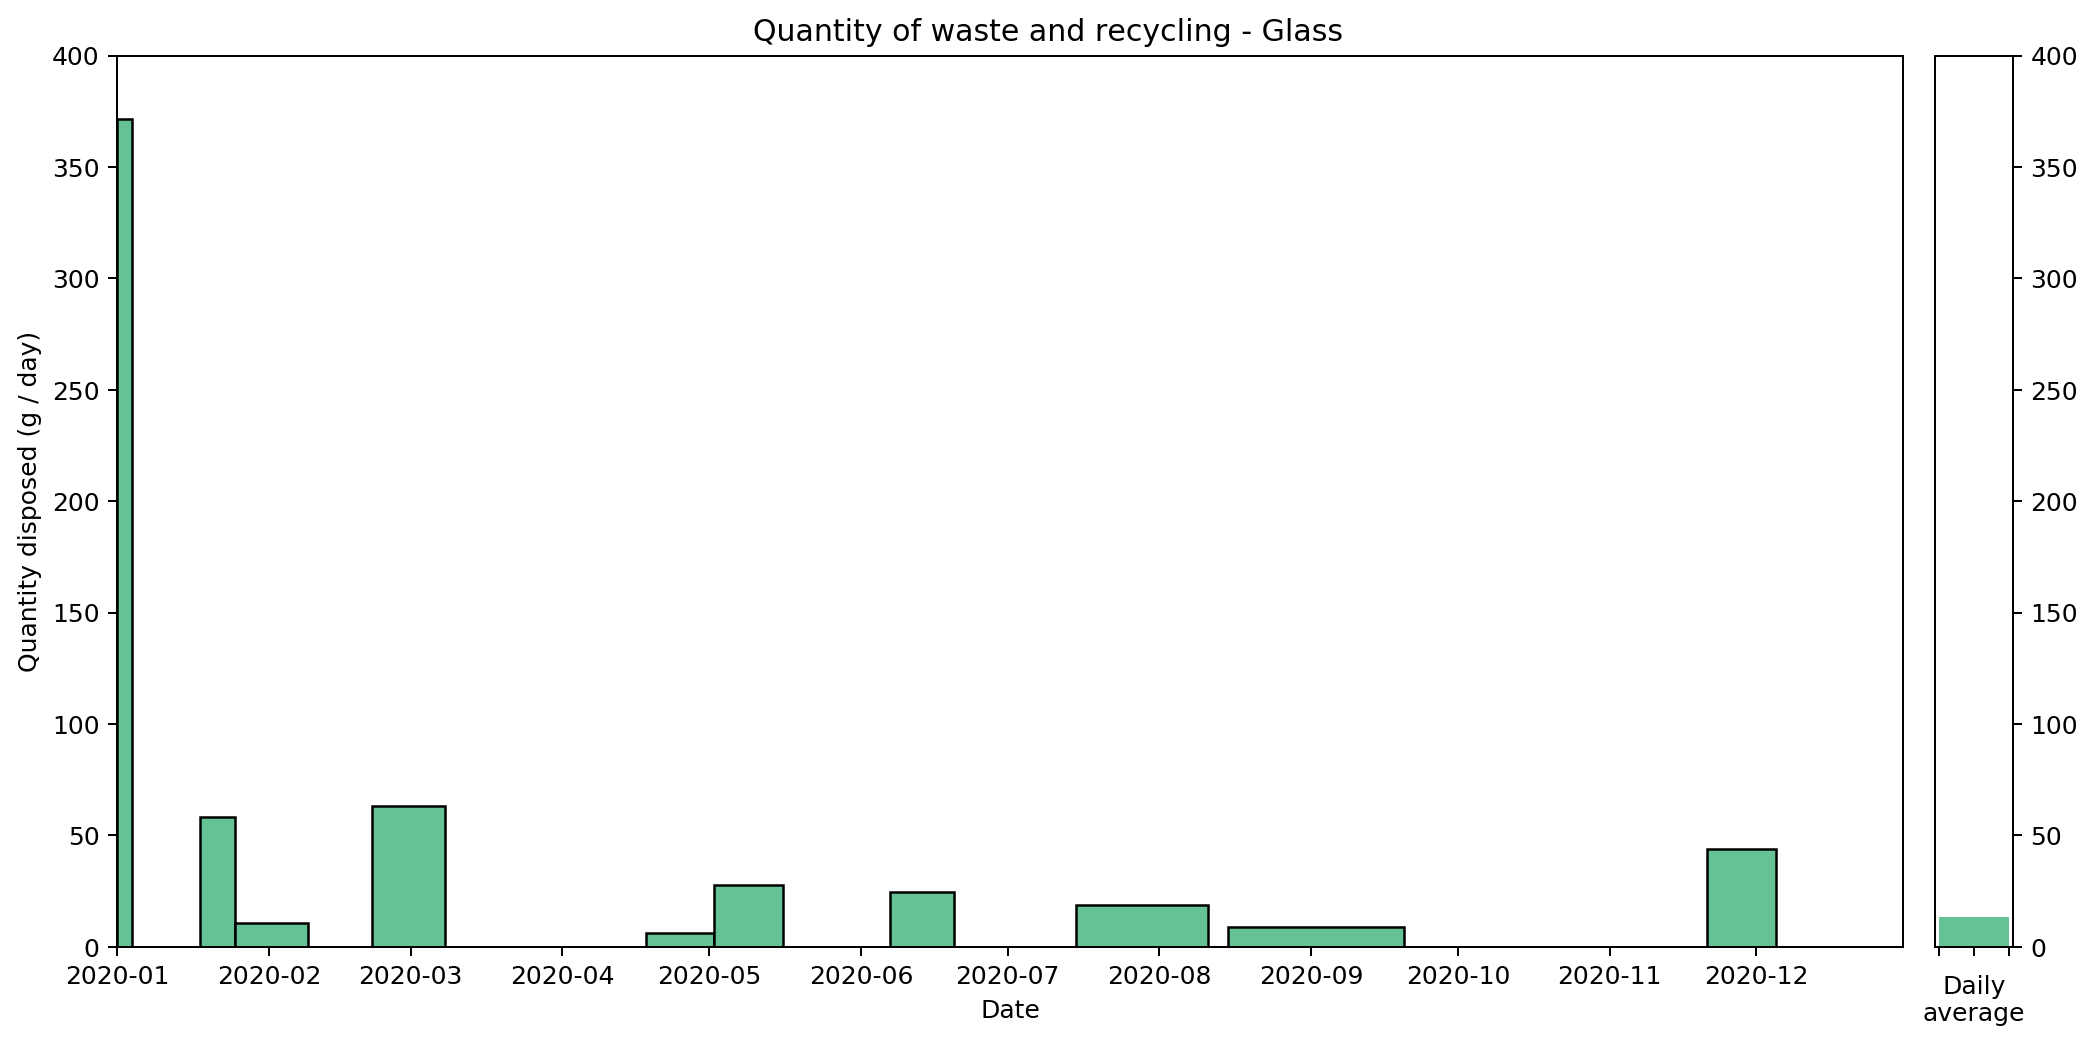
Glass
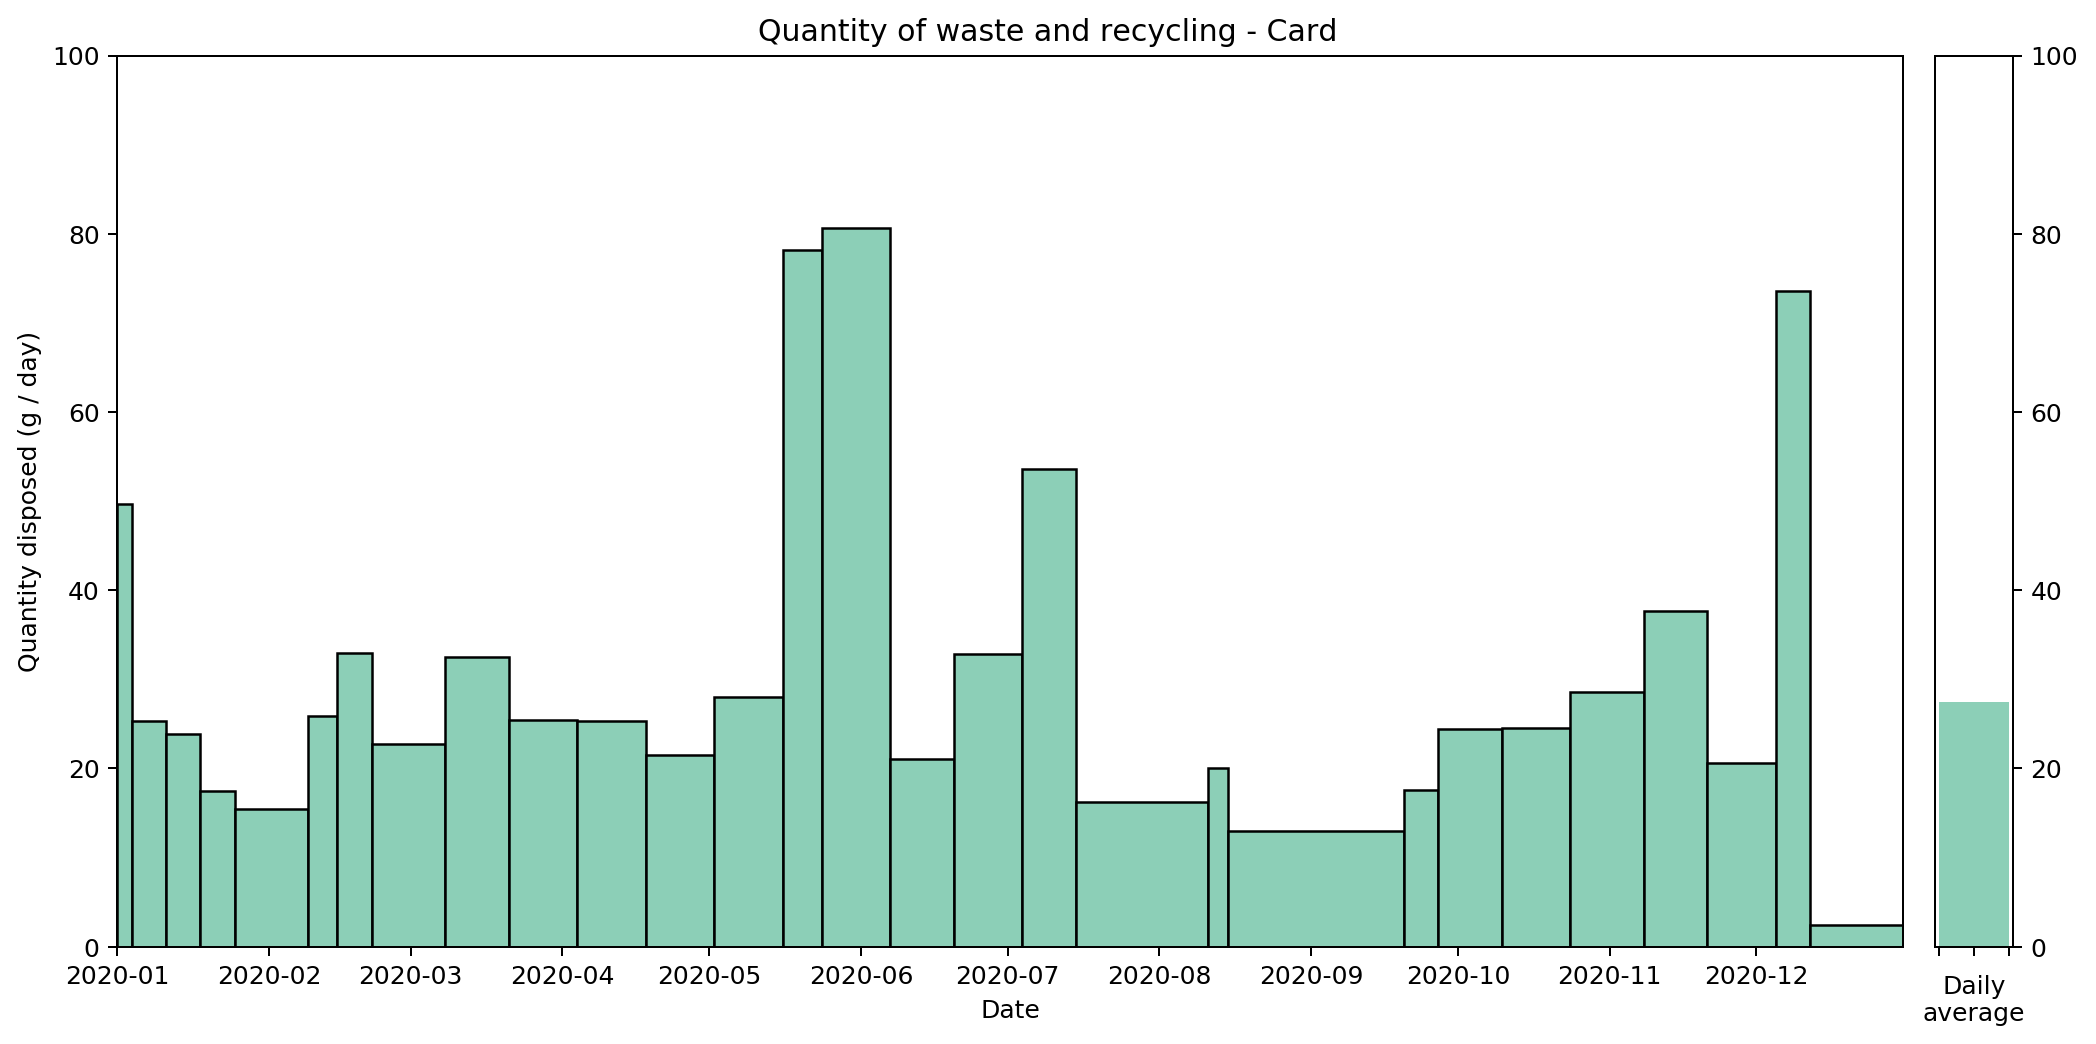
Card
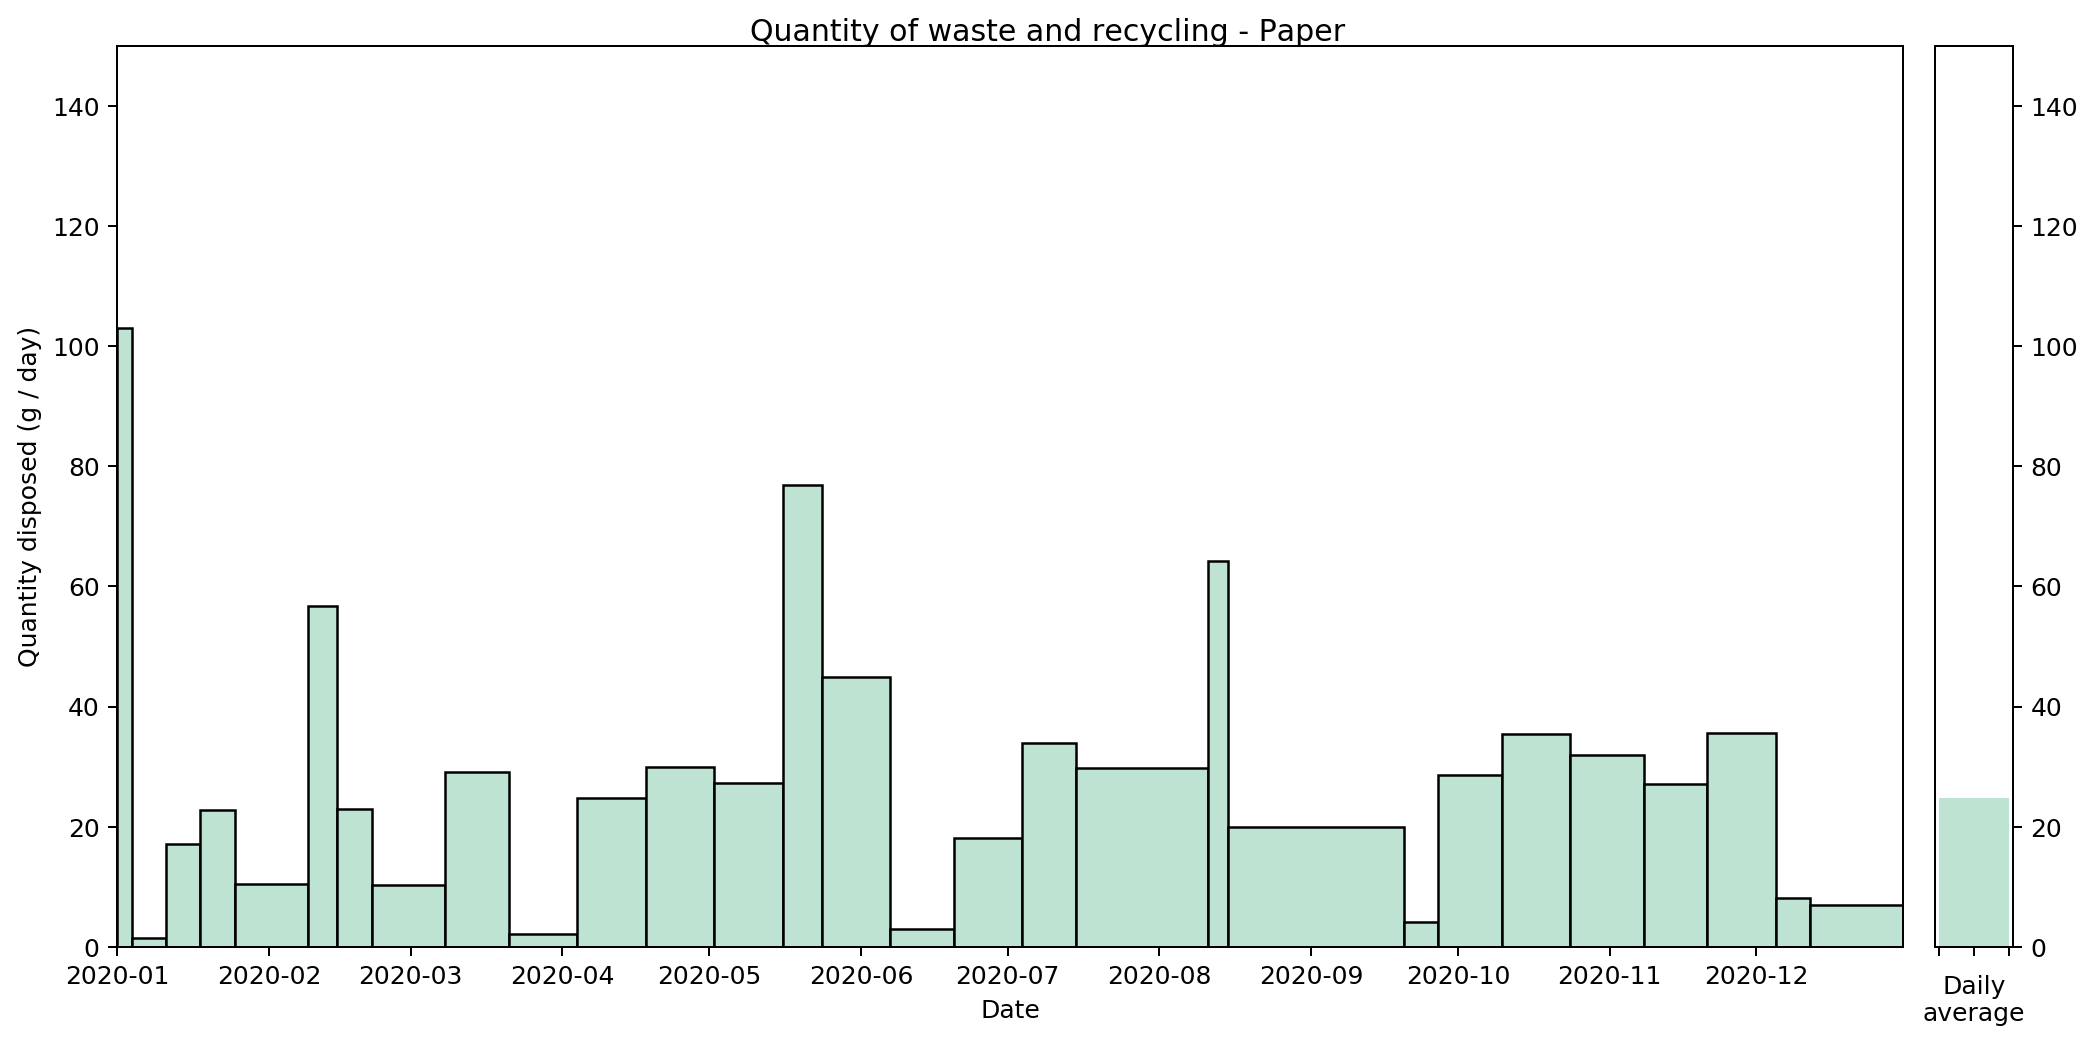
Paper
Waste Index
10 most recent items
26 Jan 2025 : How lightly did I tread in 2024
7 Jan 2024 : Life as a Christmas tree
6 Jan 2024 : How lightly did I tread in 2023
4 Jun 2023 : A Year Being Human: Inputs and Outputs
4 Jun 2023 : A Year Being Human: Inputs and Outputs
23 Apr 2023 : How lightly did I tread in 2022
1 Jan 2023 : Waste Data Dump
19 Dec 2022 : Waste data dump
27 Nov 2022 : Waste data dump
29 Oct 2022 : Waste data dump