List items
Items from the current list are shown below.
Gecko
12 Aug 2024 : Day 317 #
The build I started yesterday has gone through successfully, which is a nice step forwards. This is with all the audio and video patches applied and I'm hoping I'll now have better luck using the audio and video test pages that were causing us trouble back on Day 299.
Here's what I wrote about it back then:
So that's rather a litany of failures. Now when I test out these various video and audio pages I get a very different experience. BBC Sounds works nicely and I can listen to radio programs, both live and historical. On Jolla's video test pages, BBC iPlayer and YouTube the videos all play, which is definitely a big improvement. But there is a catch.
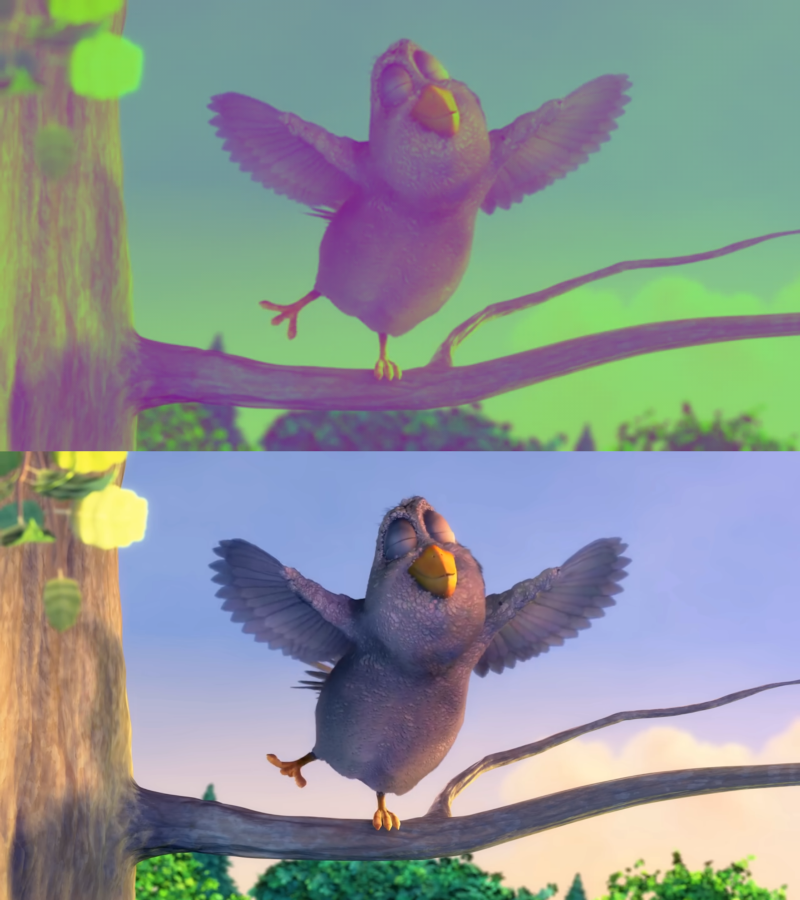
Now with the videos I'm discolouration similar to that we saw on Day 290 when working on the WebRTC video. The colours seem to have channels switched or be colour-shifted in a way that means you can clearly see the video, just with all the wrong colours.
Comparing the original with the version showing in ESR 91, this doesn't seem to be a straight channel switch as we were seeing before. In fact I've not yet been able to figure out what the conversion is that's happening here. Any ideas?
I'm in two minds now as to whether or not I should tick off the audio and video items in the testing list. There's already an issue for tackling the discolouration so it might makes sense for future work on this to fall under that.
On the other hand, it'd be nice to get this all resolved as soon as possible. My plan is to do a bit more testing and to spend some time today trying to figure out whether there's an obvious solution or missing change that I still need to make. If I can't figure something out quickly, I'll reconsider ticking these items off. But I'm going to leave them unticked for now.
So, today it's more audio and video testing.
The first thing I try out is just a few runs of the YouTube video on the Jolla test page. Everything seems to be going well, with several successful playthroughs, but then there's an unexpected crash. Because I'm running using the debugger I'm able to capture a backtrace for it. Note I've cut out several batches of frames for clarity:
To try to answer this I thought it might help to know where the context is being created. So I've added a breakpoint to CreateHeadless() which appears to be where this is happening.
Once the page with the video has opened the breakpoint hits a minute or two after the video has started playing. I've captured the backtrace, which looks like this:
Assuming for a moment that the construction and destruction of the context is intentional, it's possible the problem is all down to that call to fTerminate(). This is calling the eglTerminate() GLES method and it does look like it may be causing problems for Wayland. Maybe this is the bug?
To get a feel for this I've removed the call to fTerminate() from the EglDisplay destructor and replaced it with a call to output a debug string to the console instead: EglDisplay::~EglDisplay() { printf_stderr("CRASH: EglDisplay destructor"); //fTerminate(); mLib->mActiveDisplays.erase(mDisplay); } My thinking is that if we see the debug output but no crash, that may be an indication that the call to fTerminate() is at the heart of the problem, rather than being caused by badly written code elsewhere. On the other hand if there's still a crash we should be look elsewhere in the code.
I've built a copy of the library with these changes and transferred it over to my phone. It may take a while for the issue to re-trigger, so I'll continue testing this tomorrow morning.
While the library worked it's way through the build I've also spent some time reviewing the video decoder code from earlier. I notice various references to the video colour model that could help explain the video discolouration.
The code in GeckoCameraVideoDecoder.cpp suggests that the decoder is generating Y'CbCR data. The three channels of Y'CbCR are made up of luma (Y'), blue difference chroma (Cb) and red difference chroma (Cr). It appears that one of the benefits of using this colour model is that the chroma channels can have a lower resolution than the luma channel without adversely affecting resulting appearance. This helps reduce the size of the data that needs to be transferred.
If I split the video image being rendered by the browser into its red, blue and green components and then do the same for the correct image, except split into the Y', Cb and Cr components, I find that the results broadly match up.
Here we can see the results graphically. There are two columns and three rows of components. The left hand column from top-to-bottom shows the Green, Blue and Red components respectively of the image rendered by the browser. The right hand column from top-to-bottom shows the Y', Cb and Cr components respectively taken from the original video:
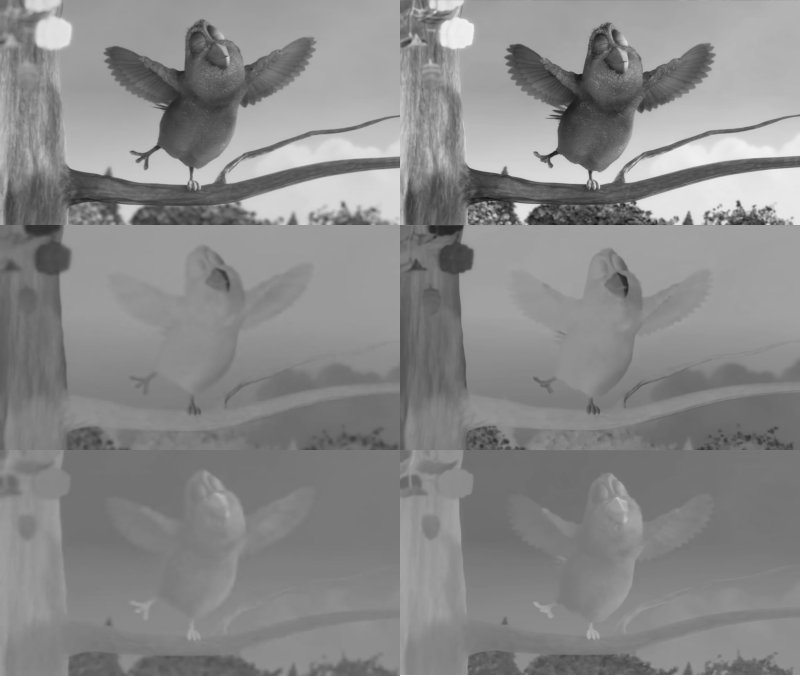
The blue and red channels from the browser appear to be rendered in a lower resolution, but otherwise look very similar to the Y'CbCr data from the original video.
What can we conclude? It seems that the browser is sending Y'CbCr data to be rendered, but the hardware is rendering it as RGB data. The result is the peculiar colour mixture that we end up seeing.
It's certainly going to be helpful to know what's going wrong, but finding the place in the code where this is happening and figuring out how to fix it is another story.
Although I've not been able to solve either the crash or the discolouration today, it nevertheless feels like we've covered some useful groundwork. Tomorrow I'll try to pursue both issues further.
If you'd like to read any of my other gecko diary entries, they're all available on my Gecko-dev Diary page.
Here's what I wrote about it back then:
For audio testing the results are also unfortunately a fail. I'm testing using BBC Sounds which works fine on ESR 78. But on my ESR 91 build we don't get any audio, just an error message that states "This content doesn't seem to be working". Disappointing.
I get the same with the BBC iPlayer for video: it works on ESR 78 but not ESR 91. When using Jolla's video test page I get the same experience. On YouTube as well.
I get the same with the BBC iPlayer for video: it works on ESR 78 but not ESR 91. When using Jolla's video test page I get the same experience. On YouTube as well.
So that's rather a litany of failures. Now when I test out these various video and audio pages I get a very different experience. BBC Sounds works nicely and I can listen to radio programs, both live and historical. On Jolla's video test pages, BBC iPlayer and YouTube the videos all play, which is definitely a big improvement. But there is a catch.
Now with the videos I'm discolouration similar to that we saw on Day 290 when working on the WebRTC video. The colours seem to have channels switched or be colour-shifted in a way that means you can clearly see the video, just with all the wrong colours.
Comparing the original with the version showing in ESR 91, this doesn't seem to be a straight channel switch as we were seeing before. In fact I've not yet been able to figure out what the conversion is that's happening here. Any ideas?
I'm in two minds now as to whether or not I should tick off the audio and video items in the testing list. There's already an issue for tackling the discolouration so it might makes sense for future work on this to fall under that.
On the other hand, it'd be nice to get this all resolved as soon as possible. My plan is to do a bit more testing and to spend some time today trying to figure out whether there's an obvious solution or missing change that I still need to make. If I can't figure something out quickly, I'll reconsider ticking these items off. But I'm going to leave them unticked for now.
So, today it's more audio and video testing.
The first thing I try out is just a few runs of the YouTube video on the Jolla test page. Everything seems to be going well, with several successful playthroughs, but then there's an unexpected crash. Because I'm running using the debugger I'm able to capture a backtrace for it. Note I've cut out several batches of frames for clarity:
Thread 10 "GeckoWorkerThre" received signal SIGSEGV, Segmentation
    fault.
[Switching to LWP 8326]
0x0000007fe7747e90 in wl_proxy_destroy () from /usr/lib64/libwayland-client.so.0
(gdb) bt
#0  0x0000007fe7747e90 in wl_proxy_destroy () from /usr/lib64/
    libwayland-client.so.0
#1  0x0000007fe7496fdc in waylandws_Terminate () from /usr/lib64/libhybris//
    eglplatform_wayland.so
#2  0x0000007fef07d4bc in eglTerminate () from /usr/lib64/libEGL.so.1
#3  0x0000007ff23963ec in mozilla::gl::GLLibraryEGL::fTerminate (
    display=<optimized out>, this=<optimized out>)
    at gfx/gl/GLLibraryEGL.h:234
#4  mozilla::gl::EglDisplay::fTerminate (this=0x7fb938c020)
    at gfx/gl/GLLibraryEGL.h:639
#5  mozilla::gl::EglDisplay::~EglDisplay (this=0x7fb938c020,
    __in_chrg=<optimized out>)
    at gfx/gl/GLLibraryEGL.cpp:734
#6  0x0000007ff23964a4 in __gnu_cxx::new_allocator<mozilla::gl::EglDisplay>::
    destroy<mozilla::gl::EglDisplay> (__p=<optimized out>, this=<optimized out>)
    at /srv/mer/toolings/SailfishOS-4.5.0.18/opt/cross/aarch64-meego-linux-gnu/
    include/c++/8.3.0/ext/new_allocator.h:140
[...]
#19 RefPtr<mozilla::gl::GLContext>::operator=(decltype(nullptr)) (
    this=0x7fbbc4b8e0)
    at ${PROJECT}/obj-build-mer-qt-xr/dist/include/mozilla/RefPtr.h:168
#20 mozilla::WebGLContext::DestroyResourcesAndContext (
    this=this@entry=0x7fbbc4b8c0)
    at dom/canvas/WebGLContext.cpp:217
#21 0x0000007ff31fd2ec in mozilla::WebGLContext::~WebGLContext (
    this=0x7fbbc4b8c0, __in_chrg=<optimized out>)
    at dom/canvas/WebGLContext.cpp:152
#22 0x0000007ff31fd9bc in mozilla::WebGLContext::~WebGLContext (
    this=0x7fbbc4b8c0, __in_chrg=<optimized out>)
    at dom/canvas/WebGLContext.cpp:152
#23 0x0000007ff31b09e4 in mozilla::detail::RefCounted<mozilla::VRefCounted, (
    mozilla::detail::RefCountAtomicity)1>::Release (this=<optimized out>)
    at ${PROJECT}/obj-build-mer-qt-xr/dist/include/mozilla/RefCounted.h:240
#24 mozilla::RefPtrTraits<mozilla::WebGLContext>::Release (aPtr=<optimized out>)
    at ${PROJECT}/obj-build-mer-qt-xr/dist/include/mozilla/RefPtr.h:50
#25 RefPtr<mozilla::WebGLContext>::ConstRemovingRefPtrTraits<mozilla::
    WebGLContext>::Release (aPtr=<optimized out>)
    at ${PROJECT}/obj-build-mer-qt-xr/dist/include/mozilla/RefPtr.h:381
[...]
#42 0x0000007ff19163c8 in nsCycleCollector::CollectWhite (
    this=this@entry=0x7fb803f7b0)
    at xpcom/base/nsCycleCollector.cpp:3081
#43 0x0000007ff191cd68 in nsCycleCollector::Collect (this=0x7fb803f7b0,
    aCCType=aCCType@entry=SliceCC, aBudget=...,
    aManualListener=aManualListener@entry=0x0,
    aPreferShorterSlices=aPreferShorterSlices@entry=false)
    at xpcom/base/nsCycleCollector.cpp:3435
#44 0x0000007ff191cfdc in nsCycleCollector_collectSlice (budget=...,
    aPreferShorterSlices=false)
    at ${PROJECT}/obj-build-mer-qt-xr/dist/include/mozilla/RefPtr.h:313
#45 0x0000007ff28a14f0 in nsJSContext::RunCycleCollectorSlice (
    aDeadline=aDeadline@entry=...)
    at dom/base/nsJSEnvironment.cpp:1406
#46 0x0000007ff28a21a0 in mozilla::CCGCScheduler::CCRunnerFired (aDeadline=...)
    at dom/base/nsJSEnvironment.cpp:1543
[...]
#72 0x0000007fef53689c in ?? () from /lib64/libc.so.6
(gdb)
The crash appears to be triggered by a call to EglDisplay::fTerminate() but there are other questions to ask about what's going on here. For example, further down the stack we see that the underlying cause is the destruction of EglDisplay which itself is being caused by the destruction of GLContextEGL. Could this be down to an incorrect reference count? Or maybe it's intentionally being deleted at this point. It's not clear why it would be though.To try to answer this I thought it might help to know where the context is being created. So I've added a breakpoint to CreateHeadless() which appears to be where this is happening.
Once the page with the video has opened the breakpoint hits a minute or two after the video has started playing. I've captured the backtrace, which looks like this:
Thread 10 "GeckoWorkerThre" hit Breakpoint 1, mozilla::gl::
GLContextProviderEGL::CreateHeadless (desc=...,
desc@entry=<error reading variable: value has been optimized out>,
out_failureId=0x7fde76f9b8,
out_failureId@entry=<error reading variable: value has been optimized out>)
at gfx/gl/GLContextProviderEGL.cpp:1247
1247 const GLContextCreateDesc& desc, nsACString* const out_failureId) {
(gdb) bt
#0 mozilla::gl::GLContextProviderEGL::CreateHeadless (desc=...,
desc@entry=<error reading variable: value has been optimized out>,
out_failureId=0x7fde76f9b8, out_failureId@entry=<error reading variable:
value has been optimized out>)
at gfx/gl/GLContextProviderEGL.cpp:1247
#1 0x0000007ff31ec8f4 in mozilla::WebGLContext::<lambda(
already_AddRefed<mozilla::gl::GLContext> (*)(const mozilla::gl::
GLContextCreateDesc&, nsACString*), char const*)>::operator()(mozilla::
WebGLContext::fnCreateT *, const char *) const (
__closure=__closure@entry=0x7fde76fa70, pfnCreate=<optimized out>,
info=info@entry=0x7ff64c2c98 "tryNativeGL")
at dom/canvas/WebGLContext.cpp:350
#2 0x0000007ff31fdf58 in mozilla::WebGLContext::<lambda()>::operator() (
__closure=<optimized out>)
at dom/canvas/WebGLContext.cpp:362
#3 mozilla::WebGLContext::CreateAndInitGL (this=this@entry=0x7fb97555d0,
forceEnabled=forceEnabled@entry=true, out_failReasons=<optimized out>,
out_failReasons@entry=0x7fde76fb60)
at dom/canvas/WebGLContext.cpp:371
#4 0x0000007ff31fe37c in mozilla::WebGLContext::<lambda()>::operator() (
__closure=<optimized out>)
at dom/canvas/WebGLContext.cpp:514
#5 mozilla::WebGLContext::Create (host=..., desc=...,
out=out@entry=0x7fb9fa7e38)
at dom/canvas/WebGLContext.cpp:562
#6 0x0000007ff31b638c in mozilla::HostWebGLContext::Create (ownerData=...,
desc=..., out=out@entry=0x7fb9fa7e38)
at dom/canvas/HostWebGLContext.cpp:59
#7 0x0000007ff31e5de0 in mozilla::ClientWebGLContext::<lambda()>::operator() (
__closure=<optimized out>)
at dom/canvas/ClientWebGLContext.cpp:625
#8 mozilla::ClientWebGLContext::CreateHostContext (
this=this@entry=0x7fb99e1f80, requestedSize=...)
at dom/canvas/ClientWebGLContext.cpp:654
[...]
#28 0x0000007fb99c4c41 in ?? ()
Backtrace stopped: not enough registers or memory available to unwind further
(gdb)
After releasing the execution the video continues to play through to the end without incident. No crash and the browser is still responsive. It's not at all clear to me why the context would only be created just part of the way through the video. Very strange.Assuming for a moment that the construction and destruction of the context is intentional, it's possible the problem is all down to that call to fTerminate(). This is calling the eglTerminate() GLES method and it does look like it may be causing problems for Wayland. Maybe this is the bug?
To get a feel for this I've removed the call to fTerminate() from the EglDisplay destructor and replaced it with a call to output a debug string to the console instead: EglDisplay::~EglDisplay() { printf_stderr("CRASH: EglDisplay destructor"); //fTerminate(); mLib->mActiveDisplays.erase(mDisplay); } My thinking is that if we see the debug output but no crash, that may be an indication that the call to fTerminate() is at the heart of the problem, rather than being caused by badly written code elsewhere. On the other hand if there's still a crash we should be look elsewhere in the code.
I've built a copy of the library with these changes and transferred it over to my phone. It may take a while for the issue to re-trigger, so I'll continue testing this tomorrow morning.
While the library worked it's way through the build I've also spent some time reviewing the video decoder code from earlier. I notice various references to the video colour model that could help explain the video discolouration.
The code in GeckoCameraVideoDecoder.cpp suggests that the decoder is generating Y'CbCR data. The three channels of Y'CbCR are made up of luma (Y'), blue difference chroma (Cb) and red difference chroma (Cr). It appears that one of the benefits of using this colour model is that the chroma channels can have a lower resolution than the luma channel without adversely affecting resulting appearance. This helps reduce the size of the data that needs to be transferred.
If I split the video image being rendered by the browser into its red, blue and green components and then do the same for the correct image, except split into the Y', Cb and Cr components, I find that the results broadly match up.
Here we can see the results graphically. There are two columns and three rows of components. The left hand column from top-to-bottom shows the Green, Blue and Red components respectively of the image rendered by the browser. The right hand column from top-to-bottom shows the Y', Cb and Cr components respectively taken from the original video:
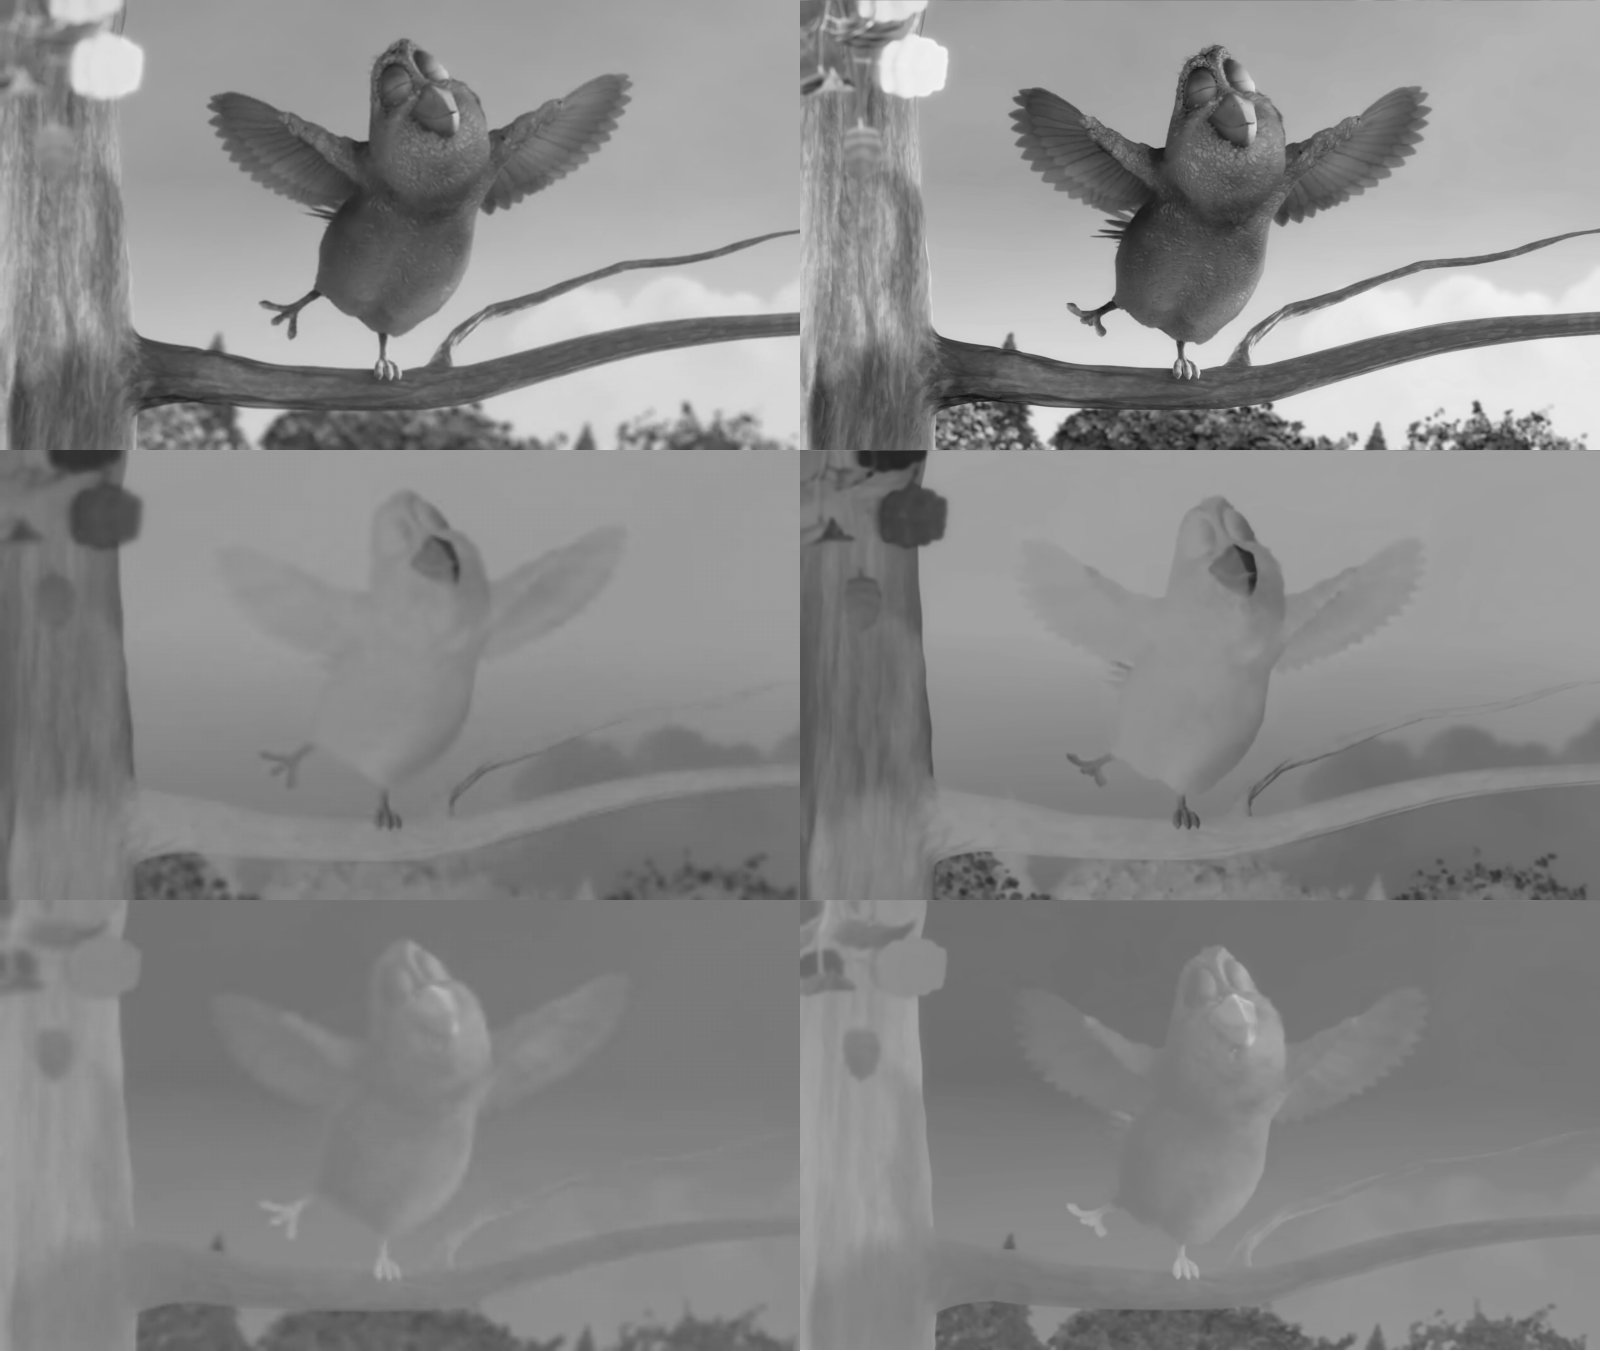
The blue and red channels from the browser appear to be rendered in a lower resolution, but otherwise look very similar to the Y'CbCr data from the original video.
What can we conclude? It seems that the browser is sending Y'CbCr data to be rendered, but the hardware is rendering it as RGB data. The result is the peculiar colour mixture that we end up seeing.
It's certainly going to be helpful to know what's going wrong, but finding the place in the code where this is happening and figuring out how to fix it is another story.
Although I've not been able to solve either the crash or the discolouration today, it nevertheless feels like we've covered some useful groundwork. Tomorrow I'll try to pursue both issues further.
If you'd like to read any of my other gecko diary entries, they're all available on my Gecko-dev Diary page.
Comments
Uncover Disqus comments