List items
Items from the current list are shown below.
Waste
29 Aug 2021 : New and improved waste data graphs #
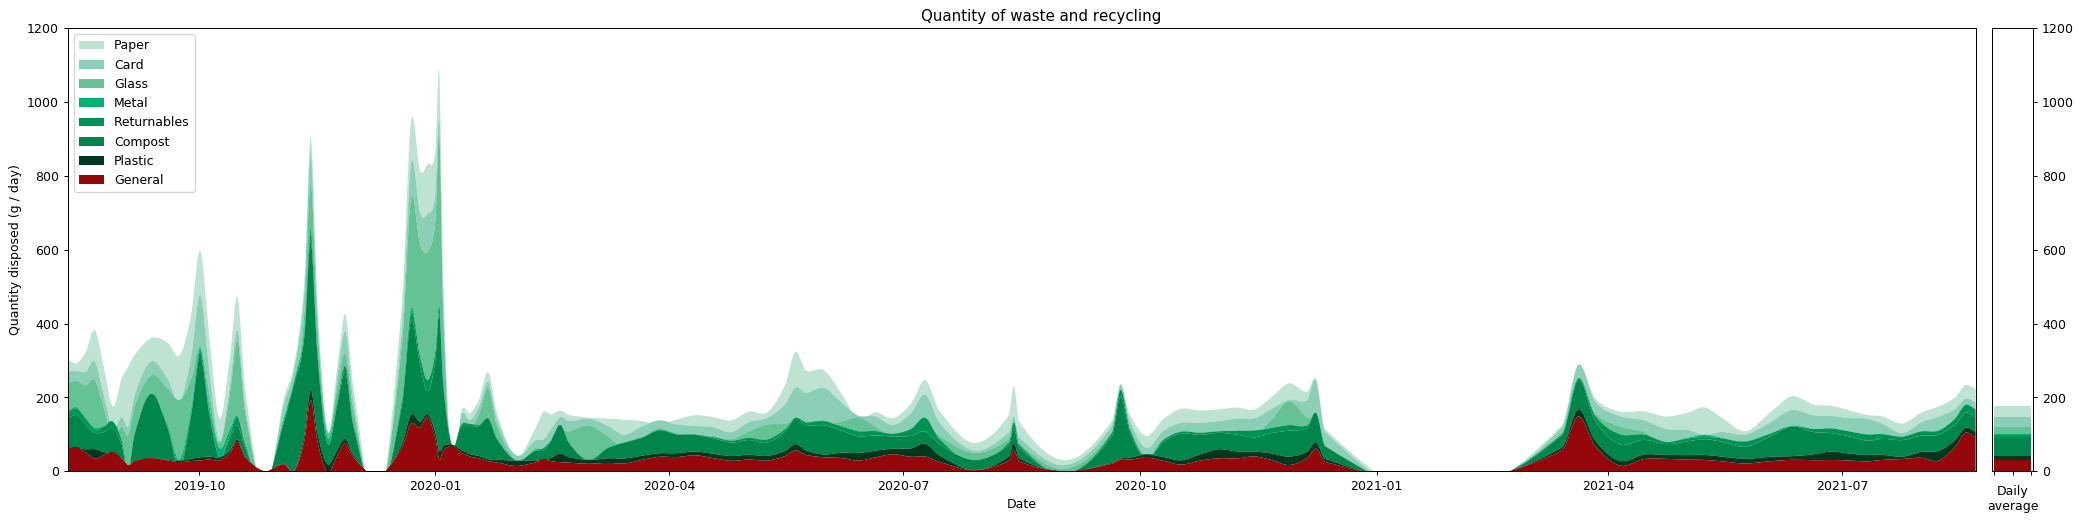
I've just hit two full years of waste output data, which has given me a nice idea about how much waste I generate on a daily basis. Since I started back in August 2019 I've been updating a graph showing the results on my waste page. It's provided quite a fascinating picture. Not only has my waste output gone down over time, but it's also become more consistent.
I attribute this improvement squarely to the act of measuring my data each fortnight. The process has made me far more aware, not just about how much waste I produce, but also the sorts of products that generate more or less waste.
For example, glass is really heavy and it became clear quite early on that it was contributing significantly to the weight of waste I was producing. This motivated me to look into it more deeply, which ultimately resulted in me almost completely eradicating glass from my daily usage.
As a result of this and other changes, my daily usage has gone down from 322.80 g/day in 2019 to 154.98 g/day in 2020, and now in 2021 I'm currently averaging 123.34 g/day. Admittedly my average this year is likely to increase during the winter (and Christmas especially) but my aim is to keep it at least as low as my 2020 average.
One of the downsides to accumulating all this data is that the graphs I've been posting here have become increasingly hard to read. Placing all of the data onto a single graph has become unsustainable, so over the last week I've been updating my graph-generating scripts to make them more flexible. As a result, I'm now going to only show data for the current year on the main waste page. The data for previous years can still be viewed on the pages for 2019 and 2020, and I'll add new pages as the years tick forwards.
I've also created a new page showing the complete data set. These "all-data" graphs are plotted wider now, and while this makes it easier to read the individual entries, it also makes them impractically long and thin. The "fixed in time" preview below already gives an idea of the problem, but the graphs will only get wider, and the issue more accuate, over time. So they're really only going to be of interest for the masochistic.
This covers an unusually long period of time because I was stuck in the UK for January, February and most of March due to Covid travel restrictions. But this is also convenient for making a more exaggerated example. So the period between 12th December and 14th March contains a total of 92 days. That splits into the two periods "12th December - 31st December" and "1st January - 14th March", which contain 20 and 72 days respectively. The proportion of time for each of these periods is therefore 20 / 92 = 21.74% that falls into 2020 and 72 / 92 = 78.26% that falls into 2021.
To manage the data split across the year, we therefore have to scale it appropriately. Each entry represents the end of a period, so the 12th December data falls entirely within 2020. The 14th March data represents the period that's split across both years. We can therefore scale this entry and turn it into two separate entries like this, scaling each of the data points based on the proportions calculated above.
To get the correct picture this has to be done at both ends of the year being plotted.
Managing the data this way makes some obvious assumptions which may not necessarily be true (it assumes I generate waste uniformly across the time period, which is obviously not the case). However it has several nice properties. The annual histograms get drawn in a way that broadly speaking matches up across the year boundary; and the annual averages also match up correctly. At least, it seems to me to be the most honest way to tackle the issue when apportioning the data across year boundaries.
Check back to my waste page over time to see how I'm getting on with keping my waste output down (or not), and whether I'm able to hit my 2021 target.
I attribute this improvement squarely to the act of measuring my data each fortnight. The process has made me far more aware, not just about how much waste I produce, but also the sorts of products that generate more or less waste.
For example, glass is really heavy and it became clear quite early on that it was contributing significantly to the weight of waste I was producing. This motivated me to look into it more deeply, which ultimately resulted in me almost completely eradicating glass from my daily usage.
As a result of this and other changes, my daily usage has gone down from 322.80 g/day in 2019 to 154.98 g/day in 2020, and now in 2021 I'm currently averaging 123.34 g/day. Admittedly my average this year is likely to increase during the winter (and Christmas especially) but my aim is to keep it at least as low as my 2020 average.
One of the downsides to accumulating all this data is that the graphs I've been posting here have become increasingly hard to read. Placing all of the data onto a single graph has become unsustainable, so over the last week I've been updating my graph-generating scripts to make them more flexible. As a result, I'm now going to only show data for the current year on the main waste page. The data for previous years can still be viewed on the pages for 2019 and 2020, and I'll add new pages as the years tick forwards.
I've also created a new page showing the complete data set. These "all-data" graphs are plotted wider now, and while this makes it easier to read the individual entries, it also makes them impractically long and thin. The "fixed in time" preview below already gives an idea of the problem, but the graphs will only get wider, and the issue more accuate, over time. So they're really only going to be of interest for the masochistic.

While the full-data graph is interesting by virtue of its absurdity, splitting the graph up into annual chunks turns out to be the more interesting case. In particular, because I take readings when I take out the rubbish, these rarely actually fall on the first or last day of the year. So, how to split the readings across the year boundaries?
The solution I've came up with is to scale the readings at each end of the year in proportion to how much of the period falls into the year in question. For example, here are the actual readings I took over the 2020-2021 year boundary.
| Date | Paper | Card | Glass | Metal | Returnables | Composts | Plastic | General |
|---|---|---|---|---|---|---|---|---|
| 12/12/2020 | 57 | 515 | 0 | 0 | 0 | 449 | 107 | 322 |
| 14/3/2021 | 641 | 225 | 0 | 0 | 93 | 443 | 88 | 473 |
This covers an unusually long period of time because I was stuck in the UK for January, February and most of March due to Covid travel restrictions. But this is also convenient for making a more exaggerated example. So the period between 12th December and 14th March contains a total of 92 days. That splits into the two periods "12th December - 31st December" and "1st January - 14th March", which contain 20 and 72 days respectively. The proportion of time for each of these periods is therefore 20 / 92 = 21.74% that falls into 2020 and 72 / 92 = 78.26% that falls into 2021.
To manage the data split across the year, we therefore have to scale it appropriately. Each entry represents the end of a period, so the 12th December data falls entirely within 2020. The 14th March data represents the period that's split across both years. We can therefore scale this entry and turn it into two separate entries like this, scaling each of the data points based on the proportions calculated above.
| Date | Paper | Card | Glass | Metal | Returnables | Composts | Plastic | General |
|---|---|---|---|---|---|---|---|---|
| 31/12/2020 | 139.35 | 48.91 | 0 | 0 | 20.22 | 96.30 | 19.13 | 102.83 |
| 14/3/2021 | 501.65 | 176.09 | 0 | 0 | 72.78 | 346.70 | 68.87 | 370.17 |
To get the correct picture this has to be done at both ends of the year being plotted.
Managing the data this way makes some obvious assumptions which may not necessarily be true (it assumes I generate waste uniformly across the time period, which is obviously not the case). However it has several nice properties. The annual histograms get drawn in a way that broadly speaking matches up across the year boundary; and the annual averages also match up correctly. At least, it seems to me to be the most honest way to tackle the issue when apportioning the data across year boundaries.
Check back to my waste page over time to see how I'm getting on with keping my waste output down (or not), and whether I'm able to hit my 2021 target.
Comments
Uncover Disqus comments