Not Found
Sorry, but I couldn't find the page that you requested. Maybe it's been lost? Or deleted? Or stolen?!
Click the 'back' button of your browser to return to where you came from, or alternatively, you can always return Home.
Blog
25 Apr 2024 : Day 227 #
Things started falling into place yesterday when the reasons for the crashes became clear. Although the value of embedlite.compositor.external_gl_context was being set correctly to different values depending on whether the running application was the browser or a WebView, the value was being reversed in the case of the browser because the WebEngineSettings::initialize() was being called twice. This initialize() method is supposed to be idempotent (which you have to admit, is a great word!), but due to a glitch in the logic turned out not to be.
The fix was to change the ordering of the execution: moving the place where isInitialized gets set to before the early return caused by the existence of a marker file. That all sounds a bit esoteric, but it was a simple change. I've now lined up all of the pieces so that:
But unfortunately not quite yet. After making these changes, the browser works fine, but I now get a crash when running the WebView application:
And that's exactly what has happened now. Without keeping track of the changes, I'm fairly certain I'd have got in a mess and forgotten I'd made these changes. Now I can reverse them easily.
Having made this reversal, build and installed the executable and run the code I'm very happy to see that:
If you'd like to read any of my other gecko diary entries, they're all available on my Gecko-dev Diary page.
Comment
The fix was to change the ordering of the execution: moving the place where isInitialized gets set to before the early return caused by the existence of a marker file. That all sounds a bit esoteric, but it was a simple change. I've now lined up all of the pieces so that:
- embedlite.compositor.external_gl_context is set to true in WebEngineSettings::initialize().
- embedlite.compositor.external_gl_context is set to false in DeclarativeWebUtils::setRenderingPreferences().
- isInitialized is set in the correct place.
But unfortunately not quite yet. After making these changes, the browser works fine, but I now get a crash when running the WebView application:
Thread 37 "Compositor" received signal SIGSEGV, Segmentation fault.
[Switching to Thread 0x7f1f94d7e0 (LWP 7616)]
0x0000007ff1105978 in mozilla::gl::GLScreenBuffer::Size (this=0x0)
    at ${PROJECT}/obj-build-mer-qt-xr/dist/include/mozilla/UniquePtr.h:290
290     ${PROJECT}/obj-build-mer-qt-xr/dist/include/mozilla/UniquePtr.h: No
    such file or directory.
(gdb) bt
#0  0x0000007ff1105978 in mozilla::gl::GLScreenBuffer::Size (this=0x0)
    at ${PROJECT}/obj-build-mer-qt-xr/dist/include/mozilla/UniquePtr.h:290
#1  mozilla::gl::GLContext::OffscreenSize (this=this@entry=0x7ee019aa70)
    at gfx/gl/GLContext.cpp:2141
#2  0x0000007ff3664264 in mozilla::embedlite::EmbedLiteCompositorBridgeParent::
    CompositeToDefaultTarget (this=0x7fc4ad3530, aId=...)
    at mobile/sailfishos/embedthread/EmbedLiteCompositorBridgeParent.cpp:156
#3  0x0000007ff12b48d8 in mozilla::layers::CompositorVsyncScheduler::
    ForceComposeToTarget (this=0x7fc4c36e00, aTarget=aTarget@entry=0x0,
    aRect=aRect@entry=0x0)
    at ${PROJECT}/obj-build-mer-qt-xr/dist/include/mozilla/layers/LayersTypes.h:
    82
#4  0x0000007ff12b4934 in mozilla::layers::CompositorBridgeParent::
    ResumeComposition (this=this@entry=0x7fc4ad3530)
    at ${PROJECT}/obj-build-mer-qt-xr/dist/include/mozilla/RefPtr.h:313
#5  0x0000007ff12b49c0 in mozilla::layers::CompositorBridgeParent::
    ResumeCompositionAndResize (this=0x7fc4ad3530, x=<optimized out>,
    y=<optimized out>,
    width=<optimized out>, height=<optimized out>)
    at gfx/layers/ipc/CompositorBridgeParent.cpp:794
#6  0x0000007ff12ad55c in mozilla::detail::RunnableMethodArguments<int, int,
    int, int>::applyImpl<mozilla::layers::CompositorBridgeParent, void (mozilla:
    :layers::CompositorBridgeParent::*)(int, int, int, int),
    StoreCopyPassByConstLRef<int>, StoreCopyPassByConstLRef<int>,
    StoreCopyPassByConstLRef<int>, StoreCopyPassByConstLRef<int>, 0ul, 1ul,
    2ul, 3ul> (args=..., m=<optimized out>, o=<optimized out>)
    at ${PROJECT}/obj-build-mer-qt-xr/dist/include/nsThreadUtils.h:1151
[...]
#18 0x0000007ff6a0289c in thread_start () at ../sysdeps/unix/sysv/linux/aarch64/
    clone.S:78
(gdb)
Thinking back, or more precisely looking back through my diary entries the reason becomes clear. You may recall that back on Day 221 I made some changes in the hope of them fixing the browser rendering. The changes are summarised by this diff:
$ git diff -- gfx/layers/opengl/CompositorOGL.cpp
diff --git a/gfx/layers/opengl/CompositorOGL.cpp b/gfx/layers/opengl/
    CompositorOGL.cpp
index 8a423b840dd5..11105c77c43b 100644
--- a/gfx/layers/opengl/CompositorOGL.cpp
+++ b/gfx/layers/opengl/CompositorOGL.cpp
@@ -246,12 +246,14 @@ already_AddRefed<mozilla::gl::GLContext> CompositorOGL::
    CreateContext() {

   // Allow to create offscreen GL context for main Layer Manager
   if (!context && gfxEnv::LayersPreferOffscreen()) {
+    SurfaceCaps caps = SurfaceCaps::ForRGB();
+    caps.preserve = false;
+    caps.bpp16 = gfxVars::OffscreenFormat() == SurfaceFormat::R5G6B5_UINT16;
+
     nsCString discardFailureId;
-    context = GLContextProvider::CreateHeadless(
-        {CreateContextFlags::REQUIRE_COMPAT_PROFILE}, &discardFailureId);
-    if (!context->CreateOffscreenDefaultFb(mSurfaceSize)) {
-      context = nullptr;
-    }
+    context = GLContextProvider::CreateOffscreen(
+        mSurfaceSize, caps, CreateContextFlags::REQUIRE_COMPAT_PROFILE,
+        &discardFailureId);
   }
[...]
Now that the underlying error is clear it's time to reverse this change. At the time I even noted the importance of these diary entries as a way of helping in case I might have to do something like this:
Things will get a bit messy the more I change, but the beauty of these diaries is that I'll be keeping a full record. So it should all be clear what gets changed.
And that's exactly what has happened now. Without keeping track of the changes, I'm fairly certain I'd have got in a mess and forgotten I'd made these changes. Now I can reverse them easily.
Having made this reversal, build and installed the executable and run the code I'm very happy to see that:
- The browser now works again, rendering and all.
- The WebVew app no longer crashes.
If you'd like to read any of my other gecko diary entries, they're all available on my Gecko-dev Diary page.
24 Apr 2024 : Day 226 #
Having solved the mystery of the crashing browser, the question today is what to do about it. What I can't immediately understand is how in ESR 78 the value read off for the embedlite.compositor.external_gl_context preference is true when the browser is run, but false when the WebView app is run.
We can see the difference quite clearly from stepping through the AllocPLayerTransactionParent() method on ESR 78. First, this is what we see when running the browser. We can clearly observe that mUseExternalGLContext is set to true:
It turns out the browser startup sequence is a bit messy. The sequence it goes through (along with a whole bunch of other stuff) is to first call initialize(). This method has a guard inside it to prevent the content of the method being called multiple times and which looks like this:
But now comes the catch. A little later on in the execution sequence initialize() is called again. At this point, were the isInitialized value set to true the method would return early and the contents of the method would be skipped. All would be good. But the problem is that it's not set to true, it's still set to false.
That's because the code that sets it to true is at the end of the method and on first execution the method is returning early due to a separate check; this one:
The fact it's exiting early here makes sense. But I don't think it makes sense for the isInitialized variable to be left as it is. I think it should be set to true even if the method exits early at this point.
In case you want to see the full gory details for yourself (trust me: you don't!), here's the step through that shows this sequence of events:
If you'd like to read any of my other gecko diary entries, they're all available on my Gecko-dev Diary page.
Comment
We can see the difference quite clearly from stepping through the AllocPLayerTransactionParent() method on ESR 78. First, this is what we see when running the browser. We can clearly observe that mUseExternalGLContext is set to true:
Thread 39 "Compositor" hit Breakpoint 2, mozilla::embedlite::
    EmbedLiteCompositorBridgeParent::AllocPLayerTransactionParent (
    this=0x7f809d5670, aBackendHints=..., aId=...)
    at mobile/sailfishos/embedthread/EmbedLiteCompositorBridgeParent.cpp:77
77        PLayerTransactionParent* p =
(gdb) n
80        EmbedLiteWindowParent *parentWindow = EmbedLiteWindowParent::From(
    mWindowId);
(gdb) p mUseExternalGLContext
$2 = true
(gdb)
When stepping through the same bit of code when running harbour-webview, mUseExternalGLContext is set to false:
Thread 34 "Compositor" hit Breakpoint 1, mozilla::embedlite::
    EmbedLiteCompositorBridgeParent::AllocPLayerTransactionParent (
    this=0x7f8cb70d50, aBackendHints=..., aId=...)
    at mobile/sailfishos/embedthread/EmbedLiteCompositorBridgeParent.cpp:77
77        PLayerTransactionParent* p =
(gdb) n
80        EmbedLiteWindowParent *parentWindow = EmbedLiteWindowParent::From(
    mWindowId);
(gdb) n
81        if (parentWindow) {
(gdb) p mUseExternalGLContext
$1 = false
(gdb)
How can this be? There must be somewhere it's being changed. I notice that the value is set in the embedding.js file. Could that be it?
// Make gecko compositor use GL context/surface provided by the application.
pref("embedlite.compositor.external_gl_context", false);
// Request the application to create GLContext for the compositor as
// soon as the top level PuppetWidget is creted for the view. Setting
// this pref only makes sense when using external compositor gl context.
pref("embedlite.compositor.request_external_gl_context_early", false);
The other thing I notice is that the value is set to true in declarativewebutils.cpp, which is part of the sailfish-browser code:
void DeclarativeWebUtils::setRenderingPreferences()
{
    SailfishOS::WebEngineSettings *webEngineSettings = SailfishOS::
    WebEngineSettings::instance();

    // Use external Qt window for rendering content
    webEngineSettings->setPreference(QString(
        "gfx.compositor.external-window"), QVariant(true));
    webEngineSettings->setPreference(QString(
        "gfx.compositor.clear-context"), QVariant(false));
    webEngineSettings->setPreference(QString(
        "gfx.webrender.force-disabled"), QVariant(true));
    webEngineSettings->setPreference(QString(
        "embedlite.compositor.external_gl_context"), QVariant(true));
}
And this wasn't a change made by me:
$ git blame apps/core/declarativewebutils.cpp -L239,239
d8932efa1 src/browser/declarativewebutils.cpp (Raine Makelainen 2016-09-19 20:
    16:59 +0300 239)     webEngineSettings->setPreference(QString(
    "embedlite.compositor.external_gl_context"), QVariant(true));
So the key methods that are of interest to us are WebEngineSettings::initialize() in the sailfish-components-webview project, since this is where I've set the value to false and DeclarativeWebUtils::setRenderingPreferences() in the sailfish-browser project, since this is where, historically, the value was always forced to true on browser start-up.It turns out the browser startup sequence is a bit messy. The sequence it goes through (along with a whole bunch of other stuff) is to first call initialize(). This method has a guard inside it to prevent the content of the method being called multiple times and which looks like this:
    static bool isInitialized = false;
    if (isInitialized) {
        return;
    }
The first time the method is called the isInitialized static variable is set to false and the contents of the method executes. As per our updated code this sets the embedlite.compositor.external_gl_context static preference to false. This is all fine for the WebView. In the case of the browser the setRenderingPreferences() method is called shortly after, setting the value to true. This is all present and correct.But now comes the catch. A little later on in the execution sequence initialize() is called again. At this point, were the isInitialized value set to true the method would return early and the contents of the method would be skipped. All would be good. But the problem is that it's not set to true, it's still set to false.
That's because the code that sets it to true is at the end of the method and on first execution the method is returning early due to a separate check; this one:
    // Guard preferences that should be written only once. If a preference
    // needs to be
    // forcefully written upon each start that should happen before this.
    QString appConfig = QStandardPaths::writableLocation(QStandardPaths::
    AppDataLocation);
    QFile markerFile(QString("%1/__PREFS_WRITTEN__").arg(appConfig));
    if (markerFile.exists()) {
        return;
    }
This call causes the method to exit early so that the isInitialized variable never gets set.The fact it's exiting early here makes sense. But I don't think it makes sense for the isInitialized variable to be left as it is. I think it should be set to true even if the method exits early at this point.
In case you want to see the full gory details for yourself (trust me: you don't!), here's the step through that shows this sequence of events:
$ gdb sailfish-browser
[...]
(gdb) b DeclarativeWebUtils::setRenderingPreferences
Breakpoint 1 at 0x42c48: file ../core/declarativewebutils.cpp, line 233.
(gdb) b WebEngineSettings::initialize
Breakpoint 2 at 0x22ce4
(gdb) r
Starting program: /usr/bin/sailfish-browser
[...]
Thread 1 "sailfish-browse" hit Breakpoint 2, SailfishOS::
    WebEngineSettings::initialize () at webenginesettings.cpp:96
96          if (isInitialized) {
(gdb) p isInitialized
$4 = false
(gdb) n
[...]
135         if (markerFile.exists()) {
(gdb)
136             return;
(gdb) c
Continuing.

Thread 1 "sailfish-browse" hit Breakpoint 1, DeclarativeWebUtils::
    setRenderingPreferences (this=0x55556785f0) at ../core/
    declarativewebutils.cpp:233
233         SailfishOS::WebEngineSettings *webEngineSettings = SailfishOS::
    WebEngineSettings::instance();
(gdb) c
Continuing.

Thread 1 "sailfish-browse" hit Breakpoint 2, SailfishOS::
    WebEngineSettings::initialize () at webenginesettings.cpp:96
96          if (isInitialized) {
(gdb) p isInitialized
$5 = false
(gdb) n
[...]
135         if (markerFile.exists()) {
(gdb)
136             return;
(gdb) c
Continuing.
[...]
At any rate, it looks like I have some kind of solution: set the preference in both places, but make sure the isInitialized value gets set correctly by moving the place it's set to above the condition that returns early. Tomorrow I'll install the packages with this change and give it a go.If you'd like to read any of my other gecko diary entries, they're all available on my Gecko-dev Diary page.
23 Apr 2024 : Day 225 #
As we left things yesterday we were looking at nsWindow::GetNativeData() and the fact it does things the same way for both ESR 78 and ESR 91, simply returning GetGLContext() in response to a NS_NATIVE_OPENGL_CONTEXT parameter being passed in.
Interestingly, this call to GetGLContext() is exactly where we saw the GLContext being created on ESR 78 on day 223. So it's quite possible that both calls are going through on both versions, yet while it succeeds on ESR 78, it fails on ESR 91. It's not at all clear why that might be. Time to find out.
Crucially there is a difference between the code in GetGLContext() on ESR 78 compared to the code on ESR 91. Here's the very start of the ESR 78 method:
The value of the static pref is set to true by default, as we can see in the StaticPrefList.yaml file:
However, the next time I fire the browser up it crashes again. And when I check the preferences file I can see the value has switched back to false. That's because I've set it to do that in WebEngineSettings that's part of sailfish-components-webview:
But I obviously wasn't entirely comfortable with this at the time and went on to write the following:
But now I need the opposite, so for the time being I've disabled the forcing of this preference in sailfish-components-webview. That change necessitated (of course) a rebuild and reinstallation of the component.
The browser is now back up and running. Hooray! But the WebView now crashes before it even attempts to render a page. That's not unexpected and presumably will take us back to this failure to call PrepareOffscreen(). I'm going to investigate that further, but not today, it'll have to wait until tomorrow.
Even though this was one step backwards, one step forwards, it still feels like progress. We'll get there.
If you'd like to read any of my other gecko diary entries, they're all available on my Gecko-dev Diary page.
Comment
Interestingly, this call to GetGLContext() is exactly where we saw the GLContext being created on ESR 78 on day 223. So it's quite possible that both calls are going through on both versions, yet while it succeeds on ESR 78, it fails on ESR 91. It's not at all clear why that might be. Time to find out.
Crucially there is a difference between the code in GetGLContext() on ESR 78 compared to the code on ESR 91. Here's the very start of the ESR 78 method:
GLContext*
nsWindow::GetGLContext() const
{
  LOGT("this:%p, UseExternalContext:%d", this, sUseExternalGLContext);
  if (sUseExternalGLContext) {
    void* context = nullptr;
    void* surface = nullptr;
    void* display = nullptr;
[...]
Notice how the entrance to the main body of the function is gated by a variable called sUseExternalGLContext. In order for this method to return something non-null, it's essential that this is set to true. On ESR 91 this has changed from a variable to a static preference that looks like this:
GLContext*
nsWindow::GetGLContext() const
{
  LOGT("this:%p, UseExternalContext:%d", this,
      StaticPrefs::embedlite_compositor_external_gl_context());
  if (StaticPrefs::embedlite_compositor_external_gl_context()) {
    void* context = nullptr;
    void* surface = nullptr;
    void* display = nullptr;
[...]
This was actually a change I made myself and it's not really a very dramatic change at all. In ESR 78 the sUseExternalGLContext variable was being mirrored from a static preference, which is one that can be read very quickly, so there was no real reason to copy it into a variable. Hence I just switched out the variable with direct accesses of the static pref instead. That was all documented back on Day 97.The value of the static pref is set to true by default, as we can see in the StaticPrefList.yaml file:
# Make gecko compositor use GL context/surface provided by the application
-   name: embedlite.compositor.external_gl_context
    type: bool
    value: true
    mirror: always
However this value can be overidden by the preferences, stored in ~/.local/share/org.sailfishos/browser/.mozilla/prefs.js. Looking inside that file I see the following:
user_pref("embedlite.compositor.external_gl_context", false);I've switched that back to true and now, when I run the browser... woohoo! Rendering works again. Great! This is a huge relief. The onscreen rendering pipeline is still working just fine.
However, the next time I fire the browser up it crashes again. And when I check the preferences file I can see the value has switched back to false. That's because I've set it to do that in WebEngineSettings that's part of sailfish-components-webview:
    // Ensure the renderer is configured correctly
    engineSettings->setPreference(QStringLiteral(
        "gfx.webrender.force-disabled"),
        QVariant(true));
    engineSettings->setPreference(QStringLiteral(
        "embedlite.compositor.external_gl_context"),
        QVariant(false));
And the reason for that was documented back on Day 165, where I wrote this:As we can see, it comes down to this embedlite.compositor.external_gl_context static preference, which needs to be set to false for the condition to be entered.
But I obviously wasn't entirely comfortable with this at the time and went on to write the following:
I'm going to set it to <tt>false</tt> explicitly for the WebView. But this
    immediately makes me feel nervous: this setting isn't new and there's a
    reason it's not being touched in the WebView code. It makes me think that
    I'm travelling down a rendering pipeline path that I shouldn't be.
And so it panned out. Looming back at what I wrote then, the issue I was trying to address by flipping the static preference was the need to enter the condition in the following bit of code:
PLayerTransactionParent*
EmbedLiteCompositorBridgeParent::AllocPLayerTransactionParent(const
    nsTArray<LayersBackend>& aBackendHints,
    const LayersId&
    aId)
{
  PLayerTransactionParent* p =
    CompositorBridgeParent::AllocPLayerTransactionParent(aBackendHints, aId);

  EmbedLiteWindowParent *parentWindow = EmbedLiteWindowParent::From(mWindowId);
  if (parentWindow) {
    parentWindow->GetListener()->CompositorCreated();
  }

  if (!StaticPrefs::embedlite_compositor_external_gl_context()) {
    // Prepare Offscreen rendering context
    PrepareOffscreen();
  }
  return p;
}
I wanted PrepareOffscreen() to be called and negating this preference seemed the neatest and easiest way to make it happen.But now I need the opposite, so for the time being I've disabled the forcing of this preference in sailfish-components-webview. That change necessitated (of course) a rebuild and reinstallation of the component.
The browser is now back up and running. Hooray! But the WebView now crashes before it even attempts to render a page. That's not unexpected and presumably will take us back to this failure to call PrepareOffscreen(). I'm going to investigate that further, but not today, it'll have to wait until tomorrow.
Even though this was one step backwards, one step forwards, it still feels like progress. We'll get there.
If you'd like to read any of my other gecko diary entries, they're all available on my Gecko-dev Diary page.
22 Apr 2024 : Day 224 #
Before we get started, a content warning. If you're a little squeamish or discussions about human illness make you uncomfortable, this might be one to skip.
Because today was not the day of development I was hoping it was going to be. Last night I found myself experiencing a bad case of food poisoning. I woke in the middle of the night, or maybe I never went to sleep, feeling deeply uncomfortable. After a long period of unrest I eventually found myself arched over the toilet bowl emptying the contents of my stomach into it.
I've spent the rest of the day recuperating, mostly sleeping, consuming only liquids (large quantities of Lucozade) and drifting in and out of consciousness. It seems like it was something I ate, which means it's just a case of waiting it out, but the lack of sleep, elevated temperature and general discomfort has left me in a state of hazy semi- coherence. Focusing has not really been an option.
After having spent the day like this it's now late evening and the chance for me to do much of anything let alone development, has sadly passed.
But I'm going to try to seize the moment nonetheless. There's one simple thing I think I can do that will help my task tomorrow. You'll recall that the question I need to answer is why the following is returning a value on ESR 78, but returning null on ESR 91:
The process for checking this is simple with the debugger: place a breakpoint on CompositorOGL::CreateContext() as before. When it hits, place a new breakpoint on every version of GetNativeData(), run the code onward and wait to see which one is hit first.
Here goes, first with ESR 78:
I've not made a lot of progress today, but perhaps that's to be expected. I'll continue following this lead up tomorrow.
If you'd like to read any of my other gecko diary entries, they're all available on my Gecko-dev Diary page.
Comment
Because today was not the day of development I was hoping it was going to be. Last night I found myself experiencing a bad case of food poisoning. I woke in the middle of the night, or maybe I never went to sleep, feeling deeply uncomfortable. After a long period of unrest I eventually found myself arched over the toilet bowl emptying the contents of my stomach into it.
I've spent the rest of the day recuperating, mostly sleeping, consuming only liquids (large quantities of Lucozade) and drifting in and out of consciousness. It seems like it was something I ate, which means it's just a case of waiting it out, but the lack of sleep, elevated temperature and general discomfort has left me in a state of hazy semi- coherence. Focusing has not really been an option.
After having spent the day like this it's now late evening and the chance for me to do much of anything let alone development, has sadly passed.
But I'm going to try to seize the moment nonetheless. There's one simple thing I think I can do that will help my task tomorrow. You'll recall that the question I need to answer is why the following is returning a value on ESR 78, but returning null on ESR 91:
  void* widgetOpenGLContext =
      widget ? widget->GetNativeData(NS_NATIVE_OPENGL_CONTEXT) : nullptr;
The GetNativeData() method is an override, which means that there are potentially multiple different versions that might be being called when this bit of code is executed. The pointer to the method will be taken from the widget object's vtable. So it would be useful to know what method is actually being called on the two different versions of the browser.
The process for checking this is simple with the debugger: place a breakpoint on CompositorOGL::CreateContext() as before. When it hits, place a new breakpoint on every version of GetNativeData(), run the code onward and wait to see which one is hit first.
Here goes, first with ESR 78:
Thread 39 "Compositor" hit Breakpoint 1, mozilla::layers::
CompositorOGL::CreateContext (this=0x7ea0003420)
at gfx/layers/opengl/CompositorOGL.cpp:223
223 already_AddRefed<mozilla::gl::GLContext> CompositorOGL::CreateContext()
{
(gdb) b GetNativeData
Breakpoint 2 at 0x7fbbdbe5e0: GetNativeData. (5 locations)
(gdb) c
Continuing.
Thread 39 "Compositor" hit Breakpoint 2, mozilla::embedlite::nsWindow:
:GetNativeData (this=0x7f80c8d500, aDataType=12)
at mobile/sailfishos/embedshared/nsWindow.cpp:176
176 LOGT("t:%p, DataType: %i", this, aDataType);
(gdb) bt
#0 mozilla::embedlite::nsWindow::GetNativeData (this=0x7f80c8d500,
aDataType=12)
at mobile/sailfishos/embedshared/nsWindow.cpp:176
#1 0x0000007fba682718 in mozilla::layers::CompositorOGL::CreateContext (
this=0x7ea0003420)
at gfx/layers/opengl/CompositorOGL.cpp:228
#2 0x0000007fba6a33a4 in mozilla::layers::CompositorOGL::Initialize (
this=0x7ea0003420, out_failureReason=0x7edb30b720)
at gfx/layers/opengl/CompositorOGL.cpp:374
#3 0x0000007fba77aff4 in mozilla::layers::CompositorBridgeParent::
NewCompositor (this=this@entry=0x7f807596a0, aBackendHints=...)
at gfx/layers/ipc/CompositorBridgeParent.cpp:1534
#4 0x0000007fba784660 in mozilla::layers::CompositorBridgeParent::
InitializeLayerManager (this=this@entry=0x7f807596a0, aBackendHints=...)
at gfx/layers/ipc/CompositorBridgeParent.cpp:1491
#5 0x0000007fba7847a8 in mozilla::layers::CompositorBridgeParent::
AllocPLayerTransactionParent (this=this@entry=0x7f807596a0,
aBackendHints=..., aId=...)
at gfx/layers/ipc/CompositorBridgeParent.cpp:1587
#6 0x0000007fbca81234 in mozilla::embedlite::EmbedLiteCompositorBridgeParent::
AllocPLayerTransactionParent (this=0x7f807596a0, aBackendHints=...,
aId=...)
at mobile/sailfishos/embedthread/EmbedLiteCompositorBridgeParent.cpp:77
#7 0x0000007fba05f3f0 in mozilla::layers::PCompositorBridgeParent::
OnMessageReceived (this=0x7f807596a0, msg__=...) at
PCompositorBridgeParent.cpp:1391
[...]
#23 0x0000007fb735989c in thread_start () at ../sysdeps/unix/sysv/linux/aarch64/
clone.S:78
(gdb)
And then with ESR 91:
Thread 37 "Compositor" hit Breakpoint 1, mozilla::layers::
CompositorOGL::CreateContext (this=this@entry=0x7ed8002ed0)
at gfx/layers/opengl/CompositorOGL.cpp:227
227 already_AddRefed<mozilla::gl::GLContext> CompositorOGL::CreateContext()
{
(gdb) b GetNativeData
Breakpoint 2 at 0x7ff41fcef8: GetNativeData. (4 locations)
(gdb) c
Continuing.
Thread 37 "Compositor" hit Breakpoint 2, mozilla::embedlite::nsWindow:
:GetNativeData (this=0x7fc89ffc80, aDataType=12)
at mobile/sailfishos/embedshared/nsWindow.cpp:164
164 {
(gdb) bt
#0 mozilla::embedlite::nsWindow::GetNativeData (this=0x7fc89ffc80,
aDataType=12)
at mobile/sailfishos/embedshared/nsWindow.cpp:164
#1 0x0000007ff293aae4 in mozilla::layers::CompositorOGL::CreateContext (
this=this@entry=0x7ed8002ed0)
at gfx/layers/opengl/CompositorOGL.cpp:232
#2 0x0000007ff29503b8 in mozilla::layers::CompositorOGL::Initialize (
this=0x7ed8002ed0, out_failureReason=0x7fc17a8510)
at gfx/layers/opengl/CompositorOGL.cpp:397
#3 0x0000007ff2a66094 in mozilla::layers::CompositorBridgeParent::
NewCompositor (this=this@entry=0x7fc8a01850, aBackendHints=...)
at gfx/layers/ipc/CompositorBridgeParent.cpp:1493
#4 0x0000007ff2a71110 in mozilla::layers::CompositorBridgeParent::
InitializeLayerManager (this=this@entry=0x7fc8a01850, aBackendHints=...)
at gfx/layers/ipc/CompositorBridgeParent.cpp:1436
#5 0x0000007ff2a71240 in mozilla::layers::CompositorBridgeParent::
AllocPLayerTransactionParent (this=this@entry=0x7fc8a01850,
aBackendHints=..., aId=...)
at gfx/layers/ipc/CompositorBridgeParent.cpp:1546
#6 0x0000007ff4e07ca8 in mozilla::embedlite::EmbedLiteCompositorBridgeParent::
AllocPLayerTransactionParent (this=0x7fc8a01850, aBackendHints=...,
aId=...)
at mobile/sailfishos/embedthread/EmbedLiteCompositorBridgeParent.cpp:80
#7 0x0000007ff23fe52c in mozilla::layers::PCompositorBridgeParent::
OnMessageReceived (this=0x7fc8a01850, msg__=...) at
PCompositorBridgeParent.cpp:1285
[...]
#22 0x0000007fefba889c in thread_start () at ../sysdeps/unix/sysv/linux/aarch64/
clone.S:78
(gdb)
So in both cases the class that the GetNativeData() method is being called from is mozilla::embedlite::nsWindow::GetNativeData. Looking at the code for this method, there's a pretty svelte switch statement inside that depends on the aDataType value being passed in. In our case this value is always NS_NATIVE_OPENGL_CONTEXT. And the code for that case is pretty simple:
    case NS_NATIVE_OPENGL_CONTEXT: {
      MOZ_ASSERT(!GetParent());
      return GetGLContext();
    }
This is the same for both ESR 78 and ESR 91, so to get to the bottom of this will require digging a bit deeper. But at least we're one step further along.
I've not made a lot of progress today, but perhaps that's to be expected. I'll continue following this lead up tomorrow.
If you'd like to read any of my other gecko diary entries, they're all available on my Gecko-dev Diary page.
21 Apr 2024 : Day 223 #
I do love travelling by train. A big part of the reason for this is the freedom it gives me to do other things while I'm travelling. Cars and busses simply can't offer that same empowerment. But even then travelling by train isn't the same as sitting at a desk that's static relative to the motion of the surface of the earth. Debugging multiple phones simultaneously just isn't very convenient on a train.
And so now here I am, back home at my desk, and able to properly perform the debugging I attempted to do yesterday while hurtling between Birmingham and Cambridge at 120 km per hour. It also helps that I'm not feeling quite so exhausted this morning after a long day either.
The question I'm asking is, when using the browser, which of the routes I identified yesterday are followed when creating the GLContext object, since this is where the offscreen status is set and stored.
Using the debugger it's easy to find where this is happening on ESR 78:
Both backtraces have CompositorOGL::CreateContext() in them at frame 4 and 6 respectively, so that's presumably where the decision to go one way or the other is happening. In the ESR 78 executable nsWindow::GetGLContext() is being called from there, whilst in ESR 91 it's GLContextProviderEGL::CreateHeadless().
So the difference here appears to be that on ESR 91 the following condition is entered:
If you'd like to read any of my other gecko diary entries, they're all available on my Gecko-dev Diary page.
Comment
And so now here I am, back home at my desk, and able to properly perform the debugging I attempted to do yesterday while hurtling between Birmingham and Cambridge at 120 km per hour. It also helps that I'm not feeling quite so exhausted this morning after a long day either.
The question I'm asking is, when using the browser, which of the routes I identified yesterday are followed when creating the GLContext object, since this is where the offscreen status is set and stored.
Using the debugger it's easy to find where this is happening on ESR 78:
Thread 39 "Compositor" hit Breakpoint 1, mozilla::gl::GLContext::
    GLContext (this=this@entry=0x7ea01118b0, flags=mozilla::gl::
    CreateContextFlags::NONE,
    caps=..., sharedContext=sharedContext@entry=0x0, isOffscreen=false,
    useTLSIsCurrent=useTLSIsCurrent@entry=false)
    at gfx/gl/GLContext.cpp:274
274     GLContext::GLContext(CreateContextFlags flags, const SurfaceCaps& caps,
(gdb) bt
#0  mozilla::gl::GLContext::GLContext (this=this@entry=0x7ea01118b0,
    flags=mozilla::gl::CreateContextFlags::NONE, caps=...,
    sharedContext=sharedContext@entry=0x0, isOffscreen=false,
    useTLSIsCurrent=useTLSIsCurrent@entry=false)
    at gfx/gl/GLContext.cpp:274
#1  0x0000007fba607af0 in mozilla::gl::GLContextEGL::GLContextEGL (
    this=0x7ea01118b0, egl=0x7ea0110db0, flags=<optimized out>, caps=...,
    isOffscreen=<optimized out>, config=0x0, surface=0x5555cc3980,
    context=0x7ea0004d80)
    at gfx/gl/GLContextProviderEGL.cpp:472
#2  0x0000007fba60f0d8 in mozilla::gl::GLContextProviderEGL::
    CreateWrappingExisting (aContext=0x7ea0004d80, aSurface=0x5555cc3980,
    aDisplay=<optimized out>)
    at /home/flypig/Documents/Development/jolla/gecko-dev-project/gecko-dev/
    obj-build-mer-qt-xr/dist/include/mozilla/cxxalloc.h:33
#3  0x0000007fbca9a388 in mozilla::embedlite::nsWindow::GetGLContext (
    this=0x7f80945810)
    at mobile/sailfishos/embedshared/nsWindow.cpp:415
#4  0x0000007fba682718 in mozilla::layers::CompositorOGL::CreateContext (
    this=0x7ea0003420)
    at gfx/layers/opengl/CompositorOGL.cpp:228
#5  0x0000007fba6a33a4 in mozilla::layers::CompositorOGL::Initialize (
    this=0x7ea0003420, out_failureReason=0x7edb32d720)
    at gfx/layers/opengl/CompositorOGL.cpp:374
#6  0x0000007fba77aff4 in mozilla::layers::CompositorBridgeParent::
    NewCompositor (this=this@entry=0x7f808cbf80, aBackendHints=...)
    at gfx/layers/ipc/CompositorBridgeParent.cpp:1534
#7  0x0000007fba784660 in mozilla::layers::CompositorBridgeParent::
    InitializeLayerManager (this=this@entry=0x7f808cbf80, aBackendHints=...)
    at gfx/layers/ipc/CompositorBridgeParent.cpp:1491
#8  0x0000007fba7847a8 in mozilla::layers::CompositorBridgeParent::
    AllocPLayerTransactionParent (this=this@entry=0x7f808cbf80,
    aBackendHints=..., aId=...)
    at gfx/layers/ipc/CompositorBridgeParent.cpp:1587
#9  0x0000007fbca81234 in mozilla::embedlite::EmbedLiteCompositorBridgeParent::
    AllocPLayerTransactionParent (this=0x7f808cbf80, aBackendHints=...,
    aId=...)
    at mobile/sailfishos/embedthread/EmbedLiteCompositorBridgeParent.cpp:77
#10 0x0000007fba05f3f0 in mozilla::layers::PCompositorBridgeParent::
    OnMessageReceived (this=0x7f808cbf80, msg__=...) at
    PCompositorBridgeParent.cpp:1391
[...]
#26 0x0000007fb735989c in thread_start () at ../sysdeps/unix/sysv/linux/aarch64/
    clone.S:78
(gdb)
So this is the case of a call to CreateWrappingExisting():
already_AddRefed<GLContext> GLContextProviderEGL::CreateWrappingExisting(
    void* aContext, void* aSurface, void* aDisplay) {
[...]
  RefPtr<GLContextEGL> gl =
      new GLContextEGL(egl, CreateContextFlags::NONE, caps, false, config,
                       (EGLSurface)aSurface, (EGLContext)aContext);
[...]
On ESR 91 the situation is that we have a call to GLContextEGL::CreateEGLPBufferOffscreenContextImpl():
Thread 37 "Compositor" hit Breakpoint 1, mozilla::gl::GLContext::
    GLContext (this=this@entry=0x7f6019aa80, desc=...,
    sharedContext=sharedContext@entry=0x0,
    useTLSIsCurrent=useTLSIsCurrent@entry=false)
    at gfx/gl/GLContext.cpp:283
283     GLContext::GLContext(const GLContextDesc& desc, GLContext*
    sharedContext,
(gdb) bt
#0  mozilla::gl::GLContext::GLContext (this=this@entry=0x7f6019aa80, desc=...,
    sharedContext=sharedContext@entry=0x0,
    useTLSIsCurrent=useTLSIsCurrent@entry=false)
    at gfx/gl/GLContext.cpp:283
#1  0x0000007ff28a9450 in mozilla::gl::GLContextEGL::GLContextEGL (
    this=0x7f6019aa80,
    egl=std::shared_ptr<mozilla::gl::EglDisplay> (use count 5, weak count 2) =
    {...}, desc=..., config=0x5555ab3f60, surface=0x7f60004bb0,
    context=0x7f60004c30)
    at gfx/gl/GLContextProviderEGL.cpp:496
#2  0x0000007ff28cfd18 in mozilla::gl::GLContextEGL::CreateGLContext (egl=std::
    shared_ptr<mozilla::gl::EglDisplay> (use count 5, weak count 2) = {...},
    desc=..., config=<optimized out>, config@entry=0x5555ab3f60,
    surface=surface@entry=0x7f60004bb0, useGles=useGles@entry=true,
    out_failureId=out_failureId@entry=0x7fb179c1b8)
    at ${PROJECT}/obj-build-mer-qt-xr/dist/include/mozilla/cxxalloc.h:33
#3  0x0000007ff28d0858 in mozilla::gl::GLContextEGL::
    CreateEGLPBufferOffscreenContextImpl (
    egl=std::shared_ptr<mozilla::gl::EglDisplay> (use count 5, weak count 2) =
    {...}, desc=..., size=..., useGles=useGles@entry=true,
    out_failureId=out_failureId@entry=0x7fb179c1b8)
    at include/c++/8.3.0/ext/atomicity.h:96
#4  0x0000007ff28d0a6c in mozilla::gl::GLContextEGL::
    CreateEGLPBufferOffscreenContext (
    display=std::shared_ptr<mozilla::gl::EglDisplay> (use count 5, weak count
    2) = {...}, desc=..., size=...,
    out_failureId=out_failureId@entry=0x7fb179c1b8)
    at include/c++/8.3.0/ext/atomicity.h:96
#5  0x0000007ff28d0ba0 in mozilla::gl::GLContextProviderEGL::CreateHeadless (
    desc=..., out_failureId=out_failureId@entry=0x7fb179c1b8)
    at include/c++/8.3.0/ext/atomicity.h:96
#6  0x0000007ff293abc0 in mozilla::layers::CompositorOGL::CreateContext (
    this=this@entry=0x7f60002ed0)
    at gfx/layers/opengl/CompositorOGL.cpp:254
#7  0x0000007ff29503b8 in mozilla::layers::CompositorOGL::Initialize (
    this=0x7f60002ed0, out_failureReason=0x7fb179c510)
    at gfx/layers/opengl/CompositorOGL.cpp:397
#8  0x0000007ff2a66094 in mozilla::layers::CompositorBridgeParent::
    NewCompositor (this=this@entry=0x7fc89abd50, aBackendHints=...)
    at gfx/layers/ipc/CompositorBridgeParent.cpp:1493
#9  0x0000007ff2a71110 in mozilla::layers::CompositorBridgeParent::
    InitializeLayerManager (this=this@entry=0x7fc89abd50, aBackendHints=...)
    at gfx/layers/ipc/CompositorBridgeParent.cpp:1436
#10 0x0000007ff2a71240 in mozilla::layers::CompositorBridgeParent::
    AllocPLayerTransactionParent (this=this@entry=0x7fc89abd50,
    aBackendHints=..., aId=...)
    at gfx/layers/ipc/CompositorBridgeParent.cpp:1546
#11 0x0000007ff4e07ca8 in mozilla::embedlite::EmbedLiteCompositorBridgeParent::
    AllocPLayerTransactionParent (this=0x7fc89abd50, aBackendHints=...,
    aId=...)
    at mobile/sailfishos/embedthread/EmbedLiteCompositorBridgeParent.cpp:80
#12 0x0000007ff23fe52c in mozilla::layers::PCompositorBridgeParent::
    OnMessageReceived (this=0x7fc89abd50, msg__=...) at
    PCompositorBridgeParent.cpp:1285
[...]
#27 0x0000007fefba889c in thread_start () at ../sysdeps/unix/sysv/linux/aarch64/
    clone.S:78
(gdb)
These differences are bigger than expected; I'll need to realign them.Both backtraces have CompositorOGL::CreateContext() in them at frame 4 and 6 respectively, so that's presumably where the decision to go one way or the other is happening. In the ESR 78 executable nsWindow::GetGLContext() is being called from there, whilst in ESR 91 it's GLContextProviderEGL::CreateHeadless().
So the difference here appears to be that on ESR 91 the following condition is entered:
  // Allow to create offscreen GL context for main Layer Manager
  if (!context && gfxEnv::LayersPreferOffscreen()) {
[...]
On ESR 78 it's never reached. The reason becomes clear as I step through the code. The value of the widgetOpenGLContext variable that's collected from the widget is non-null, causing the method to exit early:
Thread 39 "Compositor" hit Breakpoint 1, mozilla::layers::
    CompositorOGL::CreateContext (this=0x7ea0003420)
    at gfx/layers/opengl/CompositorOGL.cpp:223
223     already_AddRefed<mozilla::gl::GLContext> CompositorOGL::CreateContext()
    {
(gdb) n
227       nsIWidget* widget = mWidget->RealWidget();
(gdb) p context
$1 = {mRawPtr = 0x0}
(gdb) n
228       void* widgetOpenGLContext =
(gdb) p widget
$2 = (nsIWidget *) 0x7f80c86f60
(gdb) n
230       if (widgetOpenGLContext) {
(gdb) p widgetOpenGLContext
$3 = (void *) 0x7ea0111800
(gdb)
As on ESR 78, on ESR 91 the value of context is set to null, while widget has a non-null value. But unlike on ESR 78 the widgetOpenGLContext that's retrieved from widget is null:
Thread 37 "Compositor" hit Breakpoint 1, mozilla::layers::
    CompositorOGL::CreateContext (this=this@entry=0x7ed8002ed0)
    at gfx/layers/opengl/CompositorOGL.cpp:227
227     already_AddRefed<mozilla::gl::GLContext> CompositorOGL::CreateContext()
    {
(gdb) n
231       nsIWidget* widget = mWidget->RealWidget();
(gdb) p context
$3 = {mRawPtr = 0x0}
(gdb) n
232       void* widgetOpenGLContext =
(gdb) p widget
$4 = (nsIWidget *) 0x7fc8550d80
(gdb) n
234       if (widgetOpenGLContext) {
(gdb) p widgetOpenGLContext
$5 = (void *) 0x0
(gdb)
As a consequence of this the method doesn't return early and the context is created via a different route as a result. So the question we have to answer is why the following is returning a value on ESR 78 but returning null on ESR 91:
  void* widgetOpenGLContext =
      widget ? widget->GetNativeData(NS_NATIVE_OPENGL_CONTEXT) : nullptr;
Finding out the answer to this will have to wait until tomorrow, when I have a bit more time in which I'll hopefully be able to get this sorted.If you'd like to read any of my other gecko diary entries, they're all available on my Gecko-dev Diary page.
20 Apr 2024 : Day 222 #
I'm travelling for work at the moment. Last night I stayed at an easyHotel. I'm a fan of the easyHotel concept: clean, cheap and well-located, but also tiny and basic. The fact that having a window is an optional paid-for extra tells you everything you need to know about the chain. There was just enough room around the edge of the bed to squeeze a human leg or two, but certainly no space for a desk. This presented me with a problem when it came to leaving my laptop running. I needed to have the build I started yesterday run overnight. Sending my laptop to sleep wasn't an option.
For a while I contemplated leaving it running on the bed next to me, but I had visions of waking up in the middle of night with my bed on fire or, worse, with my laptop shattered into little pieces having been thrown to the floor.
Eventually the very-helpful hotel staff found me a mini ironing board. After removing the cover it made a passable laptop rack. And so this morning I find myself in a coffee shop in the heart of Birmingham (which is itself the heart of the UK) with a freshly minted set of packages ready to try out on my phone.
The newly installed debug-symbol adorned binaries immediately deliver.
But, my time in this coffee shop is coming to an end, so that will be a task for my journey back to Cambridge this evening on the train.
[...]
I'm on the train again, heading back to Cambridge. My next task is to step through the CompositeToDefaultTarget() method on ESR 78. The question I want to know the answer to is whether it's making the call to context->OffscreenSize() or not.
Brace yourself for a lengthy debugging step-through. As I've typically come to say, feel free to skip this without losing the context.
Great! This is something with a very clear cause and which it should be possible to find a sensible fix for.
On ESR 91 the initial value of this flag is set to false:
This gives me something to dig into further tomorrow; but my train having arrived I'm going to have to leave it there for today. More tomorrow!
If you'd like to read any of my other gecko diary entries, they're all available on my Gecko-dev Diary page.
Comment
For a while I contemplated leaving it running on the bed next to me, but I had visions of waking up in the middle of night with my bed on fire or, worse, with my laptop shattered into little pieces having been thrown to the floor.
Eventually the very-helpful hotel staff found me a mini ironing board. After removing the cover it made a passable laptop rack. And so this morning I find myself in a coffee shop in the heart of Birmingham (which is itself the heart of the UK) with a freshly minted set of packages ready to try out on my phone.
The newly installed debug-symbol adorned binaries immediately deliver.
Thread 36 "Compositor" received signal SIGSEGV, Segmentation fault.
[Switching to Thread 0x7f39d297d0 (LWP 31614)]
0x0000007ff28a8978 in mozilla::gl::GLScreenBuffer::Size (this=0x0)
    at ${PROJECT}/obj-build-mer-qt-xr/dist/include/mozilla/UniquePtr.h:290
290     ${PROJECT}/obj-build-mer-qt-xr/dist/include/mozilla/UniquePtr.h: No
    such file or directory.
(gdb) bt
#0  0x0000007ff28a8978 in mozilla::gl::GLScreenBuffer::Size (this=0x0)
    at ${PROJECT}/obj-build-mer-qt-xr/dist/include/mozilla/UniquePtr.h:290
#1  mozilla::gl::GLContext::OffscreenSize (this=this@entry=0x7ee019aa30)
    at gfx/gl/GLContext.cpp:2141
#2  0x0000007ff4e07264 in mozilla::embedlite::EmbedLiteCompositorBridgeParent::
    CompositeToDefaultTarget (this=0x7fc8b77bc0, aId=...)
    at mobile/sailfishos/embedthread/EmbedLiteCompositorBridgeParent.cpp:156
#3  0x0000007ff2a578d8 in mozilla::layers::CompositorVsyncScheduler::
    ForceComposeToTarget (this=0x7fc8ca6a10, aTarget=aTarget@entry=0x0,
    aRect=aRect@entry=0x0)
    at ${PROJECT}/obj-build-mer-qt-xr/dist/include/mozilla/layers/LayersTypes.h:
    82
#4  0x0000007ff2a57934 in mozilla::layers::CompositorBridgeParent::
    ResumeComposition (this=this@entry=0x7fc8b77bc0)
    at ${PROJECT}/obj-build-mer-qt-xr/dist/include/mozilla/RefPtr.h:313
#5  0x0000007ff2a579c0 in mozilla::layers::CompositorBridgeParent::
    ResumeCompositionAndResize (this=0x7fc8b77bc0, x=<optimized out>,
    y=<optimized out>,
    width=<optimized out>, height=<optimized out>)
    at gfx/layers/ipc/CompositorBridgeParent.cpp:794
#6  0x0000007ff2a5055c in mozilla::detail::RunnableMethodArguments<int, int,
    int, int>::applyImpl<mozilla::layers::CompositorBridgeParent, void (mozilla:
    :layers::CompositorBridgeParent::*)(int, int, int, int),
    StoreCopyPassByConstLRef<int>, StoreCopyPassByConstLRef<int>,
    StoreCopyPassByConstLRef<int>, StoreCopyPassByConstLRef<int>, 0ul, 1ul,
    2ul, 3ul> (args=..., m=<optimized out>, o=<optimized out>)
    at ${PROJECT}/obj-build-mer-qt-xr/dist/include/nsThreadUtils.h:1151
[...]
#18 0x0000007fefba889c in thread_start () at ../sysdeps/unix/sysv/linux/aarch64/
    clone.S:78
(gdb)
The basis of the problem is that GLContext::OffscreenSize() is calling Size() on a value of GLScreenBuffer mScreen which is set to null:
const gfx::IntSize& GLContext::OffscreenSize() const {
  MOZ_ASSERT(IsOffscreen());
  return mScreen->Size();
}
Checking the diff, this GLContext::OffscreenSize() method was added by me as part of the recent shake-up of the offscreen render code. Here's the change I made in EmbedLiteCompositorBridgeParent.cpp that's making this call:
@@ -151,8 +153,7 @@ EmbedLiteCompositorBridgeParent::CompositeToDefaultTarget(
    VsyncId aId)

   if (context->IsOffscreen()) {
     MutexAutoLock lock(mRenderMutex);
-    if (context->GetSwapChain()->OffscreenSize() != mEGLSurfaceSize
-      && !context->GetSwapChain()->Resize(mEGLSurfaceSize)) {
+    if (context->OffscreenSize() != mEGLSurfaceSize &&
    !context->ResizeOffscreen(mEGLSurfaceSize)) {
       return;
     }
   }
As you can see CompositeToDefaultTarget() isn't new. It's the way its resizing the screen that's causing problems. Interestingly this change has actually reverted back to the code as it is in ESR 78. So that means I can step through the ESR 78 version to compare the two.But, my time in this coffee shop is coming to an end, so that will be a task for my journey back to Cambridge this evening on the train.
[...]
I'm on the train again, heading back to Cambridge. My next task is to step through the CompositeToDefaultTarget() method on ESR 78. The question I want to know the answer to is whether it's making the call to context->OffscreenSize() or not.
Brace yourself for a lengthy debugging step-through. As I've typically come to say, feel free to skip this without losing the context.
Thread 40 "Compositor" hit Breakpoint 1, mozilla::embedlite::
EmbedLiteCompositorBridgeParent::CompositeToDefaultTarget (
this=0x7f80a77420, aId=...)
at mobile/sailfishos/embedthread/EmbedLiteCompositorBridgeParent.cpp:137
137 {
(gdb) n
138 const CompositorBridgeParent::LayerTreeState* state =
CompositorBridgeParent::GetIndirectShadowTree(RootLayerTreeId());
(gdb) n
139 NS_ENSURE_TRUE(state && state->mLayerManager, );
(gdb) n
141 GLContext* context = static_cast<CompositorOGL*>(
state->mLayerManager->GetCompositor())->gl();
(gdb) n
142 NS_ENSURE_TRUE(context, );
(gdb) n
143 if (!context->IsCurrent()) {
(gdb) n
146 NS_ENSURE_TRUE(context->IsCurrent(), );
(gdb) p context->mIsOffscreen
$1 = false
(gdb) n
3566 /home/flypig/Documents/Development/jolla/gecko-dev-project/gecko-dev/
obj-build-mer-qt-xr/dist/include/GLContext.h: No such file or directory.
(gdb) n
156 ScopedScissorRect
Thread 37 "Compositor" hit Breakpoint 1, mozilla::embedlite::
EmbedLiteCompositorBridgeParent::CompositeToDefaultTarget (
this=0x7fc8a01040, aId=...)
at mobile/sailfishos/embedthread/EmbedLiteCompositorBridgeParent.cpp:143
143 {
(gdb) n
144 const CompositorBridgeParent::LayerTreeState* state =
CompositorBridgeParent::GetIndirectShadowTree(RootLayerTreeId());
(gdb) n
145 NS_ENSURE_TRUE(state && state->mLayerManager, );
(gdb) n
147 GLContext* context = static_cast<CompositorOGL*>(
state->mLayerManager->GetCompositor())->gl();
(gdb) n
148 NS_ENSURE_TRUE(context, );
(gdb) n
149 if (!context->IsCurrent()) {
(gdb) n
152 NS_ENSURE_TRUE(context->IsCurrent(), );
(gdb) p context->mDesc.isOffscreen
$2 = true
(gdb) n
3598 ${PROJECT}/obj-build-mer-qt-xr/dist/include/GLContext.h: No such file
or directory.
(gdb) n
155 MutexAutoLock lock(mRenderMutex);
(gdb) n
156 if (context->OffscreenSize() != mEGLSurfaceSize &&
!context->ResizeOffscreen(mEGLSurfaceSize)) {
(gdb) n
Thread 37 "Compositor" received signal SIGSEGV, Segmentation fault.
0x0000007ff28a8978 in mozilla::gl::GLScreenBuffer::Size (this=0x0)
at ${PROJECT}/obj-build-mer-qt-xr/dist/include/mozilla/UniquePtr.h:290
290 ${PROJECT}/obj-build-mer-qt-xr/dist/include/mozilla/UniquePtr.h: No
such file or directory.
(gdb)
So, for once, this is just as expected. On ESR 78 context->IsOffscreen() is returning false (as it should do), whereas on ESR 91 it's returning true.Great! This is something with a very clear cause and which it should be possible to find a sensible fix for.
On ESR 91 the initial value of this flag is set to false:
struct GLContextDesc final : public GLContextCreateDesc {
  bool isOffscreen = false;
};
The only place it gets set to true is in the GLContextEGL::CreateEGLPBufferOffscreenContextImpl() method:
  auto fullDesc = GLContextDesc{desc};
  fullDesc.isOffscreen = true;
In contrast on ESR 78 it's set in the constructor:
GLContext::GLContext(CreateContextFlags flags, const SurfaceCaps& caps,
                     GLContext* sharedContext, bool isOffscreen,
                     bool useTLSIsCurrent)
    : mUseTLSIsCurrent(ShouldUseTLSIsCurrent(useTLSIsCurrent)),
      mIsOffscreen(isOffscreen),
[...]
This constructor is called in two places. In GLContextEGL():
already_AddRefed<GLContextEGL> GLContextEGL::CreateGLContext(
    GLLibraryEGL* const egl, CreateContextFlags flags, const SurfaceCaps& caps,
    bool isOffscreen, EGLConfig config, EGLSurface surface, const bool useGles,
    nsACString* const out_failureId) {
[...]
  RefPtr<GLContextEGL> glContext =
      new GLContextEGL(egl, flags, caps, isOffscreen, config, surface, context);
[...]
And in CreateWrappingExisting():
already_AddRefed<GLContext> GLContextProviderEGL::CreateWrappingExisting(
    void* aContext, void* aSurface, void* aDisplay) {
[...]
  RefPtr<GLContextEGL> gl =
      new GLContextEGL(egl, CreateContextFlags::NONE, caps, false, config,
                       (EGLSurface)aSurface, (EGLContext)aContext);
[...]
The latter always ends up setting it to false as you can see. The former can also come from that route, but could also be arrived at via different routes, all of them in GLContextProviderEGL.cpp. It could be called from GLContextEGLFactory::CreateImpl() where it's always set to false:
already_AddRefed<GLContext> GLContextEGLFactory::CreateImpl(
    EGLNativeWindowType aWindow, bool aWebRender, bool aUseGles) {
[...]
  RefPtr<GLContextEGL> gl = GLContextEGL::CreateGLContext(
      egl, flags, caps, false, config, surface, aUseGles, &discardFailureId);
[...]
Or it could be called from GLContextEGL::CreateEGLPBufferOffscreenContextImpl() where it's always set to true:
/*static*/
already_AddRefed<GLContextEGL>
GLContextEGL::CreateEGLPBufferOffscreenContextImpl(
    CreateContextFlags flags, const mozilla::gfx::IntSize& size,
    const SurfaceCaps& minCaps, bool aUseGles,
    nsACString* const out_failureId) {
[...]
  RefPtr<GLContextEGL> gl = GLContextEGL::CreateGLContext(
      egl, flags, configCaps, true, config, surface, aUseGles, out_failureId);
[...]
The last of these is the only place where it can be set to true. So that's the one we have to focus on. Either there needs to be some more refined logic in there, or it shouldn't be going down that route at all.This gives me something to dig into further tomorrow; but my train having arrived I'm going to have to leave it there for today. More tomorrow!
If you'd like to read any of my other gecko diary entries, they're all available on my Gecko-dev Diary page.
19 Apr 2024 : Day 221 #
This morning I started looking at why the sailfish-browser has been broken by my changes to the offscreen rendering process. The approach I'm using is to look at the intersection of:
The first place I started looking was the CompositorOGL::CreateContext() method. This is the last method that gets called by sailfish-browser before the behaviour diverges from what I'd expect it to (as we saw yesterday). Plus I made very specific changes to this, as you can see from this portion of the diff:
Now when I transfer it over to my phone the browser crashes with a segmentation fault as soon as the page is loaded. I feel like I've been here before! Because it takes so long to transfer the libxul.so output from the partial build over to my phone I stripped it of debugging symbols before the transfer. This makes a huge difference to its size of the library (stripping out around 3 GiB of data to leave just 100 MiB of code). Unfortunately that means I can't now find out where or why the crash is occurring.
Even worse, performing another partial rebuild doesn't seem to restore the debug symbols. So the only thing for me to do is a full rebuild, which is an overnight job.
I'll do that, but in the meantime I'll continue browsing through the diff in case a reason jumps out at me, or there's something obvious that needs changing.
Things will get a bit messy the more I change, but the beauty of these diaries is that I'll be keeping a full record. So it should all be clear what gets changed and why.
If you'd like to read any of my other gecko diary entries, they're all available on my Gecko-dev Diary page.
Comment
- Parts of the code I've changed (as shown by the diff generated by git).
- Parts of the code that are touched by sailfish-browser (as indicated by gdb backtraces).
The first place I started looking was the CompositorOGL::CreateContext() method. This is the last method that gets called by sailfish-browser before the behaviour diverges from what I'd expect it to (as we saw yesterday). Plus I made very specific changes to this, as you can see from this portion of the diff:
$ git diff -- gfx/layers/opengl/CompositorOGL.cpp
diff --git a/gfx/layers/opengl/CompositorOGL.cpp b/gfx/layers/opengl/
    CompositorOGL.cpp
index 8a423b840dd5..11105c77c43b 100644
--- a/gfx/layers/opengl/CompositorOGL.cpp
+++ b/gfx/layers/opengl/CompositorOGL.cpp
@@ -246,12 +246,14 @@ already_AddRefed<mozilla::gl::GLContext> CompositorOGL::
    CreateContext() {

   // Allow to create offscreen GL context for main Layer Manager
   if (!context && gfxEnv::LayersPreferOffscreen()) {
+    SurfaceCaps caps = SurfaceCaps::ForRGB();
+    caps.preserve = false;
+    caps.bpp16 = gfxVars::OffscreenFormat() == SurfaceFormat::R5G6B5_UINT16;
+
     nsCString discardFailureId;
-    context = GLContextProvider::CreateHeadless(
-        {CreateContextFlags::REQUIRE_COMPAT_PROFILE}, &discardFailureId);
-    if (!context->CreateOffscreenDefaultFb(mSurfaceSize)) {
-      context = nullptr;
-    }
+    context = GLContextProvider::CreateOffscreen(
+        mSurfaceSize, caps, CreateContextFlags::REQUIRE_COMPAT_PROFILE,
+        &discardFailureId);
   }
[...]
I've reversed this change and performed a partial build.Now when I transfer it over to my phone the browser crashes with a segmentation fault as soon as the page is loaded. I feel like I've been here before! Because it takes so long to transfer the libxul.so output from the partial build over to my phone I stripped it of debugging symbols before the transfer. This makes a huge difference to its size of the library (stripping out around 3 GiB of data to leave just 100 MiB of code). Unfortunately that means I can't now find out where or why the crash is occurring.
Even worse, performing another partial rebuild doesn't seem to restore the debug symbols. So the only thing for me to do is a full rebuild, which is an overnight job.
I'll do that, but in the meantime I'll continue browsing through the diff in case a reason jumps out at me, or there's something obvious that needs changing.
Things will get a bit messy the more I change, but the beauty of these diaries is that I'll be keeping a full record. So it should all be clear what gets changed and why.
If you'd like to read any of my other gecko diary entries, they're all available on my Gecko-dev Diary page.
18 Apr 2024 : Day 220 #
My first task today is to figure out when and how often DeclarativeWebContainer::clearWindowSurface() gets called on ESR 78. As I discovered yesterday it's called only once on the latest ESR 91 build and that's the same build where things are broken now even for the sailfish-browser. So my hope is that this will lead to some insight as to why it's broken.
My suspicion is that it should be called often. In fact, each time the screen is updated. If that's the case then it will give me a clear issue to track down: why is it not being called every update on ESR 91.
For context, recall that DeclarativeWebContainer::clearWindowSurface() is not part of the gecko code itself, but rather part of the sailfish-browser code.
So, I'm firing up the debugger to find out.
Here are some of the calls and signals which potentially could result in a call to clearWindowSurface(). Not all of these are actually happening during the runs I've been testing:
What happens is that there's a break in the call stack. While the following aren't called:
If you'd like to read any of my other gecko diary entries, they're all available on my Gecko-dev Diary page.
Comment
My suspicion is that it should be called often. In fact, each time the screen is updated. If that's the case then it will give me a clear issue to track down: why is it not being called every update on ESR 91.
For context, recall that DeclarativeWebContainer::clearWindowSurface() is not part of the gecko code itself, but rather part of the sailfish-browser code.
So, I'm firing up the debugger to find out.
$ gdb sailfish-browser
[...]
(gdb) b DeclarativeWebContainer::clearWindowSurface
Breakpoint 1 at 0x3c750: file ../core/declarativewebcontainer.cpp, line 681.
(gdb) r
Starting program: /usr/bin/sailfish-browser
[...]
Created LOG for EmbedLite
[...]
Thread 1 "sailfish-browse" hit Breakpoint 1, DeclarativeWebContainer::
clearWindowSurface (this=0x55559bbc60) at ../core/
declarativewebcontainer.cpp:681
681 m_context->makeCurrent(this);
(gdb) bt
#0 DeclarativeWebContainer::clearWindowSurface (this=0x55559bbc60) at ../core/
declarativewebcontainer.cpp:681
#1 0x0000005555594e68 in DeclarativeWebContainer::exposeEvent (
this=0x55559bbc60) at ../core/declarativewebcontainer.cpp:815
#2 0x0000007fb83603dc in QWindow::event(QEvent*) () from /usr/lib64/
libQt5Gui.so.5
#3 0x0000005555594b8c in DeclarativeWebContainer::event (this=0x55559bbc60,
event=0x7fffffecf8) at ../core/declarativewebcontainer.cpp:770
#4 0x0000007fb7941144 in QCoreApplication::notify(QObject*, QEvent*) () from /
usr/lib64/libQt5Core.so.5
#5 0x0000007fb79412e8 in QCoreApplication::notifyInternal2(QObject*, QEvent*) (
) from /usr/lib64/libQt5Core.so.5
#6 0x0000007fb8356488 in QGuiApplicationPrivate::processExposeEvent(
QWindowSystemInterfacePrivate::ExposeEvent*) () from /usr/lib64/
libQt5Gui.so.5
#7 0x0000007fb83570b4 in QGuiApplicationPrivate::processWindowSystemEvent(
QWindowSystemInterfacePrivate::WindowSystemEvent*) ()
from /usr/lib64/libQt5Gui.so.5
#8 0x0000007fb83356e4 in QWindowSystemInterface::sendWindowSystemEvents(
QFlags<QEventLoop::ProcessEventsFlag>) () from /usr/lib64/libQt5Gui.so.5
#9 0x0000007faf65ac4c in ?? () from /usr/lib64/libQt5WaylandClient.so.5
#10 0x0000007fb70dfd34 in g_main_context_dispatch () from /usr/lib64/
libglib-2.0.so.0
#11 0x0000007fb70dffa0 in ?? () from /usr/lib64/libglib-2.0.so.0
#12 0x0000007fb70e0034 in g_main_context_iteration () from /usr/lib64/
libglib-2.0.so.0
#13 0x0000007fb7993a90 in QEventDispatcherGlib::processEvents(QFlags<QEventLoop:
:ProcessEventsFlag>) () from /usr/lib64/libQt5Core.so.5
#14 0x0000007fb793f608 in QEventLoop::exec(QFlags<QEventLoop::
ProcessEventsFlag>) () from /usr/lib64/libQt5Core.so.5
#15 0x0000007fb79471d4 in QCoreApplication::exec() () from /usr/lib64/
libQt5Core.so.5
#16 0x000000555557b360 in main (argc=<optimized out>, argv=<optimized out>) at
main.cpp:201
(gdb) c
Continuing.
[...]
Created LOG for EmbedLiteLayerManager
[...]
Thread 38 "Compositor" hit Breakpoint 1, DeclarativeWebContainer::
clearWindowSurface (this=0x55559bbc60) at ../core/
declarativewebcontainer.cpp:681
681 m_context->makeCurrent(this);
(gdb) bt
#0 DeclarativeWebContainer::clearWindowSurface (this=0x55559bbc60) at ../core/
declarativewebcontainer.cpp:681
#1 0x0000005555591910 in DeclarativeWebContainer::createGLContext (
this=0x55559bbc60) at ../core/declarativewebcontainer.cpp:1193
#2 0x0000007fb796b204 in QMetaObject::activate(QObject*, int, int, void**) ()
from /usr/lib64/libQt5Core.so.5
#3 0x0000007fbfb9f5c8 in QMozWindowPrivate::RequestGLContext (
this=0x5555b81290, context=@0x7edb46b2f0: 0x0, surface=@0x7edb46b2f8: 0x0,
display=@0x7edb46b300: 0x0) at qmozwindow_p.cpp:133
#4 0x0000007fbca9a374 in mozilla::embedlite::nsWindow::GetGLContext (
this=0x7f80ce9e90)
at mobile/sailfishos/embedshared/nsWindow.cpp:408
#5 0x0000007fba682718 in mozilla::layers::CompositorOGL::CreateContext (
this=0x7e98003420)
at gfx/layers/opengl/CompositorOGL.cpp:228
#6 0x0000007fba6a33a4 in mozilla::layers::CompositorOGL::Initialize (
this=0x7e98003420, out_failureReason=0x7edb46b720)
at gfx/layers/opengl/CompositorOGL.cpp:374
#7 0x0000007fba77aff4 in mozilla::layers::CompositorBridgeParent::
NewCompositor (this=this@entry=0x7f80ce94a0, aBackendHints=...)
at gfx/layers/ipc/CompositorBridgeParent.cpp:1534
#8 0x0000007fba784660 in mozilla::layers::CompositorBridgeParent::
InitializeLayerManager (this=this@entry=0x7f80ce94a0, aBackendHints=...)
at gfx/layers/ipc/CompositorBridgeParent.cpp:1491
#9 0x0000007fba7847a8 in mozilla::layers::CompositorBridgeParent::
AllocPLayerTransactionParent (this=this@entry=0x7f80ce94a0,
aBackendHints=..., aId=...)
at gfx/layers/ipc/CompositorBridgeParent.cpp:1587
#10 0x0000007fbca81234 in mozilla::embedlite::EmbedLiteCompositorBridgeParent::
AllocPLayerTransactionParent (this=0x7f80ce94a0, aBackendHints=...,
aId=...)
at mobile/sailfishos/embedthread/EmbedLiteCompositorBridgeParent.cpp:77
#11 0x0000007fba05f3f0 in mozilla::layers::PCompositorBridgeParent::
OnMessageReceived (this=0x7f80ce94a0, msg__=...) at
PCompositorBridgeParent.cpp:1391
[...]
#27 0x0000007fb735989c in thread_start () at ../sysdeps/unix/sysv/linux/aarch64/
clone.S:78
(gdb) c
Continuing.
[...]
Thread 38 "Compositor" hit Breakpoint 1, DeclarativeWebContainer::
clearWindowSurface (this=0x55559bbc60) at ../core/
declarativewebcontainer.cpp:681
681 m_context->makeCurrent(this);
(gdb) bt
#0 DeclarativeWebContainer::clearWindowSurface (this=0x55559bbc60) at ../core/
declarativewebcontainer.cpp:681
#1 0x0000005555591830 in DeclarativeWebContainer::clearWindowSurfaceTask (
data=0x55559bbc60) at ../core/declarativewebcontainer.cpp:671
#2 0x0000007fbca81e10 in details::CallFunction<0ul, void (*)(void*), void*> (
arg=..., function=<optimized out>)
at ipc/chromium/src/base/task.h:52
#3 DispatchTupleToFunction<void (*)(void*), void*> (arg=...,
function=<optimized out>)
at ipc/chromium/src/base/task.h:53
#4 RunnableFunction<void (*)(void*), mozilla::Tuple<void*> >::Run (
this=<optimized out>)
at ipc/chromium/src/base/task.h:324
#5 0x0000007fb9bfe4e4 in nsThread::ProcessNextEvent (aResult=0x7edb46be77,
aMayWait=<optimized out>, this=0x7f80cc0580)
at xpcom/threads/nsThread.cpp:1211
[...]
#15 0x0000007fb735989c in thread_start () at ../sysdeps/unix/sysv/linux/aarch64/
clone.S:78
(gdb) c
Continuing.
[...]
It turns out I'm wrong about this DeclarativeWebContainer::clearWindowSurface() method. It gets called three times as the page is loading and that's it. Checking the code, it's triggered by signals that come from qtmozembed. These are, in order:
- DeclarativeWebContainer::exposeEvent().
- DeclarativeWebContainer::createGLContext() triggered by the QMozWindow::requestGLContext() signal.
- WebPageFactory::aboutToInitialize() on page creation.
Here are some of the calls and signals which potentially could result in a call to clearWindowSurface(). Not all of these are actually happening during the runs I've been testing:
DeclarativeWebContainer::exposeEvent()

connect(m_mozWindow.data(), &QMozWindow::requestGLContext, this,
    &DeclarativeWebContainer::createGLContext, Qt::DirectConnection);

connect(m_mozWindow.data(), &QMozWindow::compositorCreated, this,
    &DeclarativeWebContainer::postClearWindowSurfaceTask);

connect(m_model.data(), &DeclarativeTabModel::tabClosed, this,
    &DeclarativeWebContainer::releasePage);

DeclarativeWebContainer::clearSurface()
On ESR 91 only one of these is happening: the first one triggered by a call to exposeEvent(). So what of the others? Placing breakpoints in various places I'm able to identify that CompositorOGL::CreateContext() is called on ESR 91. This appears in the call stack of the second breakpoint hit on ESR 78, so this should in theory also be calling clearWindowSurface() on ESR 91, but it's not.What happens is that there's a break in the call stack. While the following aren't called:
#0  clearWindowSurface() at ../core/declarativewebcontainer.cpp:681
#1  createGLContext() at ../core/declarativewebcontainer.cpp:1193
#2  QMetaObject::activate() /usr/lib64/libQt5Core.so.5
#3  QMozWindowPrivate::RequestGLContext() at qmozwindow_p.cpp:133
#4  GetGLContext() mobile/sailfishos/embedshared/nsWindow.cpp:408
The following are called. These are all prior to the others in the callstack on ESR 78, which means that the break is happening in the CompositorOGL::CreateContext() method.
#5  CompositorOGL::CreateContext() gfx/layers/opengl/CompositorOGL.cpp:228
#6  CompositorOGL::Initialize() gfx/layers/opengl/CompositorOGL.cpp:374
#7  NewCompositor() gfx/layers/ipc/CompositorBridgeParent.cpp:1534
#8  InitializeLayerManager() gfx/layers/ipc/CompositorBridgeParent.cpp:1491
So tomorrow I'll need to take a look at the CompositorOGL::CreateContext() code. Based on what I've seen today, something different is likely to be happening in there compared to what was happening with the working version. By looking at the diff and seeing what's changed, it should be possible to figure out what. More on this tomorrow.
If you'd like to read any of my other gecko diary entries, they're all available on my Gecko-dev Diary page.
17 Apr 2024 : Day 219 #
Today has been a bit of a disheartening day from a Gecko perspective. So disheartening in fact that I considered pausing this blog, taking some time off and then trying to fix it in private to avoid having to admit how badly things are going right now.
But it's important to show the downs as well as the ups. Software development can be a messy business at times, things rarely go to plan and even when they do there's still often an awful lot of angst and frustration preceding the enjoyment of getting something working.
So here it is, warts and all.
Overnight I rebuilt the packages with the new patches installed. Running the WebView showed no changes in the output: still a white screen, no page rendering or coloured backgrounds. I can live with that, it's not what I wanted but it's also no worse than before.
So I decided to head off in the direction that was set last Thursday when I laid plans to check the implementation that happens between the DeclarativeWebContainer::clearWindowSurface() method and the CompositorOGL::EndFrame() method. This direction is in response to the useful discussion in last week's Sailfish Community Meeting.
First up I wanted to establish what was happening on the window side, so starting at clearWindowSurface() I added some code first to change the colour used to clear the texture from white to green.
This didn't affect the rendering, which remains white. Okay, so far so normal. That's a little unexpected, but nevertheless adds new and useful information.
I then added some code to read off the colour at the centre of the texture. This is pretty simple code and, as before, I added some debug output lines so we can find out what's going wrong. Here's what the method looks like now:
Executing this I was surprised to find that there was no new output from this. So I tried to set a breakpoint on it, but gdb claims it doesn't exist in the binary. A bit of reflection made me realise why: this is code in sailfish-browser, which forms part of the browser, not the WebView.
So for the WebView I'll need to find the similar equivalent call. Before trying to find out where the correct call lives, I thought I'd first see what happens when I run the browser instead of the WebView. Will gdb have more luck with that?
And this is where things start to go wrong. When running with the browser the method is called once. The screen turns green. But there's no other rendering. The fact the screen goes green is good. The fact there's no other rendering is bad. Very bad.
It means that over the last few weeks while I've been trying to fix the WebView render pipeline, I've been doing damage to the browser render pipeline in the process. I honestly thought they didn't interact at this level, but it turns out I was wrong.
So now I have both a broken WebView and a broken browser to fix. Grrrr.
While I was initially quite downhearted about this, on reflection it's not quite as bad as it sounds. The working browser version is still safely stored in the repository, so if necessary I can just revert back. But I've also got all of the changes on top of this easily visible using git locally on my system. So I can at least now work through the changes to see whether I can figure out what's responsible.
I'm not going to make more progress on this tonight, so I'll have to return to it tomorrow to try to understand what I've broken.
So very frustrating. But that's software development for you.
If you'd like to read any of my other gecko diary entries, they're all available on my Gecko-dev Diary page.
Comment
But it's important to show the downs as well as the ups. Software development can be a messy business at times, things rarely go to plan and even when they do there's still often an awful lot of angst and frustration preceding the enjoyment of getting something working.
So here it is, warts and all.
Overnight I rebuilt the packages with the new patches installed. Running the WebView showed no changes in the output: still a white screen, no page rendering or coloured backgrounds. I can live with that, it's not what I wanted but it's also no worse than before.
So I decided to head off in the direction that was set last Thursday when I laid plans to check the implementation that happens between the DeclarativeWebContainer::clearWindowSurface() method and the CompositorOGL::EndFrame() method. This direction is in response to the useful discussion in last week's Sailfish Community Meeting.
First up I wanted to establish what was happening on the window side, so starting at clearWindowSurface() I added some code first to change the colour used to clear the texture from white to green.
This didn't affect the rendering, which remains white. Okay, so far so normal. That's a little unexpected, but nevertheless adds new and useful information.
I then added some code to read off the colour at the centre of the texture. This is pretty simple code and, as before, I added some debug output lines so we can find out what's going wrong. Here's what the method looks like now:
void DeclarativeWebContainer::clearWindowSurface()
{
Q_ASSERT(m_context);
// The GL context should always be used from the same thread in which it
was created.
Q_ASSERT(m_context->thread() == QThread::currentThread());
m_context->makeCurrent(this);
QOpenGLFunctions_ES2* funcs =
m_context->versionFunctions<QOpenGLFunctions_ES2>();
Q_ASSERT(funcs);
funcs->glClearColor(0.0, 1.0, 0.0, 0.0);
funcs->glClear(GL_COLOR_BUFFER_BIT);
m_context->swapBuffers(this);
QSize screenSize = QGuiApplication::primaryScreen()->size();
size_t bufferSize = screenSize.width() * screenSize.height() * 4;
uint8_t* buf = static_cast<uint8_t*>(calloc(sizeof(uint8_t), bufferSize));
funcs->glReadPixels(0, 0, screenSize.width(), screenSize.height(),
GL_RGBA, GL_UNSIGNED_BYTE, buf);
int xpos = screenSize.width() / 2;
int ypos = screenSize.height() / 2;
int pos = xpos * ypos * 4;
volatile char red = buf[pos];
volatile char green = buf[pos + 1];
volatile char blue = buf[pos + 2];
volatile char alpha = buf[pos + 3];
printf("Colour: (%d, %d, %d, %d)\n", red, green, blue, alpha);
free(buf);
}
Everything after the call to swapBuffers() is newly added.Executing this I was surprised to find that there was no new output from this. So I tried to set a breakpoint on it, but gdb claims it doesn't exist in the binary. A bit of reflection made me realise why: this is code in sailfish-browser, which forms part of the browser, not the WebView.
So for the WebView I'll need to find the similar equivalent call. Before trying to find out where the correct call lives, I thought I'd first see what happens when I run the browser instead of the WebView. Will gdb have more luck with that?
And this is where things start to go wrong. When running with the browser the method is called once. The screen turns green. But there's no other rendering. The fact the screen goes green is good. The fact there's no other rendering is bad. Very bad.
It means that over the last few weeks while I've been trying to fix the WebView render pipeline, I've been doing damage to the browser render pipeline in the process. I honestly thought they didn't interact at this level, but it turns out I was wrong.
So now I have both a broken WebView and a broken browser to fix. Grrrr.
While I was initially quite downhearted about this, on reflection it's not quite as bad as it sounds. The working browser version is still safely stored in the repository, so if necessary I can just revert back. But I've also got all of the changes on top of this easily visible using git locally on my system. So I can at least now work through the changes to see whether I can figure out what's responsible.
I'm not going to make more progress on this tonight, so I'll have to return to it tomorrow to try to understand what I've broken.
So very frustrating. But that's software development for you.
If you'd like to read any of my other gecko diary entries, they're all available on my Gecko-dev Diary page.
16 Apr 2024 : Day 218 #
I've been continuing my patch audit today. It remains a bit of a lengthy and laborious process, but I have at least managed to get through them all.
Until now I've been keeping track of patches that have been applied, patches that aren't needed — either because changes have become redundant or because the code has changed so much that they're just no longer applicable — and patches that haven't yet been applied.
As I worked through today I found a new category to log: patches that haven't been applied but really should be. For example there are patches to ensure libcontentaction is used for handling URLs, or patches for managing extensions better on mobile. These are changes that won't necessarily have an immediately obvious effect on whether or not the browser runs, but will have functionality or efficiency impacts that need to be included.
The list of all such patches is longer than I was expecting:
0056, 0057, 0058, 0059, 0060, 0061, 0062, 0063, 0067, 0068, 0069, 0074, 0077, 0078, 0079, 0080, 0081, 0086.
You might well ask, if I know for sure that these should be applied, why didn't I just apply them? That's because I don't want to muddy the waters with them while I focus on fixing the offscreen render pipeline. If I applied these patches now, not only would it make debugging harder, it would also make the partitioning of code changes into clean patches harder as well. What I am sure about, however, is that none of these are affecting the render pipeline problem.
On top of these the following patches haven't been applied, but potentially should be. I say potentially because these are patches which either probably should be applied but I've not had time to properly decide yet, or where it's possible the reason for the patch was fixed upstream, but it's not entirely clear yet.
For example this includes patches for integrating with FFmpeg version 5.0 and above, patches to fix bugs or fixes for memory leaks. When I checked these they definitely hadn't yet been applied, but maybe they can safely be skipped. I should go through all of these more carefully at some point. Here's the list:
0008, 0012, 0014, 0041, 0042, 0043, 0044, 0045, 0046, 0049, 0050, 0051, 0052, 0064, 0066, 0073, 0076, 0082, 0083, 0084, 0085, 0087, 0089, 0090, 0091, 0094, 0095, 0096, 0097, 0099.
Then there are the patches that are not needed. I didn't find any more of these, so the list remains the same as yesterday with the following:
0004, 0005, 0013, 0035.
Finally the patches that have already been applied:
0001, 0002, 0003, 0006, 0007, 0009, 0010, 0011, 0015, 0016, 0017, 0018, 0019, 0020, 0021, 0022, 0023, 0024, 0025, 0026, 0027, 0028, 0029, 0030, 0031, 0032, 0033, 0034, 0036, 0037, 0038, 0039, 0040, 0047, 0048, 0053, 0054, 0055, 0065, 0070, 0071, 0072, 0075, 0088, 0092, 0093, 0099.
That's 47 patches in total; just under half. Plus the four that won't get applied at all sums to 51 patches dealt with, leaving 48 that still need dealing with; just under half.
Of those patches that have been applied, the following are the ones that hadn't been applied but looked potentially relevant to the render pipeline issue I'm tryig to fix. So I went ahead and applied all of these just in case:
0053, 0054, 0055, 0065, 0075.
My suspicion is that none of these will be important enough to fix the issue, but all contributions are helpful. The next step is to build myself some new packages, install them and see where we are.
Then, tomorrow, I can finally move on to the task that was discussed at the community meeting last Thursday. I'm going to start testing the render status at points in between DeclarativeWebContainer::clearWindowSurface() and CompositorOGL::EndFrame(). This will help narrow down where the working render turns into a broken render. That'll leave me in a much better position to focus on why.
I'm just starting the build now.
If you'd like to read any of my other gecko diary entries, they're all available on my Gecko-dev Diary page.
Comment
Until now I've been keeping track of patches that have been applied, patches that aren't needed — either because changes have become redundant or because the code has changed so much that they're just no longer applicable — and patches that haven't yet been applied.
As I worked through today I found a new category to log: patches that haven't been applied but really should be. For example there are patches to ensure libcontentaction is used for handling URLs, or patches for managing extensions better on mobile. These are changes that won't necessarily have an immediately obvious effect on whether or not the browser runs, but will have functionality or efficiency impacts that need to be included.
The list of all such patches is longer than I was expecting:
0056, 0057, 0058, 0059, 0060, 0061, 0062, 0063, 0067, 0068, 0069, 0074, 0077, 0078, 0079, 0080, 0081, 0086.
You might well ask, if I know for sure that these should be applied, why didn't I just apply them? That's because I don't want to muddy the waters with them while I focus on fixing the offscreen render pipeline. If I applied these patches now, not only would it make debugging harder, it would also make the partitioning of code changes into clean patches harder as well. What I am sure about, however, is that none of these are affecting the render pipeline problem.
On top of these the following patches haven't been applied, but potentially should be. I say potentially because these are patches which either probably should be applied but I've not had time to properly decide yet, or where it's possible the reason for the patch was fixed upstream, but it's not entirely clear yet.
For example this includes patches for integrating with FFmpeg version 5.0 and above, patches to fix bugs or fixes for memory leaks. When I checked these they definitely hadn't yet been applied, but maybe they can safely be skipped. I should go through all of these more carefully at some point. Here's the list:
0008, 0012, 0014, 0041, 0042, 0043, 0044, 0045, 0046, 0049, 0050, 0051, 0052, 0064, 0066, 0073, 0076, 0082, 0083, 0084, 0085, 0087, 0089, 0090, 0091, 0094, 0095, 0096, 0097, 0099.
Then there are the patches that are not needed. I didn't find any more of these, so the list remains the same as yesterday with the following:
0004, 0005, 0013, 0035.
Finally the patches that have already been applied:
0001, 0002, 0003, 0006, 0007, 0009, 0010, 0011, 0015, 0016, 0017, 0018, 0019, 0020, 0021, 0022, 0023, 0024, 0025, 0026, 0027, 0028, 0029, 0030, 0031, 0032, 0033, 0034, 0036, 0037, 0038, 0039, 0040, 0047, 0048, 0053, 0054, 0055, 0065, 0070, 0071, 0072, 0075, 0088, 0092, 0093, 0099.
That's 47 patches in total; just under half. Plus the four that won't get applied at all sums to 51 patches dealt with, leaving 48 that still need dealing with; just under half.
Of those patches that have been applied, the following are the ones that hadn't been applied but looked potentially relevant to the render pipeline issue I'm tryig to fix. So I went ahead and applied all of these just in case:
0053, 0054, 0055, 0065, 0075.
My suspicion is that none of these will be important enough to fix the issue, but all contributions are helpful. The next step is to build myself some new packages, install them and see where we are.
Then, tomorrow, I can finally move on to the task that was discussed at the community meeting last Thursday. I'm going to start testing the render status at points in between DeclarativeWebContainer::clearWindowSurface() and CompositorOGL::EndFrame(). This will help narrow down where the working render turns into a broken render. That'll leave me in a much better position to focus on why.
I'm just starting the build now.
If you'd like to read any of my other gecko diary entries, they're all available on my Gecko-dev Diary page.
15 Apr 2024 : Day 217 #
After re-reading patch 0053 yesterday, today I've been reintegrating the TextureImageEGL class back into the codebase. For context, patch 0053 makes a very small change to a single file, the TextureImageEGL.h file. But when I tried to check whether the patch had been applied or not I discovered the file it's supposed to apply to has been removed entirely from the ESR 91 codebase entirely.
The upstream changeset that removed the file mentions that the class doesn't add anything over and above what BasicTextureImage already offers. When I compared the two classes myself I came to pretty much the same conclusion: there really isn't much that's different between them. The key difference seems to be that TextureImageEGL allows for a wide variety of surface formats, whereas BasicTextureImage supports only RGBA format. There's also a slight difference in that TextureImageEGL seems to be more aggressive in resizing the texture.
Neither of these strike me as significant enough to prevent rendering, but you never know. So I've copied over the two relevant files — TextureImageEGL.h and TextureImageEGL.cpp — and integrated them into the build system. I also had to adjust the code in a few places in order to support the new EglDisplay class and some slight differences in the overridable parent method signatures that necessitated altering the signatures in the class.
Since then I've been trying to perform a partial rebuild of the code, trying to avoid having to do a full rebuild. Previously I would have run a full build overnight, but I've been getting increasingly confident with the way the build system works. Consequently I persuaded mach to rebuild the configuration based on the advice it offered up:
After the build I went through the usual process of transferring and installing the new library to my phone. Sadly I'm still left with a blank screen, so this wasn't enough to get the render working. That may mean these changes can safely reverted, but I'll leave them as they are for now and aim to come back to that later.
That's because it should be easier to remove redundant code once things are working than to guess exactly which changes are needed to get things to work. Or at least, that's my rationale.
This leaves me having applied another patch today (patch 0053), so that we now have the following applied:
0001, 0002, 0003, 0006, 0007, 0009, 0010, 0011, 0015, 0016, 0017, 0018, 0019, 0020, 0021, 0022, 0023, 0024, 0025, 0026, 0027, 0028, 0029, 0030, 0031, 0032, 0033, 0034, 0036, 0037. 0038, 0039, 0040, 0047, 0048, 0053
The following remain uneeded:
0004, 0005, 0013, 0035,
While the following haven't yet been applied:
0008, 0012, 0014, 0041, 0042, 0043, 0044, 0045, 0046, 0049, 0050, 0051, 0052,
Tomorrow I'll continue working through the patches. It's slow going, but this interlude with TextureImageEGL serves to highlight that there are still relevant patches still to be applied, which means it's worth checking. But I also want to reiterate that I've not forgotten the discussion from the Sailfish Community Meeting last Thursday. I still have some work to do following the advice provided there.
If you'd like to read any of my other gecko diary entries, they're all available on my Gecko-dev Diary page.
Comment
The upstream changeset that removed the file mentions that the class doesn't add anything over and above what BasicTextureImage already offers. When I compared the two classes myself I came to pretty much the same conclusion: there really isn't much that's different between them. The key difference seems to be that TextureImageEGL allows for a wide variety of surface formats, whereas BasicTextureImage supports only RGBA format. There's also a slight difference in that TextureImageEGL seems to be more aggressive in resizing the texture.
Neither of these strike me as significant enough to prevent rendering, but you never know. So I've copied over the two relevant files — TextureImageEGL.h and TextureImageEGL.cpp — and integrated them into the build system. I also had to adjust the code in a few places in order to support the new EglDisplay class and some slight differences in the overridable parent method signatures that necessitated altering the signatures in the class.
Since then I've been trying to perform a partial rebuild of the code, trying to avoid having to do a full rebuild. Previously I would have run a full build overnight, but I've been getting increasingly confident with the way the build system works. Consequently I persuaded mach to rebuild the configuration based on the advice it offered up:
$ sfdk engine exec
$ sb2 -t SailfishOS-esr78-aarch64.default
$ source `pwd`/obj-build-mer-qt-xr/rpm-shared.env
$ make -j1 -C obj-build-mer-qt-xr/gfx/gl/
make: Entering directory '${PROJECT}/obj-build-mer-qt-xr/gfx/gl'
${PROJECT}/gecko-dev/config/rules.mk:338: *** Build configuration changed.
    Build with |mach build| or run |mach build-backend| to regenerate build
    config.  Stop.
make: Leaving directory '${PROJECT}/obj-build-mer-qt-xr/gfx/gl'
Following that advice seems to give good results:
$ ./gecko-dev/mach build-backend
 0:05.01 ${PROJECT}/obj-build-mer-qt-xr/_virtualenvs/common/bin/python
    ${PROJECT}/obj-build-mer-qt-xr/config.status
Reticulating splines...
 0:05.22 File already read. Skipping: ${PROJECT}/gecko-dev/intl/components/
    moz.build
 0:08.32 File already read. Skipping: ${PROJECT}/gecko-dev/gfx/angle/targets/
    angle_common/moz.build
Finished reading 984 moz.build files in 19.20s
Read 11 gyp files in parallel contributing 0.00s to total wall time
Processed into 5326 build config descriptors in 17.35s
RecursiveMake backend executed in 28.37s
  1959 total backend files; 0 created; 2 updated; 1957 unchanged; 0 deleted; 21
    -> 664 Makefile
FasterMake backend executed in 2.77s
  8 total backend files; 0 created; 1 updated; 7 unchanged; 0 deleted
Total wall time: 69.45s; CPU time: 68.55s; Efficiency: 99%; Untracked: 1.75s
Glean could not be found, so telemetry will not be reported. You may need to
    run |mach bootstrap|.
I can then follow my usual partial build commands in order to get a newly built version of the library out.After the build I went through the usual process of transferring and installing the new library to my phone. Sadly I'm still left with a blank screen, so this wasn't enough to get the render working. That may mean these changes can safely reverted, but I'll leave them as they are for now and aim to come back to that later.
That's because it should be easier to remove redundant code once things are working than to guess exactly which changes are needed to get things to work. Or at least, that's my rationale.
This leaves me having applied another patch today (patch 0053), so that we now have the following applied:
0001, 0002, 0003, 0006, 0007, 0009, 0010, 0011, 0015, 0016, 0017, 0018, 0019, 0020, 0021, 0022, 0023, 0024, 0025, 0026, 0027, 0028, 0029, 0030, 0031, 0032, 0033, 0034, 0036, 0037. 0038, 0039, 0040, 0047, 0048, 0053
The following remain uneeded:
0004, 0005, 0013, 0035,
While the following haven't yet been applied:
0008, 0012, 0014, 0041, 0042, 0043, 0044, 0045, 0046, 0049, 0050, 0051, 0052,
Tomorrow I'll continue working through the patches. It's slow going, but this interlude with TextureImageEGL serves to highlight that there are still relevant patches still to be applied, which means it's worth checking. But I also want to reiterate that I've not forgotten the discussion from the Sailfish Community Meeting last Thursday. I still have some work to do following the advice provided there.
If you'd like to read any of my other gecko diary entries, they're all available on my Gecko-dev Diary page.
14 Apr 2024 : Day 216 #
After a motivational day getting really useful feedback from Raine, Damien and others, I'm back to going through patches today. I will of course need to act on the helpful suggestions, which I#m sure will be key to getting the rendering to work, but having started on my journey of checking patches I need to now finish it. This entire activity is an in-order execution pipeline you see.
I had reached patch 0038, otherwise named "Fix mesa egl display and buffer initialisation" and originally written by Adam Pigg, Frajo and myself back in 2021. It's a big one and also a relevant one to the current problem, so I'm going to spend a bit of time working my way through it.
The good news is that the process of checking, while a little laborious, doesn't require a lot of concentration. So it's good work to do while I'm still half asleep on my morning commute.
[...]
Having worked through patch 0038 it all looks present and correct, at least to the extent that makes sense with the way the new code is structured. I still have 61 patches to check through so I'm going to continue on with them.
So far the following are all applied, present and correct:
0001, 0002, 0003, 0006, 0007, 0009, 0010, 0011, 0015, 0016, 0017, 0018, 0019, 0020, 0021, 0022, 0023, 0024, 0025, 0026, 0027, 0028, 0029, 0030, 0031, 0032, 0033, 0034, 0036, 0037. 0038, 0039, 0040, 0047, 0048,
The following are no longer needed:
0004, 0005, 0013, 0035,
While the following haven't been applied, but might potentially be important for the browser overall, so may need to be applied at some point in the future:
0008, 0012, 0014, 0041, 0042, 0043, 0044, 0045, 0046, 0049, 0050, 0051, 0052,
I got up to patch 0051 and then I hit something unexpected. Patch 0051 makes "TextureImageEGL hold a reference to GLContext". There's a detailed explanation in the patch about why this is needed: it ensures that freed memory isn't used during the shutdown of EmbedLite port objects. The actual change required is minimal:
Well that's odd.
It would appear that the TextureImageEGL class has been completely removed. And because it's created in a factory it's apparently not affected any of the other EmbedLite changes. Here's the creation code from ESR 78:
The upstream diff suggests that TextureImageEGL provides no value, but it would be easy to miss the value if it applied only to a project that's external to gecko and which isn't officially supported. So I wonder if it's potentially offering value to us?
Unfortunately I've run out of time today to investigate this further today. I'd especially like to compare the functionality of TextureImageEGL from ESR 78 with that of BasicTextureImage in ESR 91. That will be my task for tomorrow morning.
If you'd like to read any of my other gecko diary entries, they're all available on my Gecko-dev Diary page.
Comment
I had reached patch 0038, otherwise named "Fix mesa egl display and buffer initialisation" and originally written by Adam Pigg, Frajo and myself back in 2021. It's a big one and also a relevant one to the current problem, so I'm going to spend a bit of time working my way through it.
The good news is that the process of checking, while a little laborious, doesn't require a lot of concentration. So it's good work to do while I'm still half asleep on my morning commute.
[...]
Having worked through patch 0038 it all looks present and correct, at least to the extent that makes sense with the way the new code is structured. I still have 61 patches to check through so I'm going to continue on with them.
So far the following are all applied, present and correct:
0001, 0002, 0003, 0006, 0007, 0009, 0010, 0011, 0015, 0016, 0017, 0018, 0019, 0020, 0021, 0022, 0023, 0024, 0025, 0026, 0027, 0028, 0029, 0030, 0031, 0032, 0033, 0034, 0036, 0037. 0038, 0039, 0040, 0047, 0048,
The following are no longer needed:
0004, 0005, 0013, 0035,
While the following haven't been applied, but might potentially be important for the browser overall, so may need to be applied at some point in the future:
0008, 0012, 0014, 0041, 0042, 0043, 0044, 0045, 0046, 0049, 0050, 0051, 0052,
I got up to patch 0051 and then I hit something unexpected. Patch 0051 makes "TextureImageEGL hold a reference to GLContext". There's a detailed explanation in the patch about why this is needed: it ensures that freed memory isn't used during the shutdown of EmbedLite port objects. The actual change required is minimal:
  protected:
   typedef gfxImageFormat ImageFormat;

-  GLContext* mGLContext;
+  RefPtr<GLContext> mGLContext;

   gfx::SurfaceFormat mUpdateFormat;
   EGLImage mEGLImage;
Changes don't come much simpler than this. But when I tried to check whether it had been applied I ran in to problems: the TextureImageEGL.h file which it's intended to apply to doesn't exist.
Well that's odd.
It would appear that the TextureImageEGL class has been completely removed. And because it's created in a factory it's apparently not affected any of the other EmbedLite changes. Here's the creation code from ESR 78:
already_AddRefed<TextureImage> CreateTextureImage(
GLContext* gl, const gfx::IntSize& aSize,
TextureImage::ContentType aContentType, GLenum aWrapMode,
TextureImage::Flags aFlags, TextureImage::ImageFormat aImageFormat) {
switch (gl->GetContextType()) {
case GLContextType::EGL:
return CreateTextureImageEGL(gl, aSize, aContentType, aWrapMode, aFlags,
aImageFormat);
default: {
GLint maxTextureSize;
gl->fGetIntegerv(LOCAL_GL_MAX_TEXTURE_SIZE, &maxTextureSize);
if (aSize.width > maxTextureSize || aSize.height > maxTextureSize) {
NS_ASSERTION(aWrapMode == LOCAL_GL_CLAMP_TO_EDGE,
"Can't support wrapping with tiles!");
return CreateTiledTextureImage(gl, aSize, aContentType, aFlags,
aImageFormat);
} else {
return CreateBasicTextureImage(gl, aSize, aContentType, aWrapMode,
aFlags);
}
}
}
}
Notice how in ESR 91 the code for generating TextureImageEGL objects has been completely removed:
already_AddRefed<TextureImage> CreateTextureImage(
GLContext* gl, const gfx::IntSize& aSize,
TextureImage::ContentType aContentType, GLenum aWrapMode,
TextureImage::Flags aFlags, TextureImage::ImageFormat aImageFormat) {
GLint maxTextureSize;
gl->fGetIntegerv(LOCAL_GL_MAX_TEXTURE_SIZE, &maxTextureSize);
if (aSize.width > maxTextureSize || aSize.height > maxTextureSize) {
NS_ASSERTION(aWrapMode == LOCAL_GL_CLAMP_TO_EDGE,
"Can't support wrapping with tiles!");
return CreateTiledTextureImage(gl, aSize, aContentType, aFlags,
aImageFormat);
} else {
return CreateBasicTextureImage(gl, aSize, aContentType, aWrapMode, aFlags);
}
}
Let's find out why that is.
$ git log -1 -S "CreateTextureImageEGL" -- gfx/gl/GLTextureImage.cpp
commit a7817816b708c8b1fc3362d21cbcadbff3c46741
Author: Jeff Muizelaar <jmuizelaar@mozilla.com>
Date:   Tue Jun 15 21:10:47 2021 +0000

    Bug 1716559 - Remove TextureImageEGL. r=jnicol,jgilbert

    TextureImageEGL doesn't seem to provide any value beyond
    BasicTextureImage. It's last usage was bug 814159.

    Removing this has the side effect of using BasicTextureImage
    for small images instead of always using TilingTextureImage.

    Differential Revision: https://phabricator.services.mozilla.com/D117904
It surprises me that I've not run in to this before, but one of the benefits of keeping this diary is that I can very quickly verify this:... I have not.The upstream diff suggests that TextureImageEGL provides no value, but it would be easy to miss the value if it applied only to a project that's external to gecko and which isn't officially supported. So I wonder if it's potentially offering value to us?
Unfortunately I've run out of time today to investigate this further today. I'd especially like to compare the functionality of TextureImageEGL from ESR 78 with that of BasicTextureImage in ESR 91. That will be my task for tomorrow morning.
If you'd like to read any of my other gecko diary entries, they're all available on my Gecko-dev Diary page.
13 Apr 2024 : Day 215 #
This morning I had a really fruitful discussion with everyone attending the fortnightly Sailfish Community Meeting. As you'll know I've reached the point where it's clear that rendering is happening to the surface, but there's something not working between the surface and the screen that's preventing any colour getting to the screen.
There were two really excellent outcomes from the meeting. The first involved potential solutions to this problem and I'd like to spend a little time discussing that now. The second... well I'll come to that later.
So let's first look at those potential solutions. The first thing was that there's a process that happens between the sailfish-browser code and the gecko code that performs the WebView rendering. It takes the offscreen render and ensures it gets to the screen. And as Raine (rainemak) explained during the meeting, that starts in the DeclarativeWebContainer::clearWindowSurface() method. That's part of the sailfish-browser code.
Recently I've been playing around with the CompositorOGL::EndFrame() method. That's at the other end of the process. So that means the part of the code I need to check should be somewhere between these two points. Here's some of the relevant conversation (slightly amended by me for brevity and clarify):
So that's some clear things to check, specifically the code around clearWindowSurface() and the calling of glMakeCurrent() (which is most likely called fMakeCurrent() if it's in the gecko code). So this is the reason for the first part of my upcoming plan:
But there was more useful info from Raine in addition to this. He also suggested to take a look at the DrawUnderlay() method — if it exists — or the functionality that's replaced it.
Finally, he also suggested to check the updatePaintNode() method which is part of the qtmozembed codebase:
All of these are excellent suggestions and they're now on my list of things to check. Yesterday I'd started working through the patches and I'll have to finish that task before I move on to these suggestions, since the patches have ramifications for other parts of the code as well, but I'm really hoping — and quite energised by the prospect — that these tips from Raine might lead to a solution for the offscreen rendering problems.
It was also great to see that the discussion during the meeting also led to some helpful OpenGL debugging suggestions on the forum. I've already thanked Tone (tortoisedoc) previously but now I must also add Damien Caliste (dcaliste) to the list of people who deserve my thanks.
So that was the first nice outcome, what about the second? Well that's of a slightly different nature. During the meeting thigg also made an unexpected by also really superb offer:
I can't get enough of Thilo's pictures and am already looking forward to being able to share them in these diaries when the time comes.
That's it for today, but I'll return tomorrow with updates on patches.
If you'd like to read any of my other gecko diary entries, they're all available on my Gecko-dev Diary page.
Comment
There were two really excellent outcomes from the meeting. The first involved potential solutions to this problem and I'd like to spend a little time discussing that now. The second... well I'll come to that later.
So let's first look at those potential solutions. The first thing was that there's a process that happens between the sailfish-browser code and the gecko code that performs the WebView rendering. It takes the offscreen render and ensures it gets to the screen. And as Raine (rainemak) explained during the meeting, that starts in the DeclarativeWebContainer::clearWindowSurface() method. That's part of the sailfish-browser code.
Recently I've been playing around with the CompositorOGL::EndFrame() method. That's at the other end of the process. So that means the part of the code I need to check should be somewhere between these two points. Here's some of the relevant conversation (slightly amended by me for brevity and clarify):
rainemak: flypig, have you tried to change gl clear color?
flypig: Yes, I tried glClearColor. The change shows up with fReadPixels, but not on screen.
rainemak: has to be that off screen is not there
flypig: Could you elaborate?
rainemak: flypig, one thing worth looking is that gecko doesn't create any headless things in addition to what you're expecting it to create
flypig: rainemak, how would that manifest itself? I've been careful to ensure there's only one display value
created. Is there anything else to check for this you can think of?
rainemak: flypig, also gl makeCurrent and swap I'd check
rainemak: DeclarativeWebContainer::clearWindowSurface
rainemak: ^ is that being called properly
flypig: That's in sailfish-browser rainemak? I've not checked that; I'll do so.
So that's some clear things to check, specifically the code around clearWindowSurface() and the calling of glMakeCurrent() (which is most likely called fMakeCurrent() if it's in the gecko code). So this is the reason for the first part of my upcoming plan:
flypig: Alright, I'm going to check on the clearWindowSurface side of things and everything between that and CompositorOGL::EndFrame().
rainemak: flypig, that's at least scheduling glclear
flypig: Okay, that's useful to know. Then maybe I can put lots of readPixels in between the two to find out exactly which step is failing.
rainemak: flypig, that's at least scheduling glclear
flypig: Okay, that's useful to know. Then maybe I can put lots of readPixels in between the two to find out exactly which step is failing.
But there was more useful info from Raine in addition to this. He also suggested to take a look at the DrawUnderlay() method — if it exists — or the functionality that's replaced it.
rainemak: flypig, and draw underlay is getting called properly as well? that call makeCurrent
rainemak: that calls makeCurrent
flypig: One second, let me check.
rainemak: let me think
flypig: That's called in EmbedLiteCompositorBridgeParent::CompositeToDefaultTarget() ?
rainemak: it starts around there
rainemak: did we remove on esr78 DrawUnderlay like methon ( there's still QMozWindowPrivate::DrawOverlay )
rainemak: hmm
rainemak: I'm not seeing that makeCurrent
Finally, he also suggested to check the updatePaintNode() method which is part of the qtmozembed codebase:
rainemak: flypig, QuickMozView::updatePaintNode I'd check this one as browser rendering works
rainemak: i.e. does getPlatform and MozMaterialNode::preprocess work as expected
rainemak: thinking if there's something wrong now with previous scenegraph integration
rainemak: i.e. does getPlatform and MozMaterialNode::preprocess work as expected
rainemak: thinking if there's something wrong now with previous scenegraph integration
All of these are excellent suggestions and they're now on my list of things to check. Yesterday I'd started working through the patches and I'll have to finish that task before I move on to these suggestions, since the patches have ramifications for other parts of the code as well, but I'm really hoping — and quite energised by the prospect — that these tips from Raine might lead to a solution for the offscreen rendering problems.
It was also great to see that the discussion during the meeting also led to some helpful OpenGL debugging suggestions on the forum. I've already thanked Tone (tortoisedoc) previously but now I must also add Damien Caliste (dcaliste) to the list of people who deserve my thanks.
So that was the first nice outcome, what about the second? Well that's of a slightly different nature. During the meeting thigg also made an unexpected by also really superb offer:
thilo[m]: #info thigg, community
thilo[m]: Flypig: you have a milestone in gecko after which you have a big party planned? ;)
flypig: thilo[m], once the offscreen render is working, I'll generate patches, and then it will be time to celebrate (for me at least!).
thilo[m]: Cool, i'll prepare pictures ;)
thilo[m]: Flypig: you have a milestone in gecko after which you have a big party planned? ;)
flypig: thilo[m], once the offscreen render is working, I'll generate patches, and then it will be time to celebrate (for me at least!).
thilo[m]: Cool, i'll prepare pictures ;)
I can't get enough of Thilo's pictures and am already looking forward to being able to share them in these diaries when the time comes.
That's it for today, but I'll return tomorrow with updates on patches.
If you'd like to read any of my other gecko diary entries, they're all available on my Gecko-dev Diary page.
12 Apr 2024 : Day 214 #
Yesterday was a minor breakthrough day. I'd normally start off by explaining why, but I can't do a better job than how Leif-Jöran Olsson (ljo) described things on Mastodon last night:
So very evocative! And when you're left peering at the rendering through the prism of a single pixel, it does rather feel like the dark ages.
The reality of this summary is that there's still no rendering to the screen. As it also captures however, I was able to confirm that rendering is happening to the backbuffer surface. That gives me hope, as well as a much better idea about where to focus my efforts, which is in the gap between the backbuffer and the screen.
Unfortunately this is part of the mechanism that I know least about, involving a mysterious combination of Qt, Wayland, OpenGL ES and with only the tip of the technology iceberg protruding into gecko code.
Before heading back to this it strikes me it might be worth me double checking the patches. Raine already suggested some I should look at and I'm concerned I may have missed something else that might be important.
So I'm going to review all 99 patches to check what has and hasn't been applied, just in case I've missed something crucial.
The process is rather laborious: I open the patch in my editor, open the files that have changed and check whether the diffs have been applied. In many cases things have moved around and it takes a bit more than just checking the lines listed in the patch. Instead I'm having to search for prominent bits of code to check whether they exist somewhere in the code base.
It's not hard, but there's also not much to write about: open, check, check, check, note down result, close. Open, check, check, check, note down result, close. Rinse and repeat.
What I've discovered so far today is that the following patches have all been applied and look correct:
0001, 0002, 0003, 0006, 0007, 0009, 0010, 0011, 0015, 0016, 0017, 0018, 0019, 0020, 0021, 0022, 0023, 0024, 0025, 0026, 0027, 0028, 0029, 0030, 0031, 0032, 0033, 0034, 0036, 0037.
The following patches aren't applicable because the code has either changed so much as to make them impossible to apply or irrelevant:
0004, 0005, 0013, 0035.
And finally the following haven't been applied, but might yet need to be:
0008, 0012, 0014.
That means I still have 0038 to 0099 to check. As yet I've not noticed anything missing or misapplied that looks like it might be affecting the offscreen render pipeline. Having said that, as the day comes to an end I can see the next patch — patch 0038 — is very definitely applicable. I'll need to look through it very carefully indeed. But that's for tomorrow when I'm feeling more awake.
Also tomorrow I'll be discussing the outcome of the Sailfish Community Meeting, which turned out to be unexpectedly useful for the tasks I'm working on. More on that tomorrow!
If you'd like to read any of my other gecko diary entries, they're all available on my Gecko-dev Diary page.
Comment
The dark ages losing its grip on the rendering origin. While the reminiscences of violet sky still casts its reflection into the void, a Big bang awaits to radiate the 10^122 black matter surfaces onto the infinite screen of the gecko multi-verse
So very evocative! And when you're left peering at the rendering through the prism of a single pixel, it does rather feel like the dark ages.
The reality of this summary is that there's still no rendering to the screen. As it also captures however, I was able to confirm that rendering is happening to the backbuffer surface. That gives me hope, as well as a much better idea about where to focus my efforts, which is in the gap between the backbuffer and the screen.
Unfortunately this is part of the mechanism that I know least about, involving a mysterious combination of Qt, Wayland, OpenGL ES and with only the tip of the technology iceberg protruding into gecko code.
Before heading back to this it strikes me it might be worth me double checking the patches. Raine already suggested some I should look at and I'm concerned I may have missed something else that might be important.
So I'm going to review all 99 patches to check what has and hasn't been applied, just in case I've missed something crucial.
The process is rather laborious: I open the patch in my editor, open the files that have changed and check whether the diffs have been applied. In many cases things have moved around and it takes a bit more than just checking the lines listed in the patch. Instead I'm having to search for prominent bits of code to check whether they exist somewhere in the code base.
It's not hard, but there's also not much to write about: open, check, check, check, note down result, close. Open, check, check, check, note down result, close. Rinse and repeat.
What I've discovered so far today is that the following patches have all been applied and look correct:
0001, 0002, 0003, 0006, 0007, 0009, 0010, 0011, 0015, 0016, 0017, 0018, 0019, 0020, 0021, 0022, 0023, 0024, 0025, 0026, 0027, 0028, 0029, 0030, 0031, 0032, 0033, 0034, 0036, 0037.
The following patches aren't applicable because the code has either changed so much as to make them impossible to apply or irrelevant:
0004, 0005, 0013, 0035.
And finally the following haven't been applied, but might yet need to be:
0008, 0012, 0014.
That means I still have 0038 to 0099 to check. As yet I've not noticed anything missing or misapplied that looks like it might be affecting the offscreen render pipeline. Having said that, as the day comes to an end I can see the next patch — patch 0038 — is very definitely applicable. I'll need to look through it very carefully indeed. But that's for tomorrow when I'm feeling more awake.
Also tomorrow I'll be discussing the outcome of the Sailfish Community Meeting, which turned out to be unexpectedly useful for the tasks I'm working on. More on that tomorrow!
If you'd like to read any of my other gecko diary entries, they're all available on my Gecko-dev Diary page.
11 Apr 2024 : Day 213 #
The build ran overnight and finally this morning it was complete. Now time to test it. As a quick recap, what I'm looking for when it runs is either a cyan screen or a white screen. Yesterday I made a change to the ESR 78 code to insert a "clear surface to a cyan colour" call right before the surface is swapped onto the screen. Here are the two new commands I added:
On ESR 78 this resulted in the screen turning cyan, which is what I was expecting and hoping for. If the same thing happens on ESR 91 then it means the display of the surface to the screen is working correctly. If, on the other hand, the screen remains white, it means that either the call to clear the screen is failing, or the surface isn't being rendered to the screen at all.
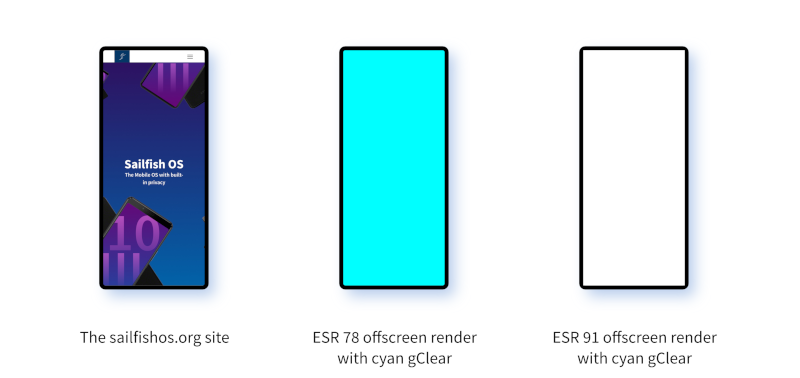
The screen remains white.
So we're in the latter category. Either the methods I'm calling to clear the screen are dud, or the background surface simply isn't being rendered to screen.
This is useful progress in my opinion.
So where to take it next? I want to separate the two possibilities: is the problem the call to clear the screen, or is the surface not being rendered. My suspicion is that it's the latter, but I'm done with suspicions when it comes to the offscreen rendering pipeline. I'm in need of a bit of certainty.
So my plan is to try to probe the texture to check its colour. And here's the code I'm going to use to do it.
This is inelegant and inefficient code and sharing it is unedifying. But if it gets the job done I don't care. So now I'm building it in the ESR 78 build environment to test it with the ESR 78 rendering pipeline.
As a quick second test I've rebuilt the code without the cyan screen clearing part. Now when I run the app with the sailfishos.org website showing on the screen we get the following output.
Once again, this is good news. It's what I'd hope to see in a working system. Next up it's time to try the same code on ESR 91. This is crunch time because it should tell us whether the render surface is being rendered to or not.
With the code build and deployed, here's the output with the clear-screen cyan code in place:
Here's the output from this.
If you'd like to read any of my other gecko diary entries, they're all available on my Gecko-dev Diary page.
Comment
  mGLContext->fClearColor(0.0, 1.0, 1.0, 0.0);
  mGLContext->fClear(LOCAL_GL_COLOR_BUFFER_BIT | LOCAL_GL_DEPTH_BUFFER_BIT);
These were added to the top of the CompositorOGL::EndFrame() method, which is the last thing to happen before the surfaces are swapped. Actually that's not quite right: EndFrame() is actually the method that performs the swap. So these clear calls are now pretty much the last thing that happens before the swap.
On ESR 78 this resulted in the screen turning cyan, which is what I was expecting and hoping for. If the same thing happens on ESR 91 then it means the display of the surface to the screen is working correctly. If, on the other hand, the screen remains white, it means that either the call to clear the screen is failing, or the surface isn't being rendered to the screen at all.
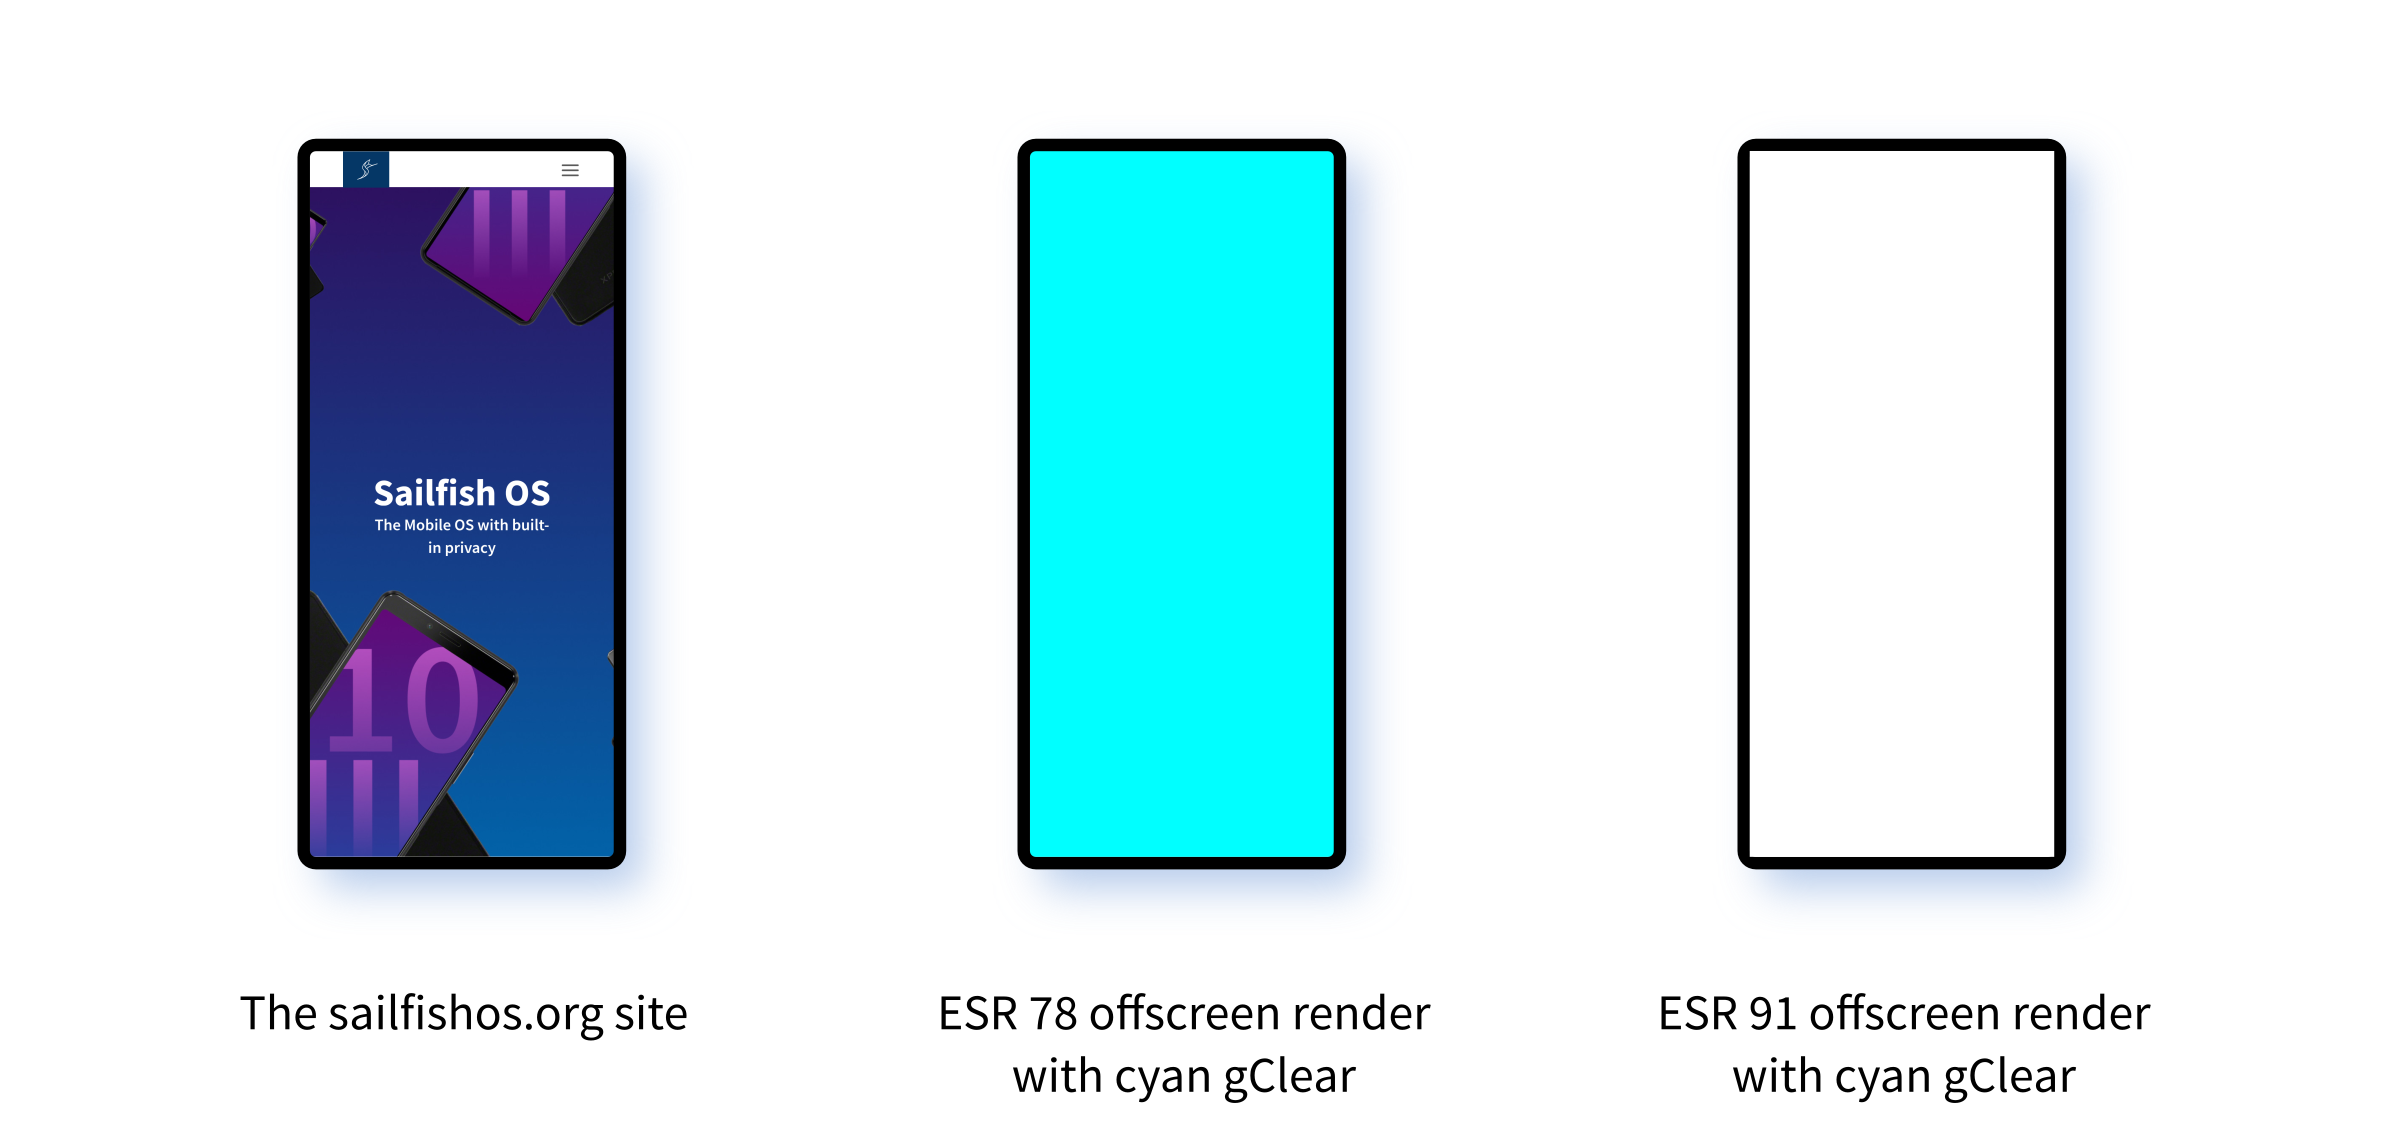
The screen remains white.
So we're in the latter category. Either the methods I'm calling to clear the screen are dud, or the background surface simply isn't being rendered to screen.
This is useful progress in my opinion.
So where to take it next? I want to separate the two possibilities: is the problem the call to clear the screen, or is the surface not being rendered. My suspicion is that it's the latter, but I'm done with suspicions when it comes to the offscreen rendering pipeline. I'm in need of a bit of certainty.
So my plan is to try to probe the texture to check its colour. And here's the code I'm going to use to do it.
void CompositorOGL::EndFrame() {
AUTO_PROFILER_LABEL("CompositorOGL::EndFrame", GRAPHICS);
mGLContext->fClearColor(0.0, 1.0, 1.0, 0.0);
mGLContext->fClear(LOCAL_GL_COLOR_BUFFER_BIT | LOCAL_GL_DEPTH_BUFFER_BIT);
size_t bufferSize = mWidgetSize.width * mWidgetSize.height * 4;
auto buf = MakeUnique<uint8_t[]>(bufferSize);
mGLContext->fReadPixels(0, 0, mWidgetSize.width, mWidgetSize.height,
LOCAL_GL_RGBA, LOCAL_GL_UNSIGNED_BYTE, buf.get());
int xpos = mWidgetSize.width / 2;
int ypos = mWidgetSize.height / 2;
int pos = xpos * ypos * 4;
char red = buf.get()[pos];
char green = buf.get()[pos + 1];
char blue = buf.get()[pos + 2];
char alpha = buf.get()[pos + 3];
printf_stderr("Colour: (%d, %d, %d, %d)\n", red, green, blue,
alpha);
[...]
This is not beautiful code. After clearing the screen it creates a buffer large enough to contain all of the data held in the texture. The fReadPixels() call is then used to transfer the pixel data from the graphics memory to this buffer. We then measure up the centre of the buffer and pluck out the colour from the buffer at that point.This is inelegant and inefficient code and sharing it is unedifying. But if it gets the job done I don't care. So now I'm building it in the ESR 78 build environment to test it with the ESR 78 rendering pipeline.
$ sfdk engine exec
$ sb2 -t SailfishOS-esr78-aarch64.default
$ mv .git .git-disabled
$ source `pwd`/obj-build-mer-qt-xr/rpm-shared.env
$ make -j1 -C obj-build-mer-qt-xr/gfx/layers
$ make -j16 -C `pwd`/obj-build-mer-qt-xr/toolkit
$ strip obj-build-mer-qt-xr/toolkit/library/build/libxul.so
And on running it, with the full-screen cyan showing, it gives the following output:
$ harbour-webview
[...]
Created LOG for EmbedLiteLayerManager
=============== Preparing offscreen rendering context ===============
Colour: (0, 255, 255, 255)
Colour: (0, 255, 255, 255)
Colour: (0, 255, 255, 255)
Colour: (0, 255, 255, 255)
Colour: (0, 255, 255, 255)
Colour: (0, 255, 255, 255)
Colour: (0, 255, 255, 255)
Colour: (0, 255, 255, 255)
Colour: (0, 255, 255, 255)
Colour: (0, 255, 255, 255)
[...]
The colour is red, green, blue alpha. So this indicates no red, full green, full blue and full opaque. Which is cyan. That's a good result: it shows us the code is working.
As a quick second test I've rebuilt the code without the cyan screen clearing part. Now when I run the app with the sailfishos.org website showing on the screen we get the following output.
$ harbour-webview
[...]
Created LOG for EmbedLiteLayerManager
=============== Preparing offscreen rendering context ===============
Colour: (255, 255, 255, 255)
Colour: (255, 255, 255, 255)
Colour: (255, 255, 255, 255)
Colour: (255, 255, 255, 255)
Colour: (255, 255, 255, 255)
Colour: (255, 255, 255, 255)
Colour: (255, 255, 255, 255)
Colour: (255, 255, 255, 255)
Colour: (253, 253, 254, 255)
Colour: (237, 237, 243, 255)
Colour: (234, 234, 242, 255)
Colour: (222, 222, 233, 255)
Colour: (214, 213, 228, 255)
Colour: (199, 198, 218, 255)
Colour: (183, 182, 207, 255)
Colour: (164, 163, 195, 255)
Colour: (152, 151, 187, 255)
Colour: (127, 125, 170, 255)
Colour: (109, 107, 158, 255)
Colour: (98, 96, 151, 255)
Colour: (82, 80, 141, 255)
Colour: (69, 66, 132, 255)
Colour: (61, 58, 127, 255)
Colour: (52, 49, 120, 255)
Colour: (46, 44, 117, 255)
Colour: (42, 39, 114, 255)
Colour: (38, 35, 111, 255)
Colour: (36, 33, 110, 255)
Colour: (36, 33, 110, 255)
Colour: (36, 33, 110, 255)
That's an initially white screen that changes colour as the rendering progresses. Ultimately we get the end result which is a dark blue-purple colour. That's the colour which also happens to be prominent on the main sailfishos.org front page.
Once again, this is good news. It's what I'd hope to see in a working system. Next up it's time to try the same code on ESR 91. This is crunch time because it should tell us whether the render surface is being rendered to or not.
With the code build and deployed, here's the output with the clear-screen cyan code in place:
$ harbour-webview
[...]
Created LOG for EmbedLiteLayerManager
=============== Preparing offscreen rendering context ===============
[...]
Colour: (0, 255, 255, 255)
Colour: (0, 255, 255, 255)
Colour: (0, 255, 255, 255)
Colour: (0, 255, 255, 255)
Colour: (0, 255, 255, 255)
Colour: (0, 255, 255, 255)
Colour: (0, 255, 255, 255)
Colour: (0, 255, 255, 255)
Colour: (0, 255, 255, 255)
Colour: (0, 255, 255, 255)
Colour: (0, 255, 255, 255)
Colour: (0, 255, 255, 255)
[...]
This is interesting. This shows quite clearly that the cyan colour is making its way onto the render surface. That's actually quite exciting. It means that the most complex part of the process appears to be working as expected. The problem is that the surface isn't making it all the way to the screen. Just to be sure I'm also going to build a version without the cyan screen clearing. This will tell us whether the page is rendering onto the surface.
Here's the output from this.
$ harbour-webview
[...]
Created LOG for EmbedLiteLayerManager
=============== Preparing offscreen rendering context ===============
[...]
Colour: (255, 255, 255, 255)
Colour: (255, 255, 255, 255)
Colour: (255, 255, 255, 255)
Colour: (255, 255, 255, 255)
Colour: (255, 255, 255, 255)
Colour: (255, 255, 255, 255)
Colour: (255, 255, 255, 255)
Colour: (255, 255, 255, 255)
Colour: (254, 254, 254, 255)
Colour: (245, 245, 248, 255)
Colour: (242, 242, 246, 255)
Colour: (240, 239, 245, 255)
Colour: (234, 233, 241, 255)
Colour: (229, 229, 238, 255)
Colour: (226, 225, 236, 255)
Colour: (221, 221, 233, 255)
Colour: (217, 217, 230, 255)
Colour: (208, 207, 224, 255)
Colour: (204, 203, 221, 255)
Colour: (192, 191, 213, 255)
Colour: (187, 186, 210, 255)
Colour: (181, 180, 206, 255)
Colour: (175, 174, 202, 255)
Colour: (169, 168, 198, 255)
Colour: (157, 156, 190, 255)
Colour: (150, 149, 186, 255)
Colour: (144, 143, 182, 255)
Colour: (138, 137, 178, 255)
Colour: (125, 124, 169, 255)
Colour: (119, 117, 165, 255)
Colour: (113, 111, 161, 255)
Colour: (107, 105, 157, 255)
Colour: (101, 99, 153, 255)
Colour: (96, 94, 150, 255)
Colour: (91, 89, 146, 255)
Colour: (86, 84, 143, 255)
Colour: (81, 78, 140, 255)
Colour: (71, 69, 133, 255)
Colour: (68, 65, 131, 255)
Colour: (63, 61, 128, 255)
Colour: (60, 57, 126, 255)
Colour: (57, 54, 124, 255)
Colour: (53, 50, 121, 255)
Colour: (51, 48, 120, 255)
Colour: (48, 45, 118, 255)
Colour: (45, 43, 116, 255)
Colour: (44, 41, 115, 255)
Colour: (41, 38, 113, 255)
Colour: (40, 37, 113, 255)
Colour: (39, 36, 112, 255)
Colour: (38, 35, 111, 255)
Colour: (37, 34, 110, 255)
Colour: (36, 33, 110, 255)
[...]
So there we have it. The site is rendering just fine onto the background surface. The problem is that the surface isn't making it on to the screen. This leaves us plenty more questions to answer and things to think about for tomorrow, but that's enough for today.
If you'd like to read any of my other gecko diary entries, they're all available on my Gecko-dev Diary page.
10 Apr 2024 : 212 #
I'm changing tack today. After spending weeks reviewing the offscreen render initialisation code, I'm now turning my attention to the ESR 78 code. That may sounds a bit weird, but bear with me.
In order to check whether changes to the build ought to be resulting in particular consequences in the running software, I'm wanting to make some changes to the ESR 78 code to see what happens there. You could say it's an experimental approach to debugging the ESR 91 code. But to do this I need to build ESR 78.
The change I want to make is simple. Over recent days we were looking at the CompositorOGL::EndFrame() code. This is called at the end of the render process in order to swap the back buffer with the front buffer and allow the latest updates to be shown onscreen. Before this swap happens I've added two lines of code, right at the top of the method:
So I'll need to set off a build of the ESR 78 code with these minor changes. Apart from the build being a lengthy process, it'll also involve configuring the build environment correctly. The sfdk build tool has some nice features for separating out different build environments and configurations using snapshots and sessions. I'm going to use both. It's quite important to get all this right though. Otherwise there's a risk I'll clobber my ESR 91 build configuration which will mean, quite apart from having to reconfigure things back, I may also have to do a full rebuild of all the many packages that have been touched by the ESR 91 changes.
For context, here's the build configuration I'm using for ESR 91. The important things to note are the output-prefix which is where the final packages end up and the target which combines both the choice of processor and the list of packages that are installed in the environment where the build takes place.
For reference, here are the targets that I have installed in my SDK:
So that's my current setup for ESR 91. For ESR 78 we want to tweak this a little. Like the SailfishOS-devel-aarch64 target we want to use a snapshot of the SailfishOS-4.5.0.18-aarch64 target for our build, but unlike for ESR 91 we want the output-prefix option to be set to a folder in the build directory, so that we only use system packages.
Let's call our new snapshot SailfishOS-esr78-aarch64. Here's how we create it:
The build was astonishingly fast, less than three hours for everything, which must be some kind of record. That makes me rather suspicious, but let's see. The packages are all there; I'm able to transfer them to my phone:
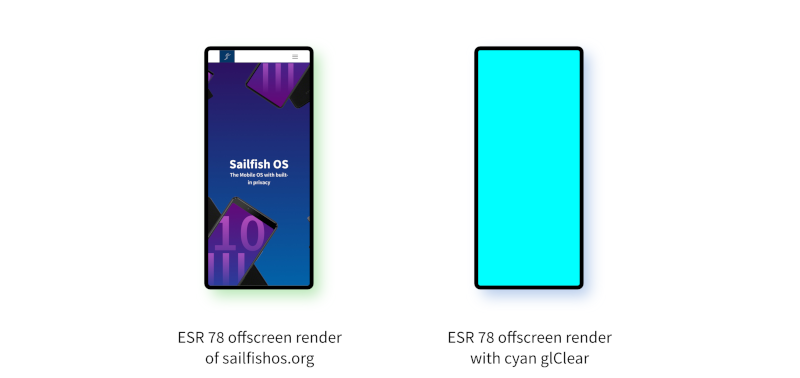
I've made the same change to the ESR 91 code and the great thing is I can now kick off a new build of ESR 91 in a different snapshot without having to make any changes to the configuration. I just switch gnu screen sessions and kick the build off:
If you'd like to read any of my other gecko diary entries, they're all available on my Gecko-dev Diary page.
Comment
In order to check whether changes to the build ought to be resulting in particular consequences in the running software, I'm wanting to make some changes to the ESR 78 code to see what happens there. You could say it's an experimental approach to debugging the ESR 91 code. But to do this I need to build ESR 78.
The change I want to make is simple. Over recent days we were looking at the CompositorOGL::EndFrame() code. This is called at the end of the render process in order to swap the back buffer with the front buffer and allow the latest updates to be shown onscreen. Before this swap happens I've added two lines of code, right at the top of the method:
void CompositorOGL::EndFrame() {
  AUTO_PROFILER_LABEL("CompositorOGL::EndFrame", GRAPHICS);

  mGLContext->fClearColor(0.0, 1.0, 1.0, 0.0);
  mGLContext->fClear(LOCAL_GL_COLOR_BUFFER_BIT | LOCAL_GL_DEPTH_BUFFER_BIT);
[...]
The two added lines are the fClearColor() and fClear() calls. Both of these combined should clear the buffer and leave it a nice cyan colour. That's assuming everything is working as I expect it to. If this works on ESR 78 then I can transfer the same code to ESR 91 to see whether it will work there. If it does, then I'll know the process of showing the surface onscreen is working and I should focus on the page rendering code. If it doesn't then it will indicate the surface render is broken and I should continue focusing my efforts there.So I'll need to set off a build of the ESR 78 code with these minor changes. Apart from the build being a lengthy process, it'll also involve configuring the build environment correctly. The sfdk build tool has some nice features for separating out different build environments and configurations using snapshots and sessions. I'm going to use both. It's quite important to get all this right though. Otherwise there's a risk I'll clobber my ESR 91 build configuration which will mean, quite apart from having to reconfigure things back, I may also have to do a full rebuild of all the many packages that have been touched by the ESR 91 changes.
For context, here's the build configuration I'm using for ESR 91. The important things to note are the output-prefix which is where the final packages end up and the target which combines both the choice of processor and the list of packages that are installed in the environment where the build takes place.
$ sfdk config
# ---- command scope ---------
# <clear>

# ---- session scope ---------
# <clear>

# ---- global scope ---------
output-prefix = /home/flypig/RPMS
device = kolbe
target = SailfishOS-devel-aarch64
The output-prefix is also important because it's used to override packages in the target. In other words, any packages it finds in this output directory will be used in preference to packages that are part of the target environment.
For reference, here are the targets that I have installed in my SDK:
$ sfdk tools target list
SailfishOS-3.4.0.24-aarch64  sdk-provided
SailfishOS-3.4.0.24-armv7hl  sdk-provided
SailfishOS-3.4.0.24-i486     sdk-provided
SailfishOS-4.5.0.18-aarch64  sdk-provided,latest
SailfishOS-4.5.0.18-armv7hl  sdk-provided,latest
SailfishOS-4.5.0.18-i486     sdk-provided,latest
SailfishOS-devel-aarch64     user-defined
SailfishOS-devel-armv7hl     user-defined
SailfishOS-devel-i486        user-defined
The devel targets are actually just copies of the 4.5.0.18 targets which I use for convenience to avoid having to remember which version is the latest. Here are the snapshots I have available to use with these:
$ sfdk tools list --snapshots
SailfishOS-3.4.0.24                          sdk-provided
├── SailfishOS-3.4.0.24-aarch64              sdk-provided
│   └── SailfishOS-3.4.0.24-aarch64.default  snapshot
├── SailfishOS-3.4.0.24-armv7hl              sdk-provided
│   └── SailfishOS-3.4.0.24-armv7hl.default  snapshot
└── SailfishOS-3.4.0.24-i486                 sdk-provided
    └── SailfishOS-3.4.0.24-i486.default     snapshot
SailfishOS-4.5.0.18                          sdk-provided,latest
├── SailfishOS-4.5.0.18-aarch64              sdk-provided,latest
│   └── SailfishOS-4.5.0.18-aarch64.default  snapshot
├── SailfishOS-4.5.0.18-armv7hl              sdk-provided,latest
│   └── SailfishOS-4.5.0.18-armv7hl.default  snapshot
├── SailfishOS-4.5.0.18-i486                 sdk-provided,latest
│   └── SailfishOS-4.5.0.18-i486.default     snapshot
├── SailfishOS-devel-aarch64                 user-defined
│   └── SailfishOS-devel-aarch64.default     snapshot
├── SailfishOS-devel-armv7hl                 user-defined
│   └── SailfishOS-devel-armv7hl.default     snapshot
└── SailfishOS-devel-i486                    user-defined
    └── SailfishOS-devel-i486.default        snapshot
The SailfishOS-devel-aarch64 target is the one I use to build ESR 91 against, but that in practice this gets cloned as SailfishOS-devel-aarch64.default for the actual build.So that's my current setup for ESR 91. For ESR 78 we want to tweak this a little. Like the SailfishOS-devel-aarch64 target we want to use a snapshot of the SailfishOS-4.5.0.18-aarch64 target for our build, but unlike for ESR 91 we want the output-prefix option to be set to a folder in the build directory, so that we only use system packages.
Let's call our new snapshot SailfishOS-esr78-aarch64. Here's how we create it:
$ sfdk tools clone SailfishOS-4.5.0.18-aarch64 SailfishOS-esr78-aarch64Now listing the targets we can check it was successfully created. I've removed some of the old targets I have installed on my machine for brevity.
$ sfdk tools list --snapshots
[...]
SailfishOS-4.5.0.18                          sdk-provided,latest
├── SailfishOS-4.5.0.18-aarch64              sdk-provided,latest
│   └── SailfishOS-4.5.0.18-aarch64.default  snapshot
├── SailfishOS-4.5.0.18-armv7hl              sdk-provided,latest
│   └── SailfishOS-4.5.0.18-armv7hl.default  snapshot
├── SailfishOS-4.5.0.18-i486                 sdk-provided,latest
│   └── SailfishOS-4.5.0.18-i486.default     snapshot
├── SailfishOS-devel-aarch64                 user-defined
│   └── SailfishOS-devel-aarch64.default     snapshot
├── SailfishOS-devel-armv7hl                 user-defined
│   └── SailfishOS-devel-armv7hl.default     snapshot
├── SailfishOS-devel-i486                    user-defined
│   └── SailfishOS-devel-i486.default        snapshot
└── SailfishOS-esr78-aarch64                 user-defined
    └── SailfishOS-esr78-aarch64.default     snapshot
That's created the snapshot, but I also need to update the configuration. There are a variety of different ways to do this, but this is the route I've chosen:
$ sfdk config --session output-prefix=${PWD}/RPMS
$ sfdk config --session target=SailfishOS-esr78-aarch64
This will reset the output target to its default of the RPMS folder inside the build directory and set the target to use our new snapshot. Now checking the configuration gives the following.
$ sfdk config
# ---- command scope ---------
# <clear>

# ---- session scope ---------
output-prefix = /home/flypig/Documents/Development/jolla/gecko-dev-project/
    gecko-dev/RPMS
target = SailfishOS-esr78-aarch64

# ---- global scope ---------
# masked at session scope
;output-prefix = /home/flypig/RPMS
device = kolbe
# masked at session scope
;target = SailfishOS-devel-aarch64
Ultimately I'd like to do partial builds, but to make sure everything is set up properly, especially the installed dependencies, I'm going to start by doing a full rebuild of the code.
$ sfdk build -d --with git_workaroundThis will, as always, take a long time. Below is an abridged copy of the first few screens of output. Notice in this output that 47 new dependencies are installed as part of this build process. I'll need all of those for the partial builds as well.
NOTICE: Appending changelog entries to the RPM SPEC file…
Setting version:
    78.15.1+git36+master.20240408074155.619a29e0d110+gecko.dev.4d734e782f53
Directory walk started
Directory walk done - 0 packages
Temporary output repo path: /home/flypig/Documents/Development/jolla/
    gecko-dev-project/gecko-dev/.sfdk/filtered-output-dir/.repodata/
Preparing sqlite DBs
[...]

The following 47 NEW packages are going to be installed:
  alsa-lib-devel                             1.2.8+git1-1.6.1.jolla
  autoconf213                                2.13-1.4.10.jolla
  bzip2-devel                                1.0.8+git2-1.6.4.jolla
  cairo-devel                                1.17.4+git1-1.6.2.jolla
  cargo                                      1.52.1+git4-1.9.1.jolla
  cbindgen                                   0.17.0+git4-1.12.5.jolla
  clang                                      10.0.1+git3-1.6.3.jolla
  clang-devel                                10.0.1+git3-1.6.3.jolla
  clang-libs                                 10.0.1+git3-1.6.3.jolla
  clang-tools-extra                          10.0.1+git3-1.6.3.jolla
  cpp                                        8.3.0-1.7.2.jolla
[...]
  zip                                        3.0+git1-1.6.6.jolla

47 new packages to install.
[...]
[...]The build was astonishingly fast, less than three hours for everything, which must be some kind of record. That makes me rather suspicious, but let's see. The packages are all there; I'm able to transfer them to my phone:
$ scp RPMS/SailfishOS-esr78-aarch64/xulrunner-qt5-78.*.rpm
    defaultuser@10.0.0.117:/home/defaultuser/Documents/Development/gecko/
And install them:
$ rpm -U xulrunner-qt5-78.*.rpm xulrunner-qt5-misc-78.*.rpm
    xulrunner-qt5-debuginfo-78.*.rpm xulrunner-qt5-debugsource-78.*.rpm
And run them:
$ harbour-webviewAnd what do we get with this? A really nice looking cyan screen and nothing else. This is great: this is what I wanted to see.

I've made the same change to the ESR 91 code and the great thing is I can now kick off a new build of ESR 91 in a different snapshot without having to make any changes to the configuration. I just switch gnu screen sessions and kick the build off:
$ sfdk config
# ---- command scope ---------
# <clear>

# ---- session scope ---------
# <clear>

# ---- global scope ---------
output-prefix = /home/flypig/RPMS
device = kolbe
target = SailfishOS-devel-aarch64

$ sfdk build -d --with git_workaround
Now that the ESR 78 build has completed I'm also able to do partial builds. Usually — for ESR 91 — I would use the following to get into the build engine. I've left the prompt prefixes in to help make clearer what's going on, but I generally remove them when writing these entries as they make things a bit messy.
$ sfdk engine exec
[mersdk@ba519abb3e13 gecko-dev]$ sb2 -t SailfishOS-devel-aarch64.default
[SB2 sdk-build SailfishOS-devel-aarch64.default] I have no name!@ba519abb3e13
    gecko-dev $
Now when I want to get into my new ESR 78 build target I'll do the following instead (I'll remove the prefixes again from now on):
$ sfdk engine exec
$ sb2 -t SailfishOS-esr78-aarch64.default
$
I can then perform a partial build using the following:
$ mv .git .git-disabled
$ source `pwd`/obj-build-mer-qt-xr/rpm-shared.env
$ make -j1 -C obj-build-mer-qt-xr/gfx/gl/
$ make -j16 -C `pwd`/obj-build-mer-qt-xr/toolkit
$ strip obj-build-mer-qt-xr/toolkit/library/build/libxul.so
But, that'll be useful for another day. As for today, the ESR 91 build is still running and I'll need to wait for that to complete before I can test my hypothesis. By the looks of things, that'll have to wait until tomorrow, so that's it for today.
If you'd like to read any of my other gecko diary entries, they're all available on my Gecko-dev Diary page.
9 Apr 2024 : Day 211 #
I've been talking about wrapping up my investigation of offscreen rendering initialisation for several days now, so I really ought to pull my finger out and actually move on. It's just, as I look through the code, I keep on finding new things to check. All of them have provided a little more insight, but none of them have resulted in a working renderer.
Today I stumbled on a new thing to check. The code that swaps the buffer is an obvious area where things might be going wrong. And since there's not much of it and it all happens within the CompositorOGL::EndFrame() method in both versions (which, incidentally, share the same code almost identically) it seemed worth spending the time to check it.
So first up the actual code that swaps the buffers. The idea is that the previous rendered frame is held in one buffer; the next frame is rendered off screen and then swapped out for the old one. This ensures the swap happens fast, minimising the chance of artefacts and flicker appearing during the render cycle.
Here's a copy of the method for reference.
It's therefore an obvious concern that this might be causing problems for the offscreen render pipeline as well. Clearly on ESR 78 these are disabled, but are they on ESR 91? Here's what we get when we try with ESR 91:
While stepping through this I noticed that when stepping out of the SwapBuffers() method I end up in the CompositorOGL::EndFrame() method. This is also a pretty simple and linear method, so I figure it might be worth checking it as well. So that's what I'm going to do.
Here's the output from the ESR 78 code for CompositorOGL::EndFrame(). I've cut some of the output for brevity.
What would be great is if this build were to complete before the end of today because I want to run a new build of ESR 78 overnight. Rebuilding ESR 78 might sound a little crazy, after all I should be focusing on ESR 91. But as I've previously explained, I want to test out rendering to the background in different colours to establish more accurately where rendering is failing. Every thing I've tried up to now has had no effect on the output, but that's all been using ESR 91. I want to test the same things on ESR 78. That means making minimal changes to the ESR 78 code and doing a rebuild to test it on-device.
I can't think of a better way of doing this. I've come to the conclusion I just can't get the same results using the debugger alone. And so it is that I need to rebuild ESR 78.
With all these builds and plans for builds, I won't be able to do much more work on this today, so onward into the week to see how things progress.
If you'd like to read any of my other gecko diary entries, they're all available on my Gecko-dev Diary page.
Comment
Today I stumbled on a new thing to check. The code that swaps the buffer is an obvious area where things might be going wrong. And since there's not much of it and it all happens within the CompositorOGL::EndFrame() method in both versions (which, incidentally, share the same code almost identically) it seemed worth spending the time to check it.
So first up the actual code that swaps the buffers. The idea is that the previous rendered frame is held in one buffer; the next frame is rendered off screen and then swapped out for the old one. This ensures the swap happens fast, minimising the chance of artefacts and flicker appearing during the render cycle.
Here's a copy of the method for reference.
bool GLContextEGL::SwapBuffers() {
  EGLSurface surface =
      mSurfaceOverride != EGL_NO_SURFACE ? mSurfaceOverride : mSurface;
  if (surface) {
    if ((mEgl->IsExtensionSupported(
             GLLibraryEGL::EXT_swap_buffers_with_damage) ||
         mEgl->IsExtensionSupported(
             GLLibraryEGL::KHR_swap_buffers_with_damage))) {
      std::vector<EGLint> rects;
      for (auto iter = mDamageRegion.RectIter(); !iter.Done(); iter.Next()) {
        const IntRect& r = iter.Get();
        rects.push_back(r.X());
        rects.push_back(r.Y());
        rects.push_back(r.Width());
        rects.push_back(r.Height());
      }
      mDamageRegion.SetEmpty();
      return mEgl->fSwapBuffersWithDamage(mEgl->Display(), surface,
                                          rects.data(), rects.size() / 4);
    }
    return mEgl->fSwapBuffers(mEgl->Display(), surface);
  } else {
    return false;
  }
}
Stepping through the code on ESR 78 this is what we get:
Thread 36 "Compositor" hit Breakpoint 1, mozilla::gl::GLContextEGL::
    SwapBuffers (this=0x7eac109140)
    at gfx/gl/GLContextProviderEGL.cpp:643
643     bool GLContextEGL::SwapBuffers() {
(gdb) n
[Thread 0x7fa4afe9a0 (LWP 24091) exited]
644       EGLSurface surface =
(gdb) n
[New Thread 0x7fa467c9a0 (LWP 24117)]
646       if (surface) {
(gdb) p surface
$1 = (EGLSurface) 0x7eac004170
(gdb) n
647         if ((mEgl->IsExtensionSupported(
(gdb) n
415     /opt/cross/aarch64-meego-linux-gnu/include/c++/8.3.0/bitset: No such
    file or directory.
(gdb)
663         return mEgl->fSwapBuffers(mEgl->Display(), surface);
(gdb)
The really important thing to notice about this is that the condition checking support for EXT_swap_buffers_with_damage or KHR_swap_buffers_with_damage both fail. This means that the condition is skipped rather than being entered. You may recall that back on Day 83 we had to explicitly disable these two extensions and that it was the act of disabling them that resulted in the onscreen render pipeline working successfully for the first time.It's therefore an obvious concern that this might be causing problems for the offscreen render pipeline as well. Clearly on ESR 78 these are disabled, but are they on ESR 91? Here's what we get when we try with ESR 91:
Thread 37 "Compositor" hit Breakpoint 1, mozilla::gl::GLContextEGL::
    SwapBuffers (this=0x7ee019aa50)
    at gfx/gl/GLContextProviderEGL.cpp:662
662     bool GLContextEGL::SwapBuffers() {
(gdb) n
663       EGLSurface surface =
(gdb)
665       if (surface) {
(gdb) p surface
$1 = (EGLSurface) 0x7ee0004b60
(gdb) n
[Thread 0x7f1f2fe7e0 (LWP 958) exited]
666         if ((mEgl->IsExtensionSupported(
(gdb)
415     include/c++/8.3.0/bitset: No such file or directory.
(gdb)
682         return mEgl->fSwapBuffers(surface);
(gdb)
This is almost identical to the ESR 78 output and crucially the extension condition is also being skipped. So I guess it's not this that's causing the problems for the offscreen render. Nonetheless I'm glad I checked.While stepping through this I noticed that when stepping out of the SwapBuffers() method I end up in the CompositorOGL::EndFrame() method. This is also a pretty simple and linear method, so I figure it might be worth checking it as well. So that's what I'm going to do.
Here's the output from the ESR 78 code for CompositorOGL::EndFrame(). I've cut some of the output for brevity.
Thread 36 "Compositor" hit Breakpoint 3, mozilla::layers::
    CompositorOGL::EndFrame (this=0x7eac003450)
    at gfx/layers/opengl/CompositorOGL.cpp:2000
2000    void CompositorOGL::EndFrame() {
(gdb) n
2001      AUTO_PROFILER_LABEL("CompositorOGL::EndFrame", GRAPHICS);
(gdb) n
2022      mShouldInvalidateWindow = false;
(gdb) n
2024      if (mTarget) {
(gdb) p mTarget
$4 = {mRawPtr = 0x0}
(gdb) n
2034      mWindowRenderTarget = nullptr;
(gdb) n
2035      mCurrentRenderTarget = nullptr;
(gdb) n
2037      if (mTexturePool) {
(gdb) p mTexturePool
$5 = {mRawPtr = 0x0}
(gdb) n
2043      mGLContext->SetDamage(mCurrentFrameInvalidRegion);
(gdb) n
2044      mGLContext->SwapBuffers();
(gdb) n
2045      mGLContext->fBindBuffer(LOCAL_GL_ARRAY_BUFFER, 0);
(gdb) n
2049        mGLContext->fActiveTexture(LOCAL_GL_TEXTURE0 + i);
(gdb) n
2050        mGLContext->fBindTexture(LOCAL_GL_TEXTURE_2D, 0);
(gdb) n
2051        if (!mGLContext->IsGLES()) {
(gdb) n
258     obj-build-mer-qt-xr/dist/include/GLContext.h: No such file or directory.
[...]
(gdb) n
2056      mCurrentFrameInvalidRegion.SetEmpty();
(gdb) n
2058      Compositor::EndFrame();
(gdb)
And here's the same on ESR 91. Once again, the execution flow, variables and output overall are almost identical.
Thread 37 "Compositor" hit Breakpoint 2, mozilla::layers::
    CompositorOGL::EndFrame (this=0x7ee0002f10)
    at gfx/layers/opengl/CompositorO
GL.cpp:2014
2014    void CompositorOGL::EndFrame() {
(gdb) n
2015      AUTO_PROFILER_LABEL("CompositorOGL::EndFrame", GRAPHICS);
(gdb) n
2035      mFrameInProgress = false;
(gdb) n
2036      mShouldInvalidateWindow = false;
(gdb) n
2038      if (mTarget) {
(gdb) p mTarget
$2 = {mRawPtr = 0x0}
(gdb) n
2048      mWindowRenderTarget = nullptr;
(gdb) n
2049      mCurrentRenderTarget = nullptr;
(gdb) n
2051      if (mTexturePool) {
(gdb) p mTexturePool
$3 = {mRawPtr = 0x0}
(gdb) n
2057      mGLContext->SetDamage(mCurrentFrameInvalidRegion);
(gdb) n
2058      mGLContext->SwapBuffers();
(gdb) n
2059      mGLContext->fBindBuffer(LOCAL_GL_ARRAY_BUFFER, 0);
(gdb) n
2063        mGLContext->fActiveTexture(LOCAL_GL_TEXTURE0 + i);
(gdb) n
2064        mGLContext->fBindTexture(LOCAL_GL_TEXTURE_2D, 0);
(gdb) n
2065        if (!mGLContext->IsGLES()) {
(gdb) n
260     ${PROJECT}/obj-build-mer-qt-xr/dist/include/GLContext.h: No such file
    or directory.
[...]
(gdb) n
2070      mCurrentFrameInvalidRegion.SetEmpty();
(gdb) n
[...]
2072      Compositor::EndFrame();
(gdb)
That's all good. Both match up nicely as we might hope. With that dealt with it now really does feel like it's time to move on. To cement this segue I've set the ESR 91 build running. This will allow me to check the changes I made over the last few days to the GetAppDisplay() usage. For some reason every night for the last few nights I've forgotten to run the build which has prevented me from checking it.What would be great is if this build were to complete before the end of today because I want to run a new build of ESR 78 overnight. Rebuilding ESR 78 might sound a little crazy, after all I should be focusing on ESR 91. But as I've previously explained, I want to test out rendering to the background in different colours to establish more accurately where rendering is failing. Every thing I've tried up to now has had no effect on the output, but that's all been using ESR 91. I want to test the same things on ESR 78. That means making minimal changes to the ESR 78 code and doing a rebuild to test it on-device.
I can't think of a better way of doing this. I've come to the conclusion I just can't get the same results using the debugger alone. And so it is that I need to rebuild ESR 78.
With all these builds and plans for builds, I won't be able to do much more work on this today, so onward into the week to see how things progress.
If you'd like to read any of my other gecko diary entries, they're all available on my Gecko-dev Diary page.
8 Apr 2024 : Day 210 #
I hope you'll forgive the fact it's a bit of a long diary entry today. If I were writing this properly I'd split the content up across a couple of days, but that wouldn't reflect what I'm actually doing. I'm not sure why I care about matching with reality, except to give a more honest reflection of what I'm actually doing. As with all of these diary entries, you won't miss anything if you skip the debugger output, skim the text, or frankly just skip the entire entry!
There were a couple of tasks (well, three if I'm honest) left over on my to-do list from yesterday. The first was to compare the two library creation executions on ESR 78 and ESR 91.
I've been doing that throughout the day today. It was quite a lengthy process and there were some odd changes. Like the fact that on ESR 78 two sets of EGL client extensions get initialised, each of which includes a call to MarkExtensions() with a particular prefix. The prefixes are "client" and "display":
The other big difference is that in GLLibraryEGL::DoEnsureInitialized() there's a call, about half way through the initialisation, to CreateDisplay():
Other than these I don't notice any other significant differences between the two initialisation processes.
Next up is the task of checking every instance where the display is used, with the aim of checking what it's set to in each case. While in ESR 78 the display value is used widely in the GLContextEGL class, it's primarily used to pass in to library methods. We saw that when we were stepping through the code on Day 207. In contrast ESR 91 moves the display variable directly in to the library calls. For example, In ESR 78 we have this — in my opinion — hideous use of non-bracketed code where the EGLDisplay dpy parameter is passed in:
While stepping through the code I was surprised to see GLContextEGL::CreateGLContext() being called twice on ESR 91. This made me a little suspicious, so I checked to see whether the same thing is happening on ESR 78.
It is. This still feels odd to me, but it's consistent across the two versions so presumably correct.
Here are the breakpoints that get hit on ESR 78:
To my eye, even though the initialisation flows of ESR 78 and ESR 91 are different, it looks to me like the same things get executed largely in the same order and the various relevant objects end up in a similar state.
Where does this leave things? It means that it's probably time to move on from the render initialisation process and take a look at the page rendering process instead. I'd still also like to get some kind of confirmation that if something were being rendered it would show on screen. You may recall I tried to do this a while back by changing the background colour of the screen clearing calls. This didn't yield good results, so I'll need to put some thought into an alternative method to show me what I need. I'll have to think about that tomorrow.
If you'd like to read any of my other gecko diary entries, they're all available on my Gecko-dev Diary page.
Comment
There were a couple of tasks (well, three if I'm honest) left over on my to-do list from yesterday. The first was to compare the two library creation executions on ESR 78 and ESR 91.
I've been doing that throughout the day today. It was quite a lengthy process and there were some odd changes. Like the fact that on ESR 78 two sets of EGL client extensions get initialised, each of which includes a call to MarkExtensions() with a particular prefix. The prefixes are "client" and "display":
  MarkExtensions(rawExtString, shouldDumpExts, "client",
    &mAvailableExtensions);
[...]
  MarkExtensions(rawExtString, shouldDumpExts, "display",
    &mAvailableExtensions);
On ESR 91 the initialisation process, which is quite similar in most other respects, does this differently, instead only initialising extensions with the "lib" prefix during the GLLibraryEGL::Init() method and then initialising extensions with the "display" prefix in the EglDisplay constructor:
  MarkExtensions(rawExtString, shouldDumpExts, "display",
    sEGLExtensionNames, &mAvailableExtensions);
[...]
  MarkExtensions(rawExtString, shouldDumpExts, "lib",
    sEGLLibraryExtensionNames, &mAvailableExtensions);
To be honest, I'm not really sure what this MarkExtensions() method is really needed for (I've read the code; it didn't really enlighten me), so I don't know whether this is a really significant difference or not. I'm going to hope not for the moment.The other big difference is that in GLLibraryEGL::DoEnsureInitialized() there's a call, about half way through the initialisation, to CreateDisplay():
  mEGLDisplay = CreateDisplay(forceAccel, gfxInfo, out_failureId, aDisplay);
  if (!mEGLDisplay) {
    return false;
  }
This has been removed in ESR 91 and now happens in the GLLibraryEGL::DefaultDisplay() method instead. What this means is that rather than being created during the library initialisation, it gets created the first time the default display is requested. This changes the order of things and, while I don't think it amounts to a practical difference, I could be wrong. Ordering can sometimes be crucial.Other than these I don't notice any other significant differences between the two initialisation processes.
Next up is the task of checking every instance where the display is used, with the aim of checking what it's set to in each case. While in ESR 78 the display value is used widely in the GLContextEGL class, it's primarily used to pass in to library methods. We saw that when we were stepping through the code on Day 207. In contrast ESR 91 moves the display variable directly in to the library calls. For example, In ESR 78 we have this — in my opinion — hideous use of non-bracketed code where the EGLDisplay dpy parameter is passed in:
          EGLSurface fCreatePbufferSurface(EGLDisplay dpy, EGLConfig config,
                                           const EGLint* attrib_list) const
      WRAP(fCreatePbufferSurface(dpy, config, attrib_list))
Compare this to the ESR 91 code, where the display value is now a class variable and so no longer needs to be passed on. Thankfully the brackets and indentation have been sorted out as well:
  EGLSurface fCreatePbufferSurface(EGLConfig config,
                                   const EGLint* attrib_list) const {
    return mLib->fCreatePbufferSurface(mDisplay, config, attrib_list);
  }
The consequence is that while the value for the display must be passed in when library methods are called in the ESR 78 code like this:
surface = egl->fCreatePbufferSurface(egl->Display(), config, &pbattrs[0]);In the ESR 91 code there's no need to pass the value in. We have this instead:
EGLSurface surface = egl.fCreatePbufferSurface(config, pbattrs.data());It's actually a nice change and simplifies the code greatly. But it makes our comparison harder. I've had to put breakpoints on all of the library methods as a result. Here's the full list:
GLContextEGL::GetWSIInfo
GLContextEGL::CreateGLContext
CreateEmulatorBufferSurface
EglDisplay::fTerminate
EglDisplay::fMakeCurrent
EglDisplay::fDestroyContext
EglDisplay::fCreateContext
EglDisplay::fDestroySurface
EglDisplay::fCreateWindowSurface
EglDisplay::fCreatePbufferSurface
EglDisplay::fCreatePbufferFromClientBuffer
EglDisplay::fChooseConfig
EglDisplay::fGetConfigAttrib
EglDisplay::fGetConfigs
EglDisplay::fSwapBuffers
EglDisplay::fBindTexImage
EglDisplay::fReleaseTexImage
EglDisplay::fSwapInterval
EglDisplay::fCreateImage
EglDisplay::fDestroyImage
EglDisplay::fQuerySurface
EglDisplay::fQuerySurfacePointerANGLE
EglDisplay::fCreateSync
EglDisplay::fDestroySync
EglDisplay::fClientWaitSync
EglDisplay::fGetSyncAttrib
EglDisplay::fWaitSync
EglDisplay::fDupNativeFenceFDANDROID
EglDisplay::fQueryDisplayAttribEXT
EglDisplay::fCreateStreamKHR
EglDisplay::fDestroyStreamKHR
EglDisplay::fQueryStreamKHR
EglDisplay::fStreamConsumerGLTextureExternalKHR
EglDisplay::fStreamConsumerAcquireKHR
EglDisplay::fStreamConsumerReleaseKHR
EglDisplay::fStreamConsumerGLTextureExternalAttribsNV
EglDisplay::fCreateStreamProducerD3DTextureANGLE
EglDisplay::fStreamPostD3DTextureANGLE
EglDisplay::fSwapBuffersWithDamage
EglDisplay::fSetDamageRegion
And here's the output resulting from my putting breakpoints on them. Please forgive the long and rather dull output here, but I'm trying to follow the same processes as on Day 207, which means sharing the same output here as well. Note that many of the breakpoints simply don't stick:
(gdb) b GLContextEGL::GetWSIInfo
Breakpoint 10 at 0x7ff1105558: file
gfx/gl/GLContextProviderEGL.cpp, line 692.
(gdb) b GLContextEGL::CreateGLContext
Breakpoint 11 at 0x7ff112d8d0: file
gfx/gl/GLContextProviderEGL.cpp, line 742.
(gdb) b CreateEmulatorBufferSurface
Breakpoint 12 at 0x7ff111d2c8: file
gfx/gl/GLContextProviderEGL.cpp, line 980.
(gdb) b EglDisplay::fTerminate
Breakpoint 13 at 0x7ff111baf0: file
gfx/gl/GLLibraryEGL.h, line 234.
(gdb) b EglDisplay::fMakeCurrent
Breakpoint 14 at 0x7ff1104a04: EglDisplay::fMakeCurrent. (2 locations)
(gdb) b EglDisplay::fDestroyContext
Breakpoint 15 at 0x7ff112f4b0: file
gfx/gl/GLLibraryEGL.h, line 242.
(gdb) b EglDisplay::fCreateContext
Breakpoint 16 at 0x7ff11098c8: file
gfx/gl/GLLibraryEGL.h, line 248.
(gdb) b EglDisplay::fDestroySurface
Breakpoint 17 at 0x7ff1104a20: EglDisplay::fDestroySurface. (2 locations)
(gdb) b EglDisplay::fCreateWindowSurface
Breakpoint 18 at 0x7ff11182ac: file gfx/gl/GLLibraryEGL.h, line 259.
(gdb) b EglDisplay::fCreatePbufferSurface
Breakpoint 19 at 0x7ff1109ef8: file gfx/gl/GLLibraryEGL.h, line 265.
(gdb) b EglDisplay::fCreatePbufferFromClientBuffer
Function "EglDisplay::fCreatePbufferFromClientBuffer" not defined.
Make breakpoint pending on future shared library load? (y or [n]) n
(gdb) b EglDisplay::fChooseConfig
Breakpoint 20 at 0x7ff1109bd8: EglDisplay::fChooseConfig. (2 locations)
(gdb) b EglDisplay::fGetConfigAttrib
Breakpoint 21 at 0x7ff110bf44: EglDisplay::fGetConfigAttrib. (5 locations)
(gdb) b EglDisplay::fGetConfigs
Function "EglDisplay::fGetConfigs" not defined.
Make breakpoint pending on future shared library load? (y or [n]) n
(gdb) b EglDisplay::fSwapBuffers
Breakpoint 22 at 0x7ff110ba70: file gfx/gl/GLLibraryEGL.h, line 303.
(gdb) b EglDisplay::fBindTexImage
Breakpoint 23 at 0x7ff1104ad0: file gfx/gl/GLLibraryEGL.h, line 324.
(gdb) b EglDisplay::fReleaseTexImage
Breakpoint 24 at 0x7ff1104a68: file gfx/gl/GLLibraryEGL.h, line 329.
(gdb) b EglDisplay::fSwapInterval
Breakpoint 25 at 0x7ff112e1dc: file gfx/gl/GLLibraryEGL.h, line 706.
(gdb) b EglDisplay::fCreateImage
Function "EglDisplay::fCreateImage" not defined.
Make breakpoint pending on future shared library load? (y or [n]) n
(gdb) b EglDisplay::fDestroyImage
Function "EglDisplay::fDestroyImage" not defined.
Make breakpoint pending on future shared library load? (y or [n]) n
(gdb) b EglDisplay::fQuerySurface
Breakpoint 26 at 0x7ff110751c: file gfx/gl/GLLibraryEGL.h, line 348.
(gdb) b EglDisplay::fQuerySurfacePointerANGLE
Function "EglDisplay::fQuerySurfacePointerANGLE" not defined.
Make breakpoint pending on future shared library load? (y or [n]) n
(gdb) b EglDisplay::fCreateSync
Function "EglDisplay::fCreateSync" not defined.
Make breakpoint pending on future shared library load? (y or [n]) n
(gdb) b EglDisplay::fDestroySync
Function "EglDisplay::fDestroySync" not defined.
Make breakpoint pending on future shared library load? (y or [n]) n
(gdb) b EglDisplay::fClientWaitSync
Function "EglDisplay::fClientWaitSync" not defined.
Make breakpoint pending on future shared library load? (y or [n]) n
(gdb) b EglDisplay::fGetSyncAttrib
Function "EglDisplay::fGetSyncAttrib" not defined.
Make breakpoint pending on future shared library load? (y or [n]) n
(gdb) b EglDisplay::fWaitSync
Function "EglDisplay::fWaitSync" not defined.
Make breakpoint pending on future shared library load? (y or [n]) n
(gdb) b EglDisplay::fDupNativeFenceFDANDROID
Function "EglDisplay::fDupNativeFenceFDANDROID" not defined.
Make breakpoint pending on future shared library load? (y or [n]) n
(gdb) b EglDisplay::fQueryDisplayAttribEXT
Function "EglDisplay::fQueryDisplayAttribEXT" not defined.
Make breakpoint pending on future shared library load? (y or [n]) n
(gdb) b EglDisplay::fCreateStreamKHR
Function "EglDisplay::fCreateStreamKHR" not defined.
Make breakpoint pending on future shared library load? (y or [n]) n
(gdb) b EglDisplay::fDestroyStreamKHR
Function "EglDisplay::fDestroyStreamKHR" not defined.
Make breakpoint pending on future shared library load? (y or [n]) n
(gdb) b EglDisplay::fQueryStreamKHR
Function "EglDisplay::fQueryStreamKHR" not defined.
Make breakpoint pending on future shared library load? (y or [n]) n
(gdb) b EglDisplay::fStreamConsumerGLTextureExternalKHR
Function "EglDisplay::fStreamConsumerGLTextureExternalKHR" not
    defined.
Make breakpoint pending on future shared library load? (y or [n]) n
(gdb) b EglDisplay::fStreamConsumerAcquireKHR
Function "EglDisplay::fStreamConsumerAcquireKHR" not defined.
Make breakpoint pending on future shared library load? (y or [n]) n
(gdb) b EglDisplay::fStreamConsumerReleaseKHR
Function "EglDisplay::fStreamConsumerReleaseKHR" not defined.
Make breakpoint pending on future shared library load? (y or [n]) n
(gdb) b EglDisplay::fStreamConsumerGLTextureExternalAttribsNV
Function "EglDisplay::fStreamConsumerGLTextureExternalAttribsNV" not
    defined.
Make breakpoint pending on future shared library load? (y or [n]) n
(gdb) b EglDisplay::fCreateStreamProducerD3DTextureANGLE
Function "EglDisplay::fCreateStreamProducerD3DTextureANGLE" not
    defined.
Make breakpoint pending on future shared library load? (y or [n]) n
(gdb) b EglDisplay::fStreamPostD3DTextureANGLE
Function "EglDisplay::fStreamPostD3DTextureANGLE" not defined.
Make breakpoint pending on future shared library load? (y or [n]) n
(gdb) b EglDisplay::fSwapBuffersWithDamage
Breakpoint 27 at 0x7ff110bc3c: file gfx/gl/GLLibraryEGL.h, line 448.
(gdb) b EglDisplay::fSetDamageRegion
Function "EglDisplay::fSetDamageRegion" not defined.
Make breakpoint pending on future shared library load? (y or [n]) n
(gdb) r
[...]
With that done the next step is to hop carefully through the code from breakpoint to breakpoint. The important thing to note here is that the display values exhibit the same behaviour as in ESR 78: they're all the same value and all set to 0x01. Once again this is a long and rather dull piece of debugger output; I've actually cut out a big portion since everything ends up looking the same.
Thread 38 "Compositor" hit Breakpoint 20, mozilla::gl::EglDisplay::
fChooseConfig (num_config=0x7f1f96efb4, config_size=1, configs=0x7f1f96efc0,
attrib_list=0x7edc004de8, this=0x7edc003590)
at gfx/gl/GLLibraryEGL.h:679
679 return mLib->fChooseConfig(mDisplay, attrib_list, configs,
config_size,
(gdb) p mDisplay
$1 = (const EGLDisplay) 0x1
(gdb) c
Continuing.
Thread 38 "Compositor" hit Breakpoint 19, mozilla::gl::EglDisplay::
fCreatePbufferSurface (attrib_list=0x7edc003cc8, config=0x555599bb50,
this=0x7edc003590)
at gfx/gl/GLLibraryEGL.h:666
666 return mLib->fCreatePbufferSurface(mDisplay, config, attrib_list);
(gdb) p /x mDisplay
$2 = 0x1
(gdb) c
Continuing.
Thread 38 "Compositor" hit Breakpoint 11, mozilla::gl::GLContextEGL::
CreateGLContext (
egl=std::shared_ptr<mozilla::gl::EglDisplay> (use count 4, weak count 2) =
{...}, desc=..., config=config@entry=0x555599bb50,
surface=surface@entry=0x7edc004b60, useGles=useGles@entry=false,
out_failureId=out_failureId@entry=0x7f1f96f1c8)
at gfx/gl/GLContextProviderEGL.cpp:742
742 nsACString* const out_failureId) {
(gdb) p /x egl->mDisplay
$3 = 0x1
(gdb) c
Continuing.
[...]
Thread 38 "Compositor" hit Breakpoint 14, mozilla::gl::EglDisplay::
fMakeCurrent (ctx=0x7edc004be0, read=0x7edc004b60, draw=0x7edc004b60,
this=0x7edc003590)
at gfx/gl/GLLibraryEGL.h:643
643 return mLib->fMakeCurrent(mDisplay, draw, read, ctx);
(gdb) p /x mDisplay
$9 = 0x1
(gdb) c
Continuing.
[New Thread 0x7f1f3bd7e0 (LWP 23890)]
=============== Preparing offscreen rendering context ===============
[New Thread 0x7f1f1bc7e0 (LWP 23891)]
[New Thread 0x7f1f17b7e0 (LWP 23892)]
[...]
Thread 38 "Compositor" hit Breakpoint 14, mozilla::gl::EglDisplay::
fMakeCurrent (ctx=0x7edc004be0, read=0x7edc004b60, draw=0x7edc004b60,
this=0x7edc003590)
at gfx/gl/GLLibraryEGL.h:643
643 return mLib->fMakeCurrent(mDisplay, draw, read, ctx);
(gdb) p /x mDisplay
$10 = 0x1
(gdb) c
Continuing.
[Thread 0x7f1f3bd7e0 (LWP 23890) exited]
[...]
That all looks healthy to me. I'm happy to see this, even if it means there's not a problem to fix, it makes me more confident that the initialisation steps are working as intended. The EGL display value, at least, seems to be set and used correctly.While stepping through the code I was surprised to see GLContextEGL::CreateGLContext() being called twice on ESR 91. This made me a little suspicious, so I checked to see whether the same thing is happening on ESR 78.
It is. This still feels odd to me, but it's consistent across the two versions so presumably correct.
Here are the breakpoints that get hit on ESR 78:
Thread 36 "Compositor" hit Breakpoint 1, mozilla::gl::GLContextEGL::
CreateGLContext (egl=egl@entry=0x7eac0036a0,
flags=flags@entry=mozilla::gl::CreateContextFlags::REQUIRE_COMPAT_PROFILE,
caps=..., isOffscreen=isOffscreen@entry=true,
config=config@entry=0x55558c8450, surface=surface@entry=0x7eac004170,
useGles=useGles@entry=false, out_failureId=out_failureId@entry=0x7fa512d378)
at gfx/gl/GLContextProviderEGL.cpp:719
719 nsACString* const out_failureId) {
(gdb) bt
#0 mozilla::gl::GLContextEGL::CreateGLContext (egl=egl@entry=0x7eac0036a0,
flags=flags@entry=mozilla::gl::CreateContextFlags::REQUIRE_COMPAT_PROFILE,
caps=..., isOffscreen=isOffscreen@entry=true,
config=config@entry=0x55558c8450, surface=surface@entry=0x7eac004170,
useGles=useGles@entry=false,
out_failureId=out_failureId@entry=0x7fa512d378)
at gfx/gl/GLContextProviderEGL.cpp:719
#1 0x0000007fb8e6f244 in mozilla::gl::GLContextEGL::
CreateEGLPBufferOffscreenContextImpl (out_failureId=0x7fa512d378,
aUseGles=false, minCaps=...,
size=..., flags=mozilla::gl::CreateContextFlags::REQUIRE_COMPAT_PROFILE)
at gfx/gl/GLContextProviderEGL.cpp:1360
#2 mozilla::gl::GLContextEGL::CreateEGLPBufferOffscreenContextImpl (
flags=<optimized out>, size=..., minCaps=..., aUseGles=<optimized out>,
out_failureId=0x7fa512d378) at gfx/gl/GLContextProviderEGL.cpp:1302
#3 0x0000007fb8e6f398 in mozilla::gl::GLContextEGL::
CreateEGLPBufferOffscreenContext (
flags=flags@entry=mozilla::gl::CreateContextFlags::REQUIRE_COMPAT_PROFILE,
size=..., minCaps=..., out_failureId=out_failureId@entry=0x7fa512d378)
at gfx/gl/GLContextProviderEGL.cpp:1377
#4 0x0000007fb8e6f41c in mozilla::gl::GLContextProviderEGL::CreateHeadless (
flags=flags@entry=mozilla::gl::CreateContextFlags::REQUIRE_COMPAT_PROFILE,
out_failureId=out_failureId@entry=0x7fa512d378)
at gfx/gl/GLContextProviderEGL.cpp:1391
[...]
#29 0x0000007fbe70b89c in thread_start () at ../sysdeps/unix/sysv/linux/aarch64/
clone.S:78
(gdb) c
Continuing.
Thread 36 "Compositor" hit Breakpoint 1, mozilla::gl::GLContextEGL::
CreateGLContext (egl=egl@entry=0x7eac0036a0,
flags=flags@entry=mozilla::gl::CreateContextFlags::REQUIRE_COMPAT_PROFILE,
caps=..., isOffscreen=isOffscreen@entry=true,
config=config@entry=0x55558c8450, surface=surface@entry=0x7eac004170,
useGles=useGles@entry=true, out_failureId=out_failureId@entry=0x7fa512d378)
at gfx/gl/GLContextProviderEGL.cpp:719
719 nsACString* const out_failureId) {
(gdb) bt
#0 mozilla::gl::GLContextEGL::CreateGLContext (egl=egl@entry=0x7eac0036a0,
flags=flags@entry=mozilla::gl::CreateContextFlags::REQUIRE_COMPAT_PROFILE,
caps=..., isOffscreen=isOffscreen@entry=true,
config=config@entry=0x55558c8450, surface=surface@entry=0x7eac004170,
useGles=useGles@entry=true,
out_failureId=out_failureId@entry=0x7fa512d378)
at gfx/gl/GLContextProviderEGL.cpp:719
#1 0x0000007fb8e6f244 in mozilla::gl::GLContextEGL::
CreateEGLPBufferOffscreenContextImpl (out_failureId=0x7fa512d378,
aUseGles=true, minCaps=...,
size=..., flags=mozilla::gl::CreateContextFlags::REQUIRE_COMPAT_PROFILE)
at gfx/gl/GLContextProviderEGL.cpp:1360
#2 mozilla::gl::GLContextEGL::CreateEGLPBufferOffscreenContextImpl (
flags=<optimized out>, size=..., minCaps=..., aUseGles=<optimized out>,
out_failureId=0x7fa512d378) at gfx/gl/GLContextProviderEGL.cpp:1302
#3 0x0000007fb8e6f3c4 in mozilla::gl::GLContextEGL::
CreateEGLPBufferOffscreenContext (
flags=flags@entry=mozilla::gl::CreateContextFlags::REQUIRE_COMPAT_PROFILE,
size=..., minCaps=..., out_failureId=out_failureId@entry=0x7fa512d378)
at gfx/gl/GLContextProviderEGL.cpp:1380
#4 0x0000007fb8e6f41c in mozilla::gl::GLContextProviderEGL::CreateHeadless (
flags=flags@entry=mozilla::gl::CreateContextFlags::REQUIRE_COMPAT_PROFILE,
out_failureId=out_failureId@entry=0x7fa512d378)
at gfx/gl/GLContextProviderEGL.cpp:1391
[...]
#29 0x0000007fbe70b89c in thread_start () at ../sysdeps/unix/sysv/linux/aarch64/
clone.S:78
(gdb) c
Continuing.
[New Thread 0x7fa4afe9a0 (LWP 3400)]
=============== Preparing offscreen rendering context ===============
[...]
And here are the same breakpoints getting hit on ESR 91. As you can see, the backtraces are similar in both cases. These all seems to be legit.
Thread 37 "Compositor" hit Breakpoint 28, mozilla::gl::GLContextEGL::
CreateGLContext (
egl=std::shared_ptr<mozilla::gl::EglDisplay> (use count 4, weak count 2) =
{...}, desc=..., config=config@entry=0x55558f7d10,
surface=surface@entry=0x7ed8004b60, useGles=useGles@entry=false,
out_failureId=out_failureId@entry=0x7f1f96f1c8)
at gfx/gl/GLContextProviderEGL.cpp:742
742 nsACString* const out_failureId) {
(gdb) bt
#0 mozilla::gl::GLContextEGL::CreateGLContext (egl=std::shared_ptr<mozilla::gl:
:EglDisplay> (use count 4, weak count 2) = {...}, desc=...,
config=config@entry=0x55558f7d10, surface=surface@entry=0x7ed8004b60,
useGles=useGles@entry=false, out_failureId=out_failureId@entry=0x7f1f96f1c8)
at gfx/gl/GLContextProviderEGL.cpp:742
#1 0x0000007ff112e674 in mozilla::gl::GLContextEGL::
CreateEGLPBufferOffscreenContextImpl (
egl=std::shared_ptr<mozilla::gl::EglDisplay> (use count 4, weak count 2) =
{...}, desc=..., size=..., useGles=useGles@entry=false,
out_failureId=out_failureId@entry=0x7f1f96f1c8)
at include/c++/8.3.0/ext/atomicity.h:96
#2 0x0000007ff112e7e4 in mozilla::gl::GLContextEGL::
CreateEGLPBufferOffscreenContext (
display=std::shared_ptr<mozilla::gl::EglDisplay> (use count 4, weak count
2) = {...}, desc=..., size=...,
out_failureId=out_failureId@entry=0x7f1f96f1c8)
at include/c++/8.3.0/ext/atomicity.h:96
#3 0x0000007ff112e9b8 in mozilla::gl::GLContextProviderEGL::CreateHeadless (
desc=..., out_failureId=out_failureId@entry=0x7f1f96f1c8)
at include/c++/8.3.0/ext/atomicity.h:96
#4 0x0000007ff112f260 in mozilla::gl::GLContextProviderEGL::CreateOffscreen (
size=..., minCaps=...,
flags=flags@entry=mozilla::gl::CreateContextFlags::REQUIRE_COMPAT_PROFILE,
out_failureId=out_failureId@entry=0x7f1f96f1c8)
at gfx/gl/GLContextProviderEGL.cpp:1476
[...]
#26 0x0000007ff6a0289c in thread_start () at ../sysdeps/unix/sysv/linux/aarch64/
clone.S:78
(gdb) c
Continuing.
Thread 37 "Compositor" hit Breakpoint 28, mozilla::gl::GLContextEGL::
CreateGLContext (
egl=std::shared_ptr<mozilla::gl::EglDisplay> (use count 4, weak count 2) =
{...}, desc=..., config=config@entry=0x55558f7d10,
surface=surface@entry=0x7ed8004b60, useGles=useGles@entry=true,
out_failureId=out_failureId@entry=0x7f1f96f1c8)
at gfx/gl/GLContextProviderEGL.cpp:742
742 nsACString* const out_failureId) {
(gdb) bt
#0 mozilla::gl::GLContextEGL::CreateGLContext (egl=std::shared_ptr<mozilla::gl:
:EglDisplay> (use count 4, weak count 2) = {...}, desc=...,
config=config@entry=0x55558f7d10, surface=surface@entry=0x7ed8004b60,
useGles=useGles@entry=true, out_failureId=out_failureId@entry=0x7f1f96f1c8)
at gfx/gl/GLContextProviderEGL.cpp:742
#1 0x0000007ff112e674 in mozilla::gl::GLContextEGL::
CreateEGLPBufferOffscreenContextImpl (
egl=std::shared_ptr<mozilla::gl::EglDisplay> (use count 4, weak count 2) =
{...}, desc=..., size=..., useGles=useGles@entry=true,
out_failureId=out_failureId@entry=0x7f1f96f1c8)
at include/c++/8.3.0/ext/atomicity.h:96
#2 0x0000007ff112e888 in mozilla::gl::GLContextEGL::
CreateEGLPBufferOffscreenContext (
display=std::shared_ptr<mozilla::gl::EglDisplay> (use count 4, weak count
2) = {...}, desc=..., size=...,
out_failureId=out_failureId@entry=0x7f1f96f1c8)
at include/c++/8.3.0/ext/atomicity.h:96
#3 0x0000007ff112e9b8 in mozilla::gl::GLContextProviderEGL::CreateHeadless (
desc=..., out_failureId=out_failureId@entry=0x7f1f96f1c8)
at include/c++/8.3.0/ext/atomicity.h:96
[...]
#26 0x0000007ff6a0289c in thread_start () at ../sysdeps/unix/sysv/linux/aarch64/
clone.S:78
(gdb) c
Continuing.
[New Thread 0x7f1f3fe7e0 (LWP 28609)]
=============== Preparing offscreen rendering context ===============
[...]
Since I now have breakpoints set on GLContextEGL::CreateGLContext(), as a final task for today, I thought I'd look at the inputs passed in to the method and stored within the GLContextEGL object. The creation methods are both pretty small and straightforward. Here's what happen when we inspect the values on ESR 78:
Thread 36 "Compositor" hit Breakpoint 4, mozilla::gl::GLContext::
    GLContext (this=this@entry=0x7eac109140,
    flags=mozilla::gl::CreateContextFlags::REQUIRE_COMPAT_PROFILE, caps=...,
    sharedContext=sharedContext@entry=0x0, isOffscreen=true,
    useTLSIsCurrent=useTLSIsCurrent@entry=false) at gfx/gl/GLContext.cpp:274
274     GLContext::GLContext(CreateContextFlags flags, const SurfaceCaps& caps,
(gdb) p flags
$12 = mozilla::gl::CreateContextFlags::REQUIRE_COMPAT_PROFILE
(gdb) p caps
$13 = (const mozilla::gl::SurfaceCaps &) @0x7fa516f210: {any = true, color =
    true, alpha = false, bpp16 = false, depth = false, stencil = false,
  premultAlpha = true, preserve = false, surfaceAllocator = {mRawPtr = 0x0}}
(gdb) p sharedContext
$14 = (mozilla::gl::GLContext *) 0x0
(gdb) p isOffscreen
$15 = true
(gdb) p useTLSIsCurrent
$16 = false
(gdb)
On ESR 91 things are a little different. The flags and isOffscreen values are passed in as part of a GLContextDesc object rather than being passed in as separate parameters. That's not too hard to unravel for comparison. But more tricky is the fact that there's no caps parameter at all. That's because this gets set in the GLContext::InitOffscreen() method instead. To properly compare the values we need to therefore check this method as well:
Thread 38 "Compositor" hit Breakpoint 30, mozilla::gl::GLContext::
GLContext (this=this@entry=0x7edc19aa50, desc=...,
sharedContext=sharedContext@entry=0x0,
useTLSIsCurrent=useTLSIsCurrent@entry=false)
at gfx/gl/GLContext.cpp:283
283 GLContext::GLContext(const GLContextDesc& desc, GLContext*
sharedContext,
(gdb) p desc.flags
$26 = mozilla::gl::CreateContextFlags::REQUIRE_COMPAT_PROFILE
(gdb) p sharedContext
$27 = (mozilla::gl::GLContext *) 0x0
(gdb) p desc.isOffscreen
$28 = true
(gdb) p useTLSIsCurrent
$29 = false
(gdb) p desc
$30 = (const mozilla::gl::GLContextDesc &) @0x7f1f930020: {<mozilla::gl::
GLContextCreateDesc> = {
flags = mozilla::gl::CreateContextFlags::REQUIRE_COMPAT_PROFILE},
isOffscreen = true}
(gdb) c
Continuing.
Thread 38 "Compositor" hit Breakpoint 31, mozilla::gl::GLContext::
InitOffscreen (this=this@entry=0x7edc19aa50, size=..., caps=...)
at gfx/gl/GLContext.cpp:2424
2424 const SurfaceCaps& caps) {
(gdb) p caps
$31 = (const mozilla::gl::SurfaceCaps &) @0x7f1f930158: {any = false, color =
true, alpha = false, bpp16 = false, depth = false, stencil = false,
premultAlpha = true, preserve = false, surfaceAllocator = {mRawPtr = 0x0}}
(gdb) n
2425 if (!CreateScreenBuffer(size, caps)) return false;
[...]
(gdb) n
2437 return true;
(gdb) p mScreen.mTuple.mFirstA.mCaps
$38 = {any = false, color = true, alpha = false, bpp16 = false, depth = false,
stencil = false, premultAlpha = true, preserve = false,
surfaceAllocator = {mRawPtr = 0x0}}
$39 = {any = false, color = true, alpha = false, bpp16 = false, depth = false,
stencil = false, premultAlpha = true, preserve = false,
surfaceAllocator = {mRawPtr = 0x0}}
(gdb)
The conclusion of the above is that although storage of the different parameters happens in slightly different places, the result is ultimately the same. The values stored as part of GLContext match across ESR 78 and ESR 91. On the one hand this isn't surprising: by now I've spent quite a bit of effort doing my best to get them to align. On the other hand it's also surprising: quite a lot of effort has been needed to get them to align, so there's been plenty of scope for errors.To my eye, even though the initialisation flows of ESR 78 and ESR 91 are different, it looks to me like the same things get executed largely in the same order and the various relevant objects end up in a similar state.
Where does this leave things? It means that it's probably time to move on from the render initialisation process and take a look at the page rendering process instead. I'd still also like to get some kind of confirmation that if something were being rendered it would show on screen. You may recall I tried to do this a while back by changing the background colour of the screen clearing calls. This didn't yield good results, so I'll need to put some thought into an alternative method to show me what I need. I'll have to think about that tomorrow.
If you'd like to read any of my other gecko diary entries, they're all available on my Gecko-dev Diary page.
7 Apr 2024 : Day 209 #
You may recall that yesterday I was just reading through the code, writing up my understanding of how the flow differs between ESR 78 and ESR 91 during the initialisation steps of the offscreen rendering pipeline.
By the end of that discussion I'd come up with a set of tasks to perform:
I've not done these quite in the order I said I would. This evening I've completed the second of the tasks, removing the extra call to GetAppDisplay() from the ESR 91 code. I've done this by adding an aDisplay parameter to DefaultEglLibrary() so it now looks like this:
That still leaves the task of comparing the EGL library creation code. I realise that I also left another task outstanding from a few days back, which is to place breakpoints on the ESR 91 code everywhere the display is used and check the value is the same all the way through. I did this for ESR 78 on Day 207 and — while it was rather dull and laborious — it did help me to understand the execution flow. It also highlighted that all the display values are the same (set to 0x01) throughout the execution. I'd be wanting to see something similar on ESR 91.
That's all going to be for tomorrow though. Overnight I plan to build the packages so I can test out the GetAppDisplay() changes I made today.
If you'd like to read any of my other gecko diary entries, they're all available on my Gecko-dev Diary page.
Comment
By the end of that discussion I'd come up with a set of tasks to perform:
First I'll compare the EGL library creation, then I'll remove this additional call to GetAppDisplay() and then, if none of these have fixed things, I'll make the larger changes to align the two flows more closely.
I've not done these quite in the order I said I would. This evening I've completed the second of the tasks, removing the extra call to GetAppDisplay() from the ESR 91 code. I've done this by adding an aDisplay parameter to DefaultEglLibrary() so it now looks like this:
RefPtr<GLLibraryEGL> DefaultEglLibrary(nsACString* const out_failureId,
EGLDisplay aDisplay) {
StaticMutexAutoLock lock(sMutex);
if (!gDefaultEglLibrary) {
gDefaultEglLibrary = GLLibraryEGL::Create(out_failureId, aDisplay);
if (!gDefaultEglLibrary) {
NS_WARNING("GLLibraryEGL::Create failed");
}
}
return gDefaultEglLibrary.get();
}
As a consequence I'm able to remove the call to GetAppDisplay() that was happening inside of this method. This has actually ended up simplifying the code as well. There's still a call to GetAppDisplay() inside GLContextEGLFactory::CreateImpl() which I'd like to get rid of, but there's no really obvious way to do this right now.That still leaves the task of comparing the EGL library creation code. I realise that I also left another task outstanding from a few days back, which is to place breakpoints on the ESR 91 code everywhere the display is used and check the value is the same all the way through. I did this for ESR 78 on Day 207 and — while it was rather dull and laborious — it did help me to understand the execution flow. It also highlighted that all the display values are the same (set to 0x01) throughout the execution. I'd be wanting to see something similar on ESR 91.
That's all going to be for tomorrow though. Overnight I plan to build the packages so I can test out the GetAppDisplay() changes I made today.
If you'd like to read any of my other gecko diary entries, they're all available on my Gecko-dev Diary page.
6 Apr 2024 : Day 208 #
Yesterday I promised to do two things. First to analyse the structure of the code around GLContextProviderEGL::CreateOffscreen() to find out why there were two calls to GetAppDisplay() on ESR 78 but only one on ESR 91. Second I said I was going to step through all the places where the display is used in ESR 91 to compare against what we saw with ESR 78.
For the first of these, we have three points of reference. Let's focus first on the ESR 78 code which in practice uses GetAppDisplay() in only one place:
Let's compare that to ESR 91. With the new code the call to GLLibraryEGL::EnsureInitialized() has been removed. Instead the code drops straight through to CreateHeadless(). The implementation of CreateHeadless() is a little different: instead of just calling CreateEGLPBufferOffscreenContext() it first makes a call to DefaultEglDisplay() which is why we get this first breakpoint hit:
It's this rather peculiar restructuring of the code that has led to GetAppDisplay() being called twice on ESR 91. Because the call to GLLibraryEGL::Create() also requires a display, but the display isn't passed in to DefaultEglLibrary(). Consequently another call to GetAppDisplay() is being made inside DefaultEglLibrary() as you can see from the second breakpoint hit:
All of the differences in flow here between ESR 78 and ESR 91 make things really messy. But I don't think I should revert all of the changes in ESR 91 just yet, I'll need to take things in stages. First I'll compare the EGL library creation, then I'll remove this additional call to GetAppDisplay() and then, if none of these have fixed things, I'll make the larger changes to align the two flows more closely.
It feels like this has been a helpful analysis, even if I've not written any code or made any changes today. But I have made a plan and some immediate tasks for me to perform tomorrow. So definitely not wasted effort.
If you'd like to read any of my other gecko diary entries, they're all available on my Gecko-dev Diary page.
Comment
For the first of these, we have three points of reference. Let's focus first on the ESR 78 code which in practice uses GetAppDisplay() in only one place:
#0  mozilla::gl::GetAppDisplay () at gfx/gl/GLContextProviderEGL.cpp:175
#1  0x0000007fb8e81a2c in mozilla::gl::GLContextProviderEGL::CreateOffscreen (
    size=..., minCaps=...,
    flags=flags@entry=mozilla::gl::CreateContextFlags::REQUIRE_COMPAT_PROFILE,
    out_failureId=out_failureId@entry=0x7fa516f378)
    at gfx/gl/GLContextProviderEGL.cpp:1404
The code this breakpoint is attached to looks like this:
  if (!GLLibraryEGL::EnsureInitialized(
          forceEnableHardware, out_failureId, GetAppDisplay())) {  // Needed
    for IsANGLE().
    return nullptr;
  }
This is a really crucial call because it ends up resulting in a call to GLLibraryEGL::DoEnsureInitialized() which is responsible for setting up everything about the EGL library. Having set that up we then drop back to CreateOffscreen() where CreateHeadless() is called to set up all the textures and surfaces. Finally GLContext::InitOffscreen() is called which looks like this:
bool GLContext::InitOffscreen(const gfx::IntSize& size,
                              const SurfaceCaps& caps) {
  if (!CreateScreenBuffer(size, caps)) return false;

  if (!MakeCurrent()) {
    return false;
  }
  fBindFramebuffer(LOCAL_GL_FRAMEBUFFER, 0);
  fScissor(0, 0, size.width, size.height);
  fViewport(0, 0, size.width, size.height);

  mCaps = mScreen->mCaps;
  MOZ_ASSERT(!mCaps.any);

  return true;
}
With that done, all of the main initialisation steps for the display are complete.Let's compare that to ESR 91. With the new code the call to GLLibraryEGL::EnsureInitialized() has been removed. Instead the code drops straight through to CreateHeadless(). The implementation of CreateHeadless() is a little different: instead of just calling CreateEGLPBufferOffscreenContext() it first makes a call to DefaultEglDisplay() which is why we get this first breakpoint hit:
#0  mozilla::gl::GetAppDisplay ()
    at gfx/gl/GLContextProviderEGL.cpp:161
#1  0x0000007ff112e910 in mozilla::gl::GLContextProviderEGL::CreateHeadless (
    desc=..., out_failureId=out_failureId@entry=0x7f1f5ac1c8)
    at gfx/gl/GLContextProviderEGL.cpp:1434
#2  0x0000007ff112f260 in mozilla::gl::GLContextProviderEGL::CreateOffscreen (
    size=..., minCaps=...,
    flags=flags@entry=mozilla::gl::CreateContextFlags::REQUIRE_COMPAT_PROFILE,
    out_failureId=out_failureId@entry=0x7f1f5ac1c8)
    at gfx/gl/GLContextProviderEGL.cpp:1476
That call will try to get the default EGL library and on the first occasion, when the "get" fails, it will call GLLibraryEGL::Create(). This will then end up calling GLLibraryEGL::Init() which is the closest equivalent we have in ESR 91 to GLLibraryEGL::DoEnsureInitialized(). I'm not going to have time today, but I should try to set some time aside over the coming days to compare the two. They're both long and complex methods, which makes them good candidates for problematic divergence.It's this rather peculiar restructuring of the code that has led to GetAppDisplay() being called twice on ESR 91. Because the call to GLLibraryEGL::Create() also requires a display, but the display isn't passed in to DefaultEglLibrary(). Consequently another call to GetAppDisplay() is being made inside DefaultEglLibrary() as you can see from the second breakpoint hit:
#0  mozilla::gl::GetAppDisplay ()
    at gfx/gl/GLContextProviderEGL.cpp:161
#1  0x0000007ff111907c in mozilla::gl::DefaultEglLibrary (
    out_failureId=out_failureId@entry=0x7f1f5ac1c8)
    at gfx/gl/GLContextProviderEGL.cpp:1519
#2  0x0000007ff112e920 in mozilla::gl::DefaultEglDisplay (aDisplay=0x1,
    out_failureId=0x7f1f5ac1c8)
    at gfx/gl/GLContextEGL.h:29
#3  mozilla::gl::GLContextProviderEGL::CreateHeadless (desc=...,
    out_failureId=out_failureId@entry=0x7f1f5ac1c8)
    at gfx/gl/GLContextProviderEGL.cpp:1434
#4  0x0000007ff112f260 in mozilla::gl::GLContextProviderEGL::CreateOffscreen (
    size=..., minCaps=...,
    flags=flags@entry=mozilla::gl::CreateContextFlags::REQUIRE_COMPAT_PROFILE,
    out_failureId=out_failureId@entry=0x7f1f5ac1c8)
    at gfx/gl/GLContextProviderEGL.cpp:1476
This second call turns out to be unnecessary: it'd be better to add an aDisplay parameter to DefaultEglLibrary(), making things line up better with the code in ESR 78. Having said that, a quick search for DefaultEglLibrary() shows it's also used in one other place, so if I change its signature I'll have to update this other call as well:
already_AddRefed<GLContext> GLContextEGLFactory::CreateImpl(
EGLNativeWindowType aWindow, bool aHardwareWebRender, bool aUseGles) {
nsCString failureId;
const auto lib = gl::DefaultEglLibrary(&failureId);
if (!lib) {
gfxCriticalNote << "Failed[3] to load EGL library: " <<
failureId.get();
return nullptr;
}
const auto egl = lib->CreateDisplay(true, &failureId, GetAppDisplay());
[...]
Since there's already a call to GetAppDisplay() it wouldn't be the end of the world to just move it up a little inside the method and store the result for use in both places. So this is also on my task list for tomorrow.All of the differences in flow here between ESR 78 and ESR 91 make things really messy. But I don't think I should revert all of the changes in ESR 91 just yet, I'll need to take things in stages. First I'll compare the EGL library creation, then I'll remove this additional call to GetAppDisplay() and then, if none of these have fixed things, I'll make the larger changes to align the two flows more closely.
It feels like this has been a helpful analysis, even if I've not written any code or made any changes today. But I have made a plan and some immediate tasks for me to perform tomorrow. So definitely not wasted effort.
If you'd like to read any of my other gecko diary entries, they're all available on my Gecko-dev Diary page.
5 Apr 2024 : Day 207 #
Today I'm continuing to step through the two different versions of the WebView app I'm testing with. I'm particularly interested in the value set for the EGL display variable. I'm concerned that this isn't being set properly and, if that's the case, that would be a serious hindrance to having a working render.
First up I'm going to set a breakpoint on the GetAppDisplay() method. This is the method that's supposed to tie the EGL display — where rending takes place — to the Qt display interface. Hopefully the execution and usage will be similar across the two versions. But let's see.
First up these are the places the method gets called when running the ESR 78 code.
So let's perform the same process but this time using the ESR 91 build for comparison:
Moreover, the CreateHeadless() method is itself being called from GLContextProviderEGL::CreateOffscreen(). Recall that this is the place where the GetAppDisplay() method was being called from in ESR 78. So all of these calls are happening in close proximity of one another.
I'm going to put the analysis of this to one side for now and come back to it. The next question to figure out is what the value being returned by the method is.
I'm not able to extract this from inside the GetAppDisplay() method because of the way the method is structured. But the method returns the value that I'm interested in. In all cases this value gets immediately passed in to another method, so if I can breakpoint on the method it gets passed to I can then extract the value from the input parameters of the method.
On ESR 78 the relevant method is the following. Notice how it has an aDisplay parameter. That's the parameter we're interested in.
Let's compare that to ESR 91. This time there are two breakpoints to add and we want to extract the values from both, assuming they hit.
The difference between the two is concerning. The ESR 78 execution is particularly problematic because there are two values being generated and right now it's not clear which one is actually being used. In order to make progress I need to understand this better.
My plan is to go through each instance of egl->Display() or mEgl->Display() in GLContextProviderEGL.cpp and add a breakpoint to the method containing it so that we can check its value. This will have two purposes. First it will help to understand the flow of execution: which methods should be called and which are unused. Second it will allow me to test what the value of the display is in each case.
You might ask why I don't just place a breakpoint on EGLLibrary::Display() and watch the values flow in. Well, I tried and the breakpoint won't stick. There is some benefit to doing it the hard way, which is that I'm getting to review all of the places in the code where it's used. If I'd taken the easy route I would have missed that opportunity.
Here are the methods that make use of the Display() value. I'm going to place a breakpoint on every single one and record every single usage until the page is completely rendered.
If you'd like to read any of my other gecko diary entries, they're all available on my Gecko-dev Diary page.
Comment
First up I'm going to set a breakpoint on the GetAppDisplay() method. This is the method that's supposed to tie the EGL display — where rending takes place — to the Qt display interface. Hopefully the execution and usage will be similar across the two versions. But let's see.
First up these are the places the method gets called when running the ESR 78 code.
(gdb) b GetAppDisplay
Function "GetAppDisplay" not defined.
Make breakpoint pending on future shared library load? (y or [n]) y
Breakpoint 1 (GetAppDisplay) pending.
(gdb) r
Starting program: /usr/bin/harbour-webview
[...]
Thread 36 "Compositor" hit Breakpoint 1, mozilla::gl::GetAppDisplay ()
    at gfx/gl/GLContextProviderEGL.cpp:175
175     static EGLDisplay GetAppDisplay() {
(gdb) bt
#0  mozilla::gl::GetAppDisplay () at gfx/gl/GLContextProviderEGL.cpp:175
#1  0x0000007fb8e81a2c in mozilla::gl::GLContextProviderEGL::CreateOffscreen (
    size=..., minCaps=...,
    flags=flags@entry=mozilla::gl::CreateContextFlags::REQUIRE_COMPAT_PROFILE,
    out_failureId=out_failureId@entry=0x7fa516f378)
    at gfx/gl/GLContextProviderEGL.cpp:1404
#2  0x0000007fb8ee275c in mozilla::layers::CompositorOGL::CreateContext (
    this=0x7eac003420)
    at gfx/layers/opengl/CompositorOGL.cpp:250
#3  mozilla::layers::CompositorOGL::CreateContext (this=0x7eac003420)
    at gfx/layers/opengl/CompositorOGL.cpp:223
#4  0x0000007fb8f033bc in mozilla::layers::CompositorOGL::Initialize (
    this=0x7eac003420, out_failureReason=0x7fa516f730)
    at gfx/layers/opengl/CompositorOGL.cpp:374
#5  0x0000007fb8fdaf7c in mozilla::layers::CompositorBridgeParent::
    NewCompositor (this=this@entry=0x7f8c99d8f0, aBackendHints=...)
    at gfx/layers/ipc/CompositorBridgeParent.cpp:1534
[...]
#25 0x0000007fbe70b89c in thread_start () at ../sysdeps/unix/sysv/linux/aarch64/
    clone.S:78
(gdb) c
Continuing.
[New Thread 0x7fa4afe9a0 (LWP 5119)]
=============== Preparing offscreen rendering context ===============
[...]
From this we can see it only gets called once in the GLContextProviderEGL::CreateOffscreen() method. We're also interested in the value it gets set to and that's going to be the next thing to look at. But first off I just want to compare how often the method gets called and where from.So let's perform the same process but this time using the ESR 91 build for comparison:
(gdb) b GetAppDisplay
Function "GetAppDisplay" not defined.
Make breakpoint pending on future shared library load? (y or [n]) y
Breakpoint 1 (GetAppDisplay) pending.
(gdb) r
Starting program: /usr/bin/harbour-webview
[...]

Thread 37 "Compositor" hit Breakpoint 1, mozilla::gl::GetAppDisplay ()
    at gfx/gl/GLContextProviderEGL.cpp:161
161     static EGLDisplay GetAppDisplay() {
(gdb) handle SIGPIPE nostop
Signal        Stop      Print   Pass to program Description
SIGPIPE       No        Yes     Yes             Broken pipe
(gdb) bt
#0  mozilla::gl::GetAppDisplay ()
    at gfx/gl/GLContextProviderEGL.cpp:161
#1  0x0000007ff112e910 in mozilla::gl::GLContextProviderEGL::CreateHeadless (
    desc=..., out_failureId=out_failureId@entry=0x7f1f5ac1c8)
    at gfx/gl/GLContextProviderEGL.cpp:1434
#2  0x0000007ff112f260 in mozilla::gl::GLContextProviderEGL::CreateOffscreen (
    size=..., minCaps=...,
    flags=flags@entry=mozilla::gl::CreateContextFlags::REQUIRE_COMPAT_PROFILE,
    out_failureId=out_failureId@entry=0x7f1f5ac1c8)
    at gfx/gl/GLContextProviderEGL.cpp:1476
#3  0x0000007ff1197d40 in mozilla::layers::CompositorOGL::CreateContext (
    this=this@entry=0x7ed8002f10)
    at gfx/layers/opengl/CompositorOGL.cpp:254
#4  0x0000007ff11ad520 in mozilla::layers::CompositorOGL::Initialize (
    this=0x7ed8002f10, out_failureReason=0x7f1f5ac520)
    at gfx/layers/opengl/CompositorOGL.cpp:391
#5  0x0000007ff12c31fc in mozilla::layers::CompositorBridgeParent::
    NewCompositor (this=this@entry=0x7fc4b77630, aBackendHints=...)
    at gfx/layers/ipc/CompositorBridgeParent.cpp:1493
[...]
#24 0x0000007ff6a0289c in thread_start () at ../sysdeps/unix/sysv/linux/aarch64/
    clone.S:78
(gdb) c
Continuing.

Thread 37 "Compositor" hit Breakpoint 1, mozilla::gl::GetAppDisplay ()
    at gfx/gl/GLContextProviderEGL.cpp:161
161     static EGLDisplay GetAppDisplay() {
(gdb) bt
#0  mozilla::gl::GetAppDisplay ()
    at gfx/gl/GLContextProviderEGL.cpp:161
#1  0x0000007ff111907c in mozilla::gl::DefaultEglLibrary (
    out_failureId=out_failureId@entry=0x7f1f5ac1c8)
    at gfx/gl/GLContextProviderEGL.cpp:1519
#2  0x0000007ff112e920 in mozilla::gl::DefaultEglDisplay (aDisplay=0x1,
    out_failureId=0x7f1f5ac1c8)
    at gfx/gl/GLContextEGL.h:29
#3  mozilla::gl::GLContextProviderEGL::CreateHeadless (desc=...,
    out_failureId=out_failureId@entry=0x7f1f5ac1c8)
    at gfx/gl/GLContextProviderEGL.cpp:1434
#4  0x0000007ff112f260 in mozilla::gl::GLContextProviderEGL::CreateOffscreen (
    size=..., minCaps=...,
    flags=flags@entry=mozilla::gl::CreateContextFlags::REQUIRE_COMPAT_PROFILE,
    out_failureId=out_failureId@entry=0x7f1f5ac1c8)
    at gfx/gl/GLContextProviderEGL.cpp:1476
#5  0x0000007ff1197d40 in mozilla::layers::CompositorOGL::CreateContext (
    this=this@entry=0x7ed8002f10)
    at gfx/layers/opengl/CompositorOGL.cpp:254
#6  0x0000007ff11ad520 in mozilla::layers::CompositorOGL::Initialize (
    this=0x7ed8002f10, out_failureReason=0x7f1f5ac520)
    at gfx/layers/opengl/CompositorOGL.cpp:391
#7  0x0000007ff12c31fc in mozilla::layers::CompositorBridgeParent::
    NewCompositor (this=this@entry=0x7fc4b77630, aBackendHints=...)
    at gfx/layers/ipc/CompositorBridgeParent.cpp:1493
[...]
#26 0x0000007ff6a0289c in thread_start () at ../sysdeps/unix/sysv/linux/aarch64/
    clone.S:78
Continuing.
[New Thread 0x7f1f1fe7e0 (LWP 16054)]
=============== Preparing offscreen rendering context ===============
[...]
This time the breakpoint hits twice. First the method is called from GLContextProviderEGL::CreateHeadless(). Soon after it's called from DefaultEglLibrary(). But as it happens this itself is being called from GLContextProviderEGL::CreateHeadless(). So it shouldn't be too hard to follow this through and figure out why it's getting called twice instead of once.Moreover, the CreateHeadless() method is itself being called from GLContextProviderEGL::CreateOffscreen(). Recall that this is the place where the GetAppDisplay() method was being called from in ESR 78. So all of these calls are happening in close proximity of one another.
I'm going to put the analysis of this to one side for now and come back to it. The next question to figure out is what the value being returned by the method is.
I'm not able to extract this from inside the GetAppDisplay() method because of the way the method is structured. But the method returns the value that I'm interested in. In all cases this value gets immediately passed in to another method, so if I can breakpoint on the method it gets passed to I can then extract the value from the input parameters of the method.
On ESR 78 the relevant method is the following. Notice how it has an aDisplay parameter. That's the parameter we're interested in.
/* static */
bool GLLibraryEGL::EnsureInitialized(bool forceAccel, nsACString* const
    out_failureId, EGLDisplay aDisplay);
We have two different methods to consider on ESR 91. Note again how they both have aDisplay parameters. Those are the parameters we need to check.
RefPtr<GLLibraryEGL> GLLibraryEGL::Create(nsACString* const out_failureId,
    EGLDisplay aDisplay)
inline std::shared_ptr<EglDisplay> DefaultEglDisplay(nsACString* const
    out_failureId, EGLDisplay aDisplay);
So, here goes with the ESR 78 build. I've placed a breakpoint on the method so we can extract the parameter.
(gdb) b GLLibraryEGL::EnsureInitialized
Breakpoint 2 at 0x7fb8e6ee78: file obj-build-mer-qt-xr/dist/include/mozilla/
    StaticPtr.h, line 152.
(gdb) r
The program being debugged has been started already.
Start it from the beginning? (y or n) y
Starting program: /usr/bin/harbour-webview
[...]
Thread 36 "Compositor" hit Breakpoint 2, mozilla::gl::GLLibraryEGL::
    EnsureInitialized (forceAccel=false, out_failureId=0x7fa516f378,
    aDisplay=0x1)
    at obj-build-mer-qt-xr/dist/include/mozilla/StaticPtr.h:152
152     obj-build-mer-qt-xr/dist/include/mozilla/StaticPtr.h: No such file or
    directory.
(gdb) p /x aDisplay
$1 = 0x1
(gdb) c
Continuing.

Thread 36 "Compositor" hit Breakpoint 2, mozilla::gl::GLLibraryEGL::
    EnsureInitialized (forceAccel=false, out_failureId=0x7fa516f378,
    aDisplay=0x0)
    at obj-build-mer-qt-xr/dist/include/mozilla/StaticPtr.h:152
152     in obj-build-mer-qt-xr/dist/include/mozilla/StaticPtr.h
(gdb) p /x aDisplay
$2 = 0x0
(gdb) c
Continuing.

Thread 36 "Compositor" hit Breakpoint 2, mozilla::gl::GLLibraryEGL::
    EnsureInitialized (forceAccel=false, out_failureId=0x7fa516f378,
    aDisplay=0x0)
    at obj-build-mer-qt-xr/dist/include/mozilla/StaticPtr.h:152
152     in obj-build-mer-qt-xr/dist/include/mozilla/StaticPtr.h
(gdb) p /x aDisplay
$3 = 0x0
(gdb)
As can be seen it actually hits this breakpoint three times. The first time the aDisplay value is set to 0x1. Subsequent calls have the value 0x0 passed on.Let's compare that to ESR 91. This time there are two breakpoints to add and we want to extract the values from both, assuming they hit.
(gdb) b GLLibraryEGL::Create
Breakpoint 1 at 0x7ff1118e8c: file gfx/gl/GLLibraryEGL.cpp, line 343.
(gdb) b DefaultEglDisplay
Breakpoint 2 at 0x7ff112e914: file gfx/gl/GLContextEGL.h, line 29.
(gdb) r
The program being debugged has been started already.
Start it from the beginning? (y or n) y
Starting program: /usr/bin/harbour-webview
[...]
Thread 38 "Compositor" hit Breakpoint 2, mozilla::gl::
    DefaultEglDisplay (aDisplay=0x1, out_failureId=0x7f1f94c1c8)
    at gfx/gl/GLContextEGL.h:29
29        const auto lib = DefaultEglLibrary(out_failureId);
(gdb) p /x aDisplay
$1 = 0x1
(gdb) c
Continuing.

Thread 38 "Compositor" hit Breakpoint 1, mozilla::gl::GLLibraryEGL::
    Create (out_failureId=out_failureId@entry=0x7f1f94c1c8, aDisplay=0x1)
    at gfx/gl/GLLibraryEGL.cpp:343
343     RefPtr<GLLibraryEGL> GLLibraryEGL::Create(nsACString* const
    out_failureId, EGLDisplay aDisplay) {
(gdb) p /x aDisplay
$2 = 0x1
(gdb)
There are two hits, one for each of our breakpoints. Both are being passed a display value of 0x1.The difference between the two is concerning. The ESR 78 execution is particularly problematic because there are two values being generated and right now it's not clear which one is actually being used. In order to make progress I need to understand this better.
My plan is to go through each instance of egl->Display() or mEgl->Display() in GLContextProviderEGL.cpp and add a breakpoint to the method containing it so that we can check its value. This will have two purposes. First it will help to understand the flow of execution: which methods should be called and which are unused. Second it will allow me to test what the value of the display is in each case.
You might ask why I don't just place a breakpoint on EGLLibrary::Display() and watch the values flow in. Well, I tried and the breakpoint won't stick. There is some benefit to doing it the hard way, which is that I'm getting to review all of the places in the code where it's used. If I'd taken the easy route I would have missed that opportunity.
Here are the methods that make use of the Display() value. I'm going to place a breakpoint on every single one and record every single usage until the page is completely rendered.
DestroySurface()
CreateFallbackSurface()
CreateSurfaceFromNativeWindow()
GLContextEGLFactory::CreateImpl()
GLContextEGL::GLContextEGL()
GLContextEGL::~GLContextEGL()
GLContextEGL::BindTexImage()
GLContextEGL::ReleaseTexImage()
GLContextEGL::MakeCurrentImpl()
GLContextEGL::RenewSurface()
GLContextEGL::SwapBuffers()
GLContextEGL::GetWSIInfo()
GLContextEGL::GetBufferAge()
GLContextEGL::CreateGLContext()
GLContextEGL::CreatePBufferSurfaceTryingPowerOfTwo()
GLContextEGL::CreateWaylandBufferSurface()
CreateEmulatorBufferSurface()
CreateConfig()
CreateEGLSurfaceImpl()
GLContextProviderEGL::DestroyEGLSurface()
GetAttrib()
ChooseConfigOffscreen()
GLContextEGL::CreateEGLPBufferOffscreenContextImpl()
Here goes!
(gdb) b CreateFallbackSurface
Function "CreateFallbackSurface" not defined.
Make breakpoint pending on future shared library load? (y or [n]) n
(gdb) b CreateSurfaceFromNativeWindow
Breakpoint 2 at 0x7fb8e673a8: CreateSurfaceFromNativeWindow. (2 locations)
(gdb) b GLContextEGLFactory::CreateImpl
Breakpoint 3 at 0x7fb8e6f460: file gfx/gl/GLContextProviderEGL.cpp, line 372.
(gdb) b GLContextEGL::GLContextEGL
Breakpoint 4 at 0x7fb8e67a98: file gfx/gl/GLContextProviderEGL.cpp, line 472.
(gdb) b GLContextEGL::~GLContextEGL
Breakpoint 5 at 0x7fb8e81668: GLContextEGL::~GLContextEGL. (2 locations)
(gdb) b GLContextEGL::BindTexImage
Breakpoint 6 at 0x7fb8e66328: GLContextEGL::BindTexImage. (2 locations)
(gdb) b GLContextEGL::ReleaseTexImage
Breakpoint 7 at 0x7fb8e663a8: GLContextEGL::ReleaseTexImage. (2 locations)
(gdb) b GLContextEGL::MakeCurrentImpl
Breakpoint 8 at 0x7fb8e66420: GLContextEGL::MakeCurrentImpl. (2 locations)
(gdb) b GLContextEGL::RenewSurface
Breakpoint 9 at 0x7fb8e67358: GLContextEGL::RenewSurface. (2 locations)
(gdb) b GLContextEGL::SwapBuffers
Breakpoint 10 at 0x7fb8e6ae40: file gfx/gl/GLContextProviderEGL.cpp, line 643.
(gdb) b GLContextEGL::GetWSIInfo
Breakpoint 11 at 0x7fb8e65da0: file gfx/gl/GLContextProviderEGL.cpp, line 674.
(gdb) b GLContextEGL::GetBufferAge
Function "GLContextEGL::GetBufferAge" not defined.
Make breakpoint pending on future shared library load? (y or [n]) n
(gdb) b GLContextEGL::CreateGLContext
Breakpoint 12 at 0x7fb8e69ef0: file gfx/gl/GLContextProviderEGL.cpp, line 719.
(gdb) b GLContextEGL::CreatePBufferSurfaceTryingPowerOfTwo
Breakpoint 13 at 0x7fb8e6bf80: file gfx/gl/GLContextProviderEGL.cpp, line 854.
(gdb) b GLContextEGL::CreateWaylandBufferSurface
Function "GLContextEGL::CreateWaylandBufferSurface" not defined.
Make breakpoint pending on future shared library load? (y or [n]) n
(gdb) b CreateEmulatorBufferSurface
Breakpoint 14 at 0x7fb8e67b40: file gfx/gl/GLContextProviderEGL.cpp, line 953.
(gdb) b CreateConfig
Breakpoint 15 at 0x7fb8e6a498: CreateConfig. (5 locations)
(gdb) b CreateEGLSurfaceImpl
Function "CreateEGLSurfaceImpl" not defined.
Make breakpoint pending on future shared library load? (y or [n]) n
(gdb) b GLContextProviderEGL::DestroyEGLSurface
Function "GLContextProviderEGL::DestroyEGLSurface" not defined.
Make breakpoint pending on future shared library load? (y or [n]) n
(gdb) b GetAttrib
Breakpoint 16 at 0x7fb8e6ab64: GetAttrib. (4 locations)
(gdb) b ChooseConfigOffscreen
Breakpoint 17 at 0x7fb8e6a920: file gfx/gl/GLContextProviderEGL.cpp, line 1265.
(gdb) b GLContextEGL::CreateEGLPBufferOffscreenContextImpl
Breakpoint 18 at 0x7fb8e6f130: GLContextEGL::
    CreateEGLPBufferOffscreenContextImpl. (2 locations)
(gdb) r
The program being debugged has been started already.
Start it from the beginning? (y or n) y
Starting program: /usr/bin/harbour-webview
[...]
That's all of the breakpoints set. Or at least, all that it was possible to make stick. The obvious thing for me to copy over now is the places where the breakpoint actually hit. But there are a lot of them and going through them is very laborious, so I'll just include a selection to give you a flavour.
Thread 38 "Compositor" hit Breakpoint 18, mozilla::gl::GLContextEGL::
CreateEGLPBufferOffscreenContextImpl (
flags=mozilla::gl::CreateContextFlags::REQUIRE_COMPAT_PROFILE, size=...,
minCaps=..., aUseGles=false, out_failureId=0x7fa55eb378)
at gfx/gl/GLContextProviderEGL.cpp:1305
1305 nsACString* const out_failureId) {
(gdb) n
1309 if (!GLLibraryEGL::EnsureInitialized(forceEnableHardware,
out_failureId)) {
(gdb) n
Thread 38 "Compositor" hit Breakpoint 18, mozilla::gl::GLContextEGL::
CreateEGLPBufferOffscreenContextImpl (out_failureId=0x7fa55eb378,
aUseGles=false,
minCaps=..., size=..., flags=mozilla::gl::CreateContextFlags::
REQUIRE_COMPAT_PROFILE)
at gfx/gl/GLContextProviderEGL.cpp:1313
1313 auto* egl = gl::GLLibraryEGL::Get();
(gdb) n
20 struct SurfaceCaps final {
(gdb) p /x egl->mEGLDisplay
$2 = 0x1
(gdb) c
Continuing.
Thread 38 "Compositor" hit Breakpoint 17, mozilla::gl::
ChooseConfigOffscreen (egl=egl@entry=0x7eac0036a0,
flags=flags@entry=mozilla::gl::CreateContextFlags::REQUIRE_COMPAT_PROFILE,
minCaps=..., aUseGles=aUseGles@entry=false,
useWindow=useWindow@entry=false,
out_configCaps=out_configCaps@entry=0x7fa55eb210)
at gfx/gl/GLContextProviderEGL.cpp:1265
1265 SurfaceCaps* const
out_configCaps) {
(gdb) n
1266 nsTArray<EGLint> configAttribList;
(gdb) p /x egl->mEGLDisplay
$3 = 0x1
(gdb) c
Continuing.
[...]
Thread 38 "Compositor" hit Breakpoint 8, mozilla::gl::GLContextEGL::
MakeCurrentImpl (this=0x7eac108cd0)
at gfx/gl/GLContextProviderEGL.cpp:571
571 EGLSurface surface =
(gdb) p /x mEgl.mRawPtr->mEGLDisplay
$21 = 0x1
(gdb) c
Continuing.
[New Thread 0x7fa4afe9a0 (LWP 19251)]
=============== Preparing offscreen rendering context ===============
[New Thread 0x7fae9649a0 (LWP 19252)]
[Thread 0x7fa50ee9a0 (LWP 12902) exited]
[Thread 0x7fa51ff9a0 (LWP 12872) exited]
[Thread 0x7fa512f9a0 (LWP 12900) exited]
[New Thread 0x7fae86d9a0 (LWP 19253)]
[New Thread 0x7fa48fd9a0 (LWP 19254)]
[New Thread 0x7fa48bc9a0 (LWP 19255)]
[New Thread 0x7fa487b9a0 (LWP 19256)]
[New Thread 0x7fa512f9a0 (LWP 19257)]
Thread 38 "Compositor" hit Breakpoint 8, mozilla::gl::GLContextEGL::
MakeCurrentImpl (this=0x7eac108cd0)
at gfx/gl/GLContextProviderEGL.cpp:571
571 EGLSurface surface =
(gdb) p /x mEgl.mRawPtr->mEGLDisplay
$22 = 0x1
(gdb) c
Continuing.
[Thread 0x7fa4afe9a0 (LWP 19251) exited]
[...]
Phew. One thing we can see from this is that every actual use of the display is set to 0x1. That's true for the onces I cut out as well. Now we have to check the same thing on ESR 91. It's a bit late to do that tonight, but it'll be first thing on my to-do list tomorrow.If you'd like to read any of my other gecko diary entries, they're all available on my Gecko-dev Diary page.
4 Apr 2024 : Day 206 #
Testing out my overnight build I'm pleased to discover that the infinite recursion is now resolved — no more segfaults — but rendering has still not returned. Nevertheless I should check that the mInternalDrawFB and mInternalReadFB are now being set correctly.
Back on Day 204 I placed a breakpoint on CompositorOGL::CreateContext() for this, stepping through to check the values:
If you'd like to read any of my other gecko diary entries, they're all available on my Gecko-dev Diary page.
Comment
Back on Day 204 I placed a breakpoint on CompositorOGL::CreateContext() for this, stepping through to check the values:
Thread 36 "Compositor" hit Breakpoint 1, mozilla::layers::
    CompositorOGL::CreateContext (this=0x7eac003420)
    at gfx/layers/opengl/CompositorOGL.cpp:223
223     already_AddRefed<mozilla::gl::GLContext> CompositorOGL::CreateContext()
    {
[...]
(gdb) n
mozilla::layers::CompositorOGL::Initialize (this=0x7eac003420,
    out_failureReason=0x7fa516f730)
    at gfx/layers/opengl/CompositorOGL.cpp:374
374       mGLContext = CreateContext();
(gdb) n
383       if (!mGLContext) {
(gdb) p mGLContext
$5 = {mRawPtr = 0x7eac109140}
(gdb) p mGLContext.mRawPtr
$6 = (mozilla::gl::GLContext *) 0x7eac109140
[...]
(gdb) p mGLContext.mRawPtr->mScreen.mTuple.mFirstA.mUserDrawFB
$12 = 0
(gdb) p mGLContext.mRawPtr->mScreen.mTuple.mFirstA.mUserReadFB
$13 = 0
(gdb) p mGLContext.mRawPtr->mScreen.mTuple.mFirstA.mInternalDrawFB
$14 = 2
(gdb) p mGLContext.mRawPtr->mScreen.mTuple.mFirstA.mInternalReadFB
$15 = 2
(gdb)
So I'll do the same on the latest version of the code to see whether we have the difference we need. Here's the output:
mozilla::layers::CompositorOGL::Initialize (this=0x7ee0002f10,
    out_failureReason=0x7f1f923520)
    at gfx/layers/opengl/CompositorOGL.cpp:391
391         mGLContext = CreateContext();
(gdb)
401       if (!mGLContext) {
(gdb) p mGLContext.mRawPtr->mScreen.mTuple.mFirstA.mUserDrawFB
$1 = 0
(gdb) p mGLContext.mRawPtr->mScreen.mTuple.mFirstA.mUserReadFB
$2 = 0
(gdb) p mGLContext.mRawPtr->mScreen.mTuple.mFirstA.mInternalDrawFB
$3 = 2
(gdb) p mGLContext.mRawPtr->mScreen.mTuple.mFirstA.mInternalReadFB
$4 = 2
(gdb)
That does look a lot more healthy now. So, with that in order, it's back to stepping through the execution, comparing ESR 78 with ESR 91 again. But that's for today. As you can see, it's only a short one today — the checking took a lot longer than I was expecting — but there's plenty still to do and with any luck I'll find time to pick up the pace a bit tomorrow and over the weekend.If you'd like to read any of my other gecko diary entries, they're all available on my Gecko-dev Diary page.
3 Apr 2024 : Day 205 #
Time to test out my overnight build. Yesterday I added in some code that had got lost in the transition from ESR 78 to ESR 91. The code allows the name of the frame buffer objects created for reading and writing to be recorded for use within gecko when they get bound to a target.
This is achieved by (sort-of) overriding the call to fBindFramebuffer. Instead of just calling the relevant OpenGL function (in this case glBindFramebuffer() as all of the other GL library methods do, this new call does a bit more work before calling this underlying function. Here's the code for the underlying method (this is the same snippet I gave in my diary entry yesterday):
I built new packages overnight, but now when I run them this morning I immediately get a segmentation fault.
This clearly isn't just your standard invalid memory read or write; it's the program running out of stack due to an accidental recursion. Fascinating! But not intentional! The GLContext::fBindFramebuffer() method is calling GLScreenBuffer::BindFB()< which is again calling GLContext::fBindFramebuffer() creating a loop of pairs of calls repeatedly calling themselves over and over again. Let's go back to the code to find out why. As it happens we already saw the code for the two methods above. And sure enough fBindFramebuffer() calls mScreen->BindFB() which then goes on to call mGL->fBindFramebuffer().
This code is guaranteed to cause problems and I should have noticed it yesterday before setting the build to run. The code in the fBindFramebuffer() method came directly from ESR 78, so the issue must be a difference in implementation between the version of BindFB() on ESR 78 compared to ESR 91. So let's check the ESR 78 version of that:
There are many other cases where fBindFramebuffer() gets called but a quick search of the ESR 78 code shows that these are the only ones that have been switched to use raw_fBindFramebuffer(), other than the couple of additional calls that we already have inside our new fBindFramebuffer() override.
With any luck, that should be enough to fix the infinite calling loop. I've set the build going, so now it's a case of finding out what effect this will have tomorrow morning.
If you'd like to read any of my other gecko diary entries, they're all available on my Gecko-dev Diary page.
Comment
This is achieved by (sort-of) overriding the call to fBindFramebuffer. Instead of just calling the relevant OpenGL function (in this case glBindFramebuffer() as all of the other GL library methods do, this new call does a bit more work before calling this underlying function. Here's the code for the underlying method (this is the same snippet I gave in my diary entry yesterday):
void GLContext::fBindFramebuffer(GLenum target, GLuint framebuffer) {
  if (!mScreen) {
    raw_fBindFramebuffer(target, framebuffer);
    return;
  }

  switch (target) {
    case LOCAL_GL_DRAW_FRAMEBUFFER_EXT:
      mScreen->BindDrawFB(framebuffer);
      return;

    case LOCAL_GL_READ_FRAMEBUFFER_EXT:
      mScreen->BindReadFB(framebuffer);
      return;

    case LOCAL_GL_FRAMEBUFFER:
      mScreen->BindFB(framebuffer);
      return;

    default:
      // Nothing we care about, likely an error.
      break;
  }

  raw_fBindFramebuffer(target, framebuffer);
}
In this code there are a couple of calls to raw_fBindFramebuffer(). These are the calls that execute the underlying OpenGL function. But there are also calls to GLScreenBuffer::BindDrawFB(), GLScreenBuffer::BindReadFB() and GLScreenBuffer::BindFB(). These all do some additional work, for example the code for the last of these looks like this:
void GLScreenBuffer::BindFB(GLuint fb) {
  GLuint drawFB = DrawFB();
  GLuint readFB = ReadFB();

  mUserDrawFB = fb;
  mUserReadFB = fb;
  mInternalDrawFB = (fb == 0) ? drawFB : fb;
  mInternalReadFB = (fb == 0) ? readFB : fb;

  if (mInternalDrawFB == mInternalReadFB) {
    mGL->fBindFramebuffer(LOCAL_GL_FRAMEBUFFER, mInternalDrawFB);
  } else {
    MOZ_ASSERT(mGL->IsSupported(GLFeature::split_framebuffer));
    mGL->fBindFramebuffer(LOCAL_GL_DRAW_FRAMEBUFFER_EXT, mInternalDrawFB);
    mGL->fBindFramebuffer(LOCAL_GL_READ_FRAMEBUFFER_EXT, mInternalReadFB);
  }
}
As we can see, this records the value of fb inside the GLSCreenBuffer object and then goes on to perform some other OpenGL binding actions. Without the overriding GLContext::fBindFramebuffer() method the frame buffer names never get recorded. That could be quite a serious gap in the rendering process, so it'll be good to have it fixed.I built new packages overnight, but now when I run them this morning I immediately get a segmentation fault.
$ harbour-webview
[D] unknown:0 - QML debugging is enabled. Only use this in a safe environment.
[...]
[JavaScript Error: "Unexpected event profile-after-change" {file:
    "resource://gre/modules/URLQueryStrippingListService.jsm" line:
    228}]
observe@resource://gre/modules/URLQueryStrippingListService.jsm:228:12

Created LOG for EmbedPrefs
Created LOG for EmbedLiteLayerManager
Segmentation fault
$
When I run it through the debugger to get a backtrace I get an unexpected and unusual and unexpected result:
$ gdb harbour-webview
[...]
(gdb) r
Starting program: /usr/bin/harbour-webview
[...]

Created LOG for EmbedLiteLayerManager

Thread 36 "Compositor" received signal SIGSEGV, Segmentation fault.
[Switching to Thread 0x7f1f7c07e0 (LWP 18578)]
mozilla::gl::GLScreenBuffer::BindFB (this=0x7fc4697440, fb=fb@entry=2)
    at gfx/gl/GLScreenBuffer.cpp:306
306     void GLScreenBuffer::BindFB(GLuint fb) {
(gdb) bt
#0  mozilla::gl::GLScreenBuffer::BindFB (this=0x7fc4697440, fb=fb@entry=2)
    at gfx/gl/GLScreenBuffer.cpp:306
#1  0x0000007ff110e244 in mozilla::gl::GLContext::fBindFramebuffer (
    this=0x7edc19aa50, target=target@entry=36160, framebuffer=2)
    at gfx/gl/GLContext.cpp:2256
#2  0x0000007ff1100ecc in mozilla::gl::GLScreenBuffer::BindFB (this=<optimized
    out>, fb=fb@entry=2)
    at gfx/gl/GLScreenBuffer.cpp:316
#3  0x0000007ff110e244 in mozilla::gl::GLContext::fBindFramebuffer (
    this=0x7edc19aa50, target=target@entry=36160, framebuffer=2)
    at gfx/gl/GLContext.cpp:2256
#4  0x0000007ff1100ecc in mozilla::gl::GLScreenBuffer::BindFB (this=<optimized
    out>, fb=fb@entry=2)
    at gfx/gl/GLScreenBuffer.cpp:316
#5  0x0000007ff110e244 in mozilla::gl::GLContext::fBindFramebuffer (
    this=0x7edc19aa50, target=target@entry=36160, framebuffer=2)
    at gfx/gl/GLContext.cpp:2256
#6  0x0000007ff1100ecc in mozilla::gl::GLScreenBuffer::BindFB (this=<optimized
    out>, fb=fb@entry=2)
    at gfx/gl/GLScreenBuffer.cpp:316
#7  0x0000007ff110e244 in mozilla::gl::GLContext::fBindFramebuffer (
    this=0x7edc19aa50, target=target@entry=36160, framebuffer=2)
    at gfx/gl/GLContext.cpp:2256
#8  0x0000007ff1100ecc in mozilla::gl::GLScreenBuffer::BindFB (this=<optimized
    out>, fb=fb@entry=2)
    at gfx/gl/GLScreenBuffer.cpp:316
#9  0x0000007ff110e244 in mozilla::gl::GLContext::fBindFramebuffer (
    this=0x7edc19aa50, target=target@entry=36160, framebuffer=2)
    at gfx/gl/GLContext.cpp:2256
#10 0x0000007ff1100ecc in mozilla::gl::GLScreenBuffer::BindFB (this=<optimized
    out>, fb=fb@entry=2)
    at gfx/gl/GLScreenBuffer.cpp:316
[...]
#335 0x0000007ff110e244 in mozilla::gl::GLContext::fBindFramebuffer (
    this=0x7edc19aa50, target=target@entry=36160, framebuffer=2)
    at gfx/gl/GLContext.cpp:2256
#336 0x0000007ff1100ecc in mozilla::gl::GLScreenBuffer::BindFB (this=<optimized
    out>, fb=fb@entry=2)
    at gfx/gl/GLScreenBuffer.cpp:316
#337 0x0000007ff110e244 in mozilla::gl::GLContext::fBindFramebuffer (
    this=0x7edc19aa50, target=target@entry=36160, framebuffer=2)
    at gfx/gl/GLContext.cpp:2256
[...]
It goes on and on and on until eventually I give up following it.This clearly isn't just your standard invalid memory read or write; it's the program running out of stack due to an accidental recursion. Fascinating! But not intentional! The GLContext::fBindFramebuffer() method is calling GLScreenBuffer::BindFB()< which is again calling GLContext::fBindFramebuffer() creating a loop of pairs of calls repeatedly calling themselves over and over again. Let's go back to the code to find out why. As it happens we already saw the code for the two methods above. And sure enough fBindFramebuffer() calls mScreen->BindFB() which then goes on to call mGL->fBindFramebuffer().
This code is guaranteed to cause problems and I should have noticed it yesterday before setting the build to run. The code in the fBindFramebuffer() method came directly from ESR 78, so the issue must be a difference in implementation between the version of BindFB() on ESR 78 compared to ESR 91. So let's check the ESR 78 version of that:
void GLScreenBuffer::BindFB(GLuint fb) {
  GLuint drawFB = DrawFB();
  GLuint readFB = ReadFB();

  mUserDrawFB = fb;
  mUserReadFB = fb;
  mInternalDrawFB = (fb == 0) ? drawFB : fb;
  mInternalReadFB = (fb == 0) ? readFB : fb;

  if (mInternalDrawFB == mInternalReadFB) {
    mGL->raw_fBindFramebuffer(LOCAL_GL_FRAMEBUFFER, mInternalDrawFB);
  } else {
    MOZ_ASSERT(mGL->IsSupported(GLFeature::split_framebuffer));
    mGL->raw_fBindFramebuffer(LOCAL_GL_DRAW_FRAMEBUFFER_EXT, mInternalDrawFB);
    mGL->raw_fBindFramebuffer(LOCAL_GL_READ_FRAMEBUFFER_EXT, mInternalReadFB);
  }
}
The difference is clear. While on ESR 78 the code has been updated to call the underlying raw_fBindFramebuffer() method, I didn't make this change on ESR 91. So, time to do that now. Apart from this small change the rest of the code in the BindFB() method looks identical. There are a few other changes to make though as it turns out there are similar issues going on with BindDrawFB(), BindReadFB() and BindReadFB_Internal() as well. The last of these is rather mysterious and doesn't seem to get called anywhere, but I've updated it just in case.There are many other cases where fBindFramebuffer() gets called but a quick search of the ESR 78 code shows that these are the only ones that have been switched to use raw_fBindFramebuffer(), other than the couple of additional calls that we already have inside our new fBindFramebuffer() override.
With any luck, that should be enough to fix the infinite calling loop. I've set the build going, so now it's a case of finding out what effect this will have tomorrow morning.
If you'd like to read any of my other gecko diary entries, they're all available on my Gecko-dev Diary page.
2 Apr 2024 : Day 204 #
It's refreshing to be working with a fully built binary again with all the debug source aligning with the binary. Debugging is so much more fulfilling this way.
That's good, because I spent today doing lots more debugging. The first thing I did today is step through the CompositorOGL::BeginFrame() method so see whether my changes were actually being executed. In particular, I wanted to know whether the colour used to clear the texture was being set to something other than white.
Debugging confirms that it is:
However, while digging through the code I did discover some anomalies. Anomalies caused by patches making changes in ESR 78 that I'd not applied to ESR 91. The two patches are 0070 "Fix flipped FBO textures when rendering to an offscreen target" and 0071 "Do not flip scissor rects when rendering to an offscreen window." Both are certainly relevant to the parts of the code I'm working on. I have my doubts that rendering would be completely scuppered without them, but fixing them still looks worthwhile.
After all, the changes are likely to be needed anyway, even if they're not going to solve the rendering problem on their own.
So I've applied them both. They're both small patches and so easy to introduce into the ESR 91 code.
Although I've done a quick build and executed the code to check the screen has remained stubbornly blank. So as suspected these aren't the only problems I need to fix. So now I've reached the point where it feels it might be helpful to step through the code, side-by-side, with ESR 78 and ESR 91 simultaneously.
The purpose of this is to try to find where the two diverge. If there are differences, this could be the source of my troubles. It's a laborious but thorough process and so feels to me to be the most fruitful way forwards at this point.
Since I'm already working in this area the CompositorOGL::CreateContext() method seems like as good a place to start as any, so I've been stepping through from there for most of the day.
Eventually I notice a difference between the execution of ESR 78 and that of ESR 91. I pored over the values assigned in the mScreen object. This is of type GLScreenBuffer and is one of the class variables in GLContext (note that this is GLContext rather than the GLContextEGL that we were focusing on last week).
The interesting parts are the frame buffer variables. Here's what they look like on ESR 78:
The next step is to find out where they're getting set on ESR 78. It's immediately clear from the code that the mInternalDrawFB and mInternalReadFB variables get set in the GLContext::fBindFramebuffer() method, but actually figuring out where this happens turns out to be more challenging. Here's what the relevant method looks like:
Eventually I do get to the right point though. When reading through the debugging steps it's useful to know that the value of LOCAL_GL_FRAMEBUFFER is defined to be 0x8D40 in GLConsts.h:
Now this is all well and good, but the real question is why this is happening correctly on ESR 78 but not ESR 91. When I eventually get to checking the ESR 91 code I discover it's because on ESR 91 the fBindFramebuffer() method doesn't have the same wrapper as on ESR 78; instead it goes straight for the library method:
I've done this and checked it compiles. But to properly understand the resulting effect I'm going to need to step through the code again, which means a full rebuild will be needed. It's 21:31 in the evening now so, as you know, that means an overnight build. Probably now is a good time to stop anyway. So onward to tomorrow, when we'll see if this has made any practical difference!
If you'd like to read any of my other gecko diary entries, they're all available on my Gecko-dev Diary page.
Comment
That's good, because I spent today doing lots more debugging. The first thing I did today is step through the CompositorOGL::BeginFrame() method so see whether my changes were actually being executed. In particular, I wanted to know whether the colour used to clear the texture was being set to something other than white.
Debugging confirms that it is:
[...]
Thread 37 "Compositor" hit Breakpoint 1, mozilla::layers::
    CompositorOGL::BeginFrame (this=0x7ed8002ed0, aInvalidRegion=...,
    aClipRect=...,
    aRenderBounds=..., aOpaqueRegion=...)
    at gfx/layers/opengl/CompositorOGL.cpp:1084
1084      mClearColor.r = 0.0;
(gdb) n
[Thread 0x7f172fe7e0 (LWP 2982) exited]
1085      mClearColor.g = 0.0;
(gdb)
1086      mClearColor.b = 1.0;
(gdb)
[New Thread 0x7f170bc7e0 (LWP 3141)]
1087      mClearColor.a = 0.0;
(gdb)
1088      mGLContext->fClearColor(mClearColor.r, mClearColor.g, mClearColor.b,
(gdb)
[New Thread 0x7f1707b7e0 (LWP 3143)]
1091      mGLContext->fClear(clearBits);
(gdb)
1093      return Some(rect);
1084      mClearColor.r = 0.0;
(gdb) disable break
(gdb) c
Continuing.
But this has no effect on the screen output. Maybe this isn't where the background colour gets set at all? My explorations with ESR 78 yesterday would seem to imply this is the case. So I've dug around the code a bit more but can't see anywhere more appropriate to add similar changes in. There are a couple of other places where textures are cleared so I tried changing the colours for those as well but to no avail.However, while digging through the code I did discover some anomalies. Anomalies caused by patches making changes in ESR 78 that I'd not applied to ESR 91. The two patches are 0070 "Fix flipped FBO textures when rendering to an offscreen target" and 0071 "Do not flip scissor rects when rendering to an offscreen window." Both are certainly relevant to the parts of the code I'm working on. I have my doubts that rendering would be completely scuppered without them, but fixing them still looks worthwhile.
After all, the changes are likely to be needed anyway, even if they're not going to solve the rendering problem on their own.
So I've applied them both. They're both small patches and so easy to introduce into the ESR 91 code.
Although I've done a quick build and executed the code to check the screen has remained stubbornly blank. So as suspected these aren't the only problems I need to fix. So now I've reached the point where it feels it might be helpful to step through the code, side-by-side, with ESR 78 and ESR 91 simultaneously.
The purpose of this is to try to find where the two diverge. If there are differences, this could be the source of my troubles. It's a laborious but thorough process and so feels to me to be the most fruitful way forwards at this point.
Since I'm already working in this area the CompositorOGL::CreateContext() method seems like as good a place to start as any, so I've been stepping through from there for most of the day.
Eventually I notice a difference between the execution of ESR 78 and that of ESR 91. I pored over the values assigned in the mScreen object. This is of type GLScreenBuffer and is one of the class variables in GLContext (note that this is GLContext rather than the GLContextEGL that we were focusing on last week).
The interesting parts are the frame buffer variables. Here's what they look like on ESR 78:
Thread 36 "Compositor" hit Breakpoint 1, mozilla::layers::
    CompositorOGL::CreateContext (this=0x7eac003420)
    at gfx/layers/opengl/CompositorOGL.cpp:223
223     already_AddRefed<mozilla::gl::GLContext> CompositorOGL::CreateContext()
    {
[...]
(gdb) n
mozilla::layers::CompositorOGL::Initialize (this=0x7eac003420,
    out_failureReason=0x7fa516f730)
    at gfx/layers/opengl/CompositorOGL.cpp:374
374       mGLContext = CreateContext();
(gdb) n
383       if (!mGLContext) {
(gdb) p mGLContext
$5 = {mRawPtr = 0x7eac109140}
(gdb) p mGLContext.mRawPtr
$6 = (mozilla::gl::GLContext *) 0x7eac109140
[...]
(gdb) p mGLContext.mRawPtr->mScreen.mTuple.mFirstA.mUserDrawFB
$12 = 0
(gdb) p mGLContext.mRawPtr->mScreen.mTuple.mFirstA.mUserReadFB
$13 = 0
(gdb) p mGLContext.mRawPtr->mScreen.mTuple.mFirstA.mInternalDrawFB
$14 = 2
(gdb) p mGLContext.mRawPtr->mScreen.mTuple.mFirstA.mInternalReadFB
$15 = 2
(gdb)
But on ESR 91 these same values are decidedly more zero:
Thread 37 "Compositor" hit Breakpoint 1, mozilla::layers::
    CompositorOGL::CreateContext (this=this@entry=0x7ed8002f10)
    at gfx/layers/opengl/CompositorOGL.cpp:227
227     already_AddRefed<mozilla::gl::GLContext> CompositorOGL::CreateContext()
    {
[...]
(gdb) n
401       if (!mGLContext) {
(gdb) p mGLContext
$6 = {mRawPtr = 0x7ed819aa50}
(gdb) p mGLContext.mRawPtr
$7 = (mozilla::gl::GLContext *) 0x7ed819aa50
[...]
(gdb) p mGLContext.mRawPtr->mScreen.mTuple.mFirstA.mUserDrawFB
$10 = 0
(gdb) p mGLContext.mRawPtr->mScreen.mTuple.mFirstA.mUserReadFB
$11 = 0
(gdb) p mGLContext.mRawPtr->mScreen.mTuple.mFirstA.mInternalDrawFB
$12 = 0
(gdb) p mGLContext.mRawPtr->mScreen.mTuple.mFirstA.mInternalReadFB
$13 = 0
(gdb)
That looks suspicious to me. A zero value suggests they've not been initialised at all, compared to ESR 78 where they quite clearly have been initialised. It looks broken. But that's also great! Something very concrete to fix.The next step is to find out where they're getting set on ESR 78. It's immediately clear from the code that the mInternalDrawFB and mInternalReadFB variables get set in the GLContext::fBindFramebuffer() method, but actually figuring out where this happens turns out to be more challenging. Here's what the relevant method looks like:
void GLContext::fBindFramebuffer(GLenum target, GLuint framebuffer) {
  if (!mScreen) {
    raw_fBindFramebuffer(target, framebuffer);
    return;
  }

  switch (target) {
    case LOCAL_GL_DRAW_FRAMEBUFFER_EXT:
      mScreen->BindDrawFB(framebuffer);
      return;

    case LOCAL_GL_READ_FRAMEBUFFER_EXT:
      mScreen->BindReadFB(framebuffer);
      return;

    case LOCAL_GL_FRAMEBUFFER:
      mScreen->BindFB(framebuffer);
      return;

    default:
      // Nothing we care about, likely an error.
      break;
  }

  raw_fBindFramebuffer(target, framebuffer);
}
It takes quite a bit of stepping through to find the right call, because the the method is called multiple times and usually exits early due to the fact there's no mScreen value set.Eventually I do get to the right point though. When reading through the debugging steps it's useful to know that the value of LOCAL_GL_FRAMEBUFFER is defined to be 0x8D40 in GLConsts.h:
#define LOCAL_GL_FRAMEBUFFER 0x8D40That should help clarify what's going on here:
Thread 36 "Compositor" hit Breakpoint 4, mozilla::gl::GLContext::
    fBindFramebuffer (this=this@entry=0x7ea8109140, target=target@entry=36160,
    framebuffer=framebuffer@entry=0) at obj-build-mer-qt-xr/dist/include/
    mozilla/UniquePtr.h:287
287     obj-build-mer-qt-xr/dist/include/mozilla/UniquePtr.h: No such file or
    directory.
(gdb) n
2325        raw_fBindFramebuffer(target, framebuffer);
(gdb) p mScreen.mTuple.mFirstA
$17 = (mozilla::gl::GLScreenBuffer *) 0x0
(gdb) c
Continuing.
[...]
Thread 36 "Compositor" hit Breakpoint 4, mozilla::gl::GLContext::
    fBindFramebuffer (this=0x7ea8109140, target=36160, framebuffer=0)
    at obj-build-mer-qt-xr/dist/include/mozilla/UniquePtr.h:287
287     obj-build-mer-qt-xr/dist/include/mozilla/UniquePtr.h: No such file or
    directory.
(gdb) n
2329      switch (target) {
(gdb) p /x target
$21 = 0x8d40
(gdb) n
2339          mScreen->BindFB(framebuffer);
So this is definitely the right place. But the backtrace produced from this is confusing because checking the GLContext::CreateScreenBufferImpl() method, which is the call on the second frame, none of the code in that method actually calls GLContext::fBindFramebuffer().
(gdb) bt
#0  mozilla::gl::GLContext::fBindFramebuffer (this=0x7ea8109140, target=36160,
    framebuffer=0)
    at gfx/gl/GLContext.cpp:2339
#1  0x0000007fb8e81890 in mozilla::gl::GLContext::CreateScreenBufferImpl (
    this=this@entry=0x7ea8109140, size=..., caps=...)
    at gfx/gl/GLContext.cpp:2135
#2  0x0000007fb8e818ec in mozilla::gl::GLContext::CreateScreenBuffer (caps=...,
    size=..., this=0x7ea8109140)
    at gfx/gl/GLContext.h:3517
#3  mozilla::gl::GLContext::InitOffscreen (this=0x7ea8109140, size=...,
    caps=...)
    at gfx/gl/GLContext.cpp:2578
#4  0x0000007fb8e81ac8 in mozilla::gl::GLContextProviderEGL::CreateOffscreen (
    size=..., minCaps=...,
    flags=flags@entry=mozilla::gl::CreateContextFlags::REQUIRE_COMPAT_PROFILE,
    out_failureId=out_failureId@entry=0x7fa51fe378)
    at gfx/gl/GLContextProviderEGL.cpp:1443
#5  0x0000007fb8ee275c in mozilla::layers::CompositorOGL::CreateContext (
    this=0x7ea8003420)
    at gfx/layers/opengl/CompositorOGL.cpp:250
#6  mozilla::layers::CompositorOGL::CreateContext (this=0x7ea8003420)
    at gfx/layers/opengl/CompositorOGL.cpp:223
#7  0x0000007fb8f033bc in mozilla::layers::CompositorOGL::Initialize (
    this=0x7ea8003420, out_failureReason=0x7fa51fe730)
    at gfx/layers/opengl/CompositorOGL.cpp:374
#8  0x0000007fb8fdaf7c in mozilla::layers::CompositorBridgeParent::
    NewCompositor (this=this@entry=0x7f8c99db50, aBackendHints=...)
    at gfx/layers/ipc/CompositorBridgeParent.cpp:1534
#9  0x0000007fb8fe45e8 in mozilla::layers::CompositorBridgeParent::
    InitializeLayerManager (this=this@entry=0x7f8c99db50, aBackendHints=...)
    at gfx/layers/ipc/CompositorBridgeParent.cpp:1491
#10 0x0000007fb8fe4730 in mozilla::layers::CompositorBridgeParent::
    AllocPLayerTransactionParent (this=this@entry=0x7f8c99db50,
    aBackendHints=..., aId=...)
    at gfx/layers/ipc/CompositorBridgeParent.cpp:1587
#11 0x0000007fbb2e11b4 in mozilla::embedlite::EmbedLiteCompositorBridgeParent::
    AllocPLayerTransactionParent (this=0x7f8c99db50, aBackendHints=...,
    aId=...) at mobile/sailfishos/embedthread/
    EmbedLiteCompositorBridgeParent.cpp:77
#12 0x0000007fb88bf3d0 in mozilla::layers::PCompositorBridgeParent::
    OnMessageReceived (this=0x7f8c99db50, msg__=...) at
    PCompositorBridgeParent.cpp:1391
[...]
#28 0x0000007fbe70b89c in thread_start () at ../sysdeps/unix/sysv/linux/aarch64/
    clone.S:78
(gdb)
It looks like the reason for this is that it's being called as part of the ScopedBindFramebuffer wrapper. But it's confusing.Now this is all well and good, but the real question is why this is happening correctly on ESR 78 but not ESR 91. When I eventually get to checking the ESR 91 code I discover it's because on ESR 91 the fBindFramebuffer() method doesn't have the same wrapper as on ESR 78; instead it goes straight for the library method:
  void fBindFramebuffer(GLenum target, GLuint framebuffer) {
    BEFORE_GL_CALL;
    mSymbols.fBindFramebuffer(target, framebuffer);
    AFTER_GL_CALL;
  }
On ESR 78 this has been wrapped and replaced by a call to raw_fBindFramebuffer() (which looks the same as the above snippet for fBindFramebuffer(). The fix, therefore should be to add the same wrapper from ESR 78 into the ESR 91 code.I've done this and checked it compiles. But to properly understand the resulting effect I'm going to need to step through the code again, which means a full rebuild will be needed. It's 21:31 in the evening now so, as you know, that means an overnight build. Probably now is a good time to stop anyway. So onward to tomorrow, when we'll see if this has made any practical difference!
If you'd like to read any of my other gecko diary entries, they're all available on my Gecko-dev Diary page.
1 Apr 2024 : Day 203 #
Today I've spent a fair bit of time exploring a new part of the rendering process. Having spent a lot of time on the nuts and bolts of textures, images and surfaces over the last few days, it's made a nice change to be looking at fresh parts of the code.
My plan has been to try to check that the texture that's used as a canvas is being rendered on to the screen properly. Historically the way I've done this when it comes to the browser (as opposed to the WebView) has been to clear the texture to a particular colour. The buffer-clearing calls sit in the sailfish-browser code and specifically the declarativewebcontainer.cpp source file where there's a method specifically for the purpose:
But this isn't part of the WebView code. In the case of the WebView the location of the code that performs this task is less clear to me. In fact it may be there is no direct equivalent, but it still feels like I should be able to place this glClear() code somewhere in order to get a similar result, even if there isn't anything yet in the codebase that's doing this.
The challenge therefore is to find the right place for this. Checking through the code I eventually come upon the CompositorOGL::BeginFrame() method. This includes code like this:
I've added some changes to the ESR 91 codebase to set the colour to dark blue again, in the hope this will have an impact on the output. When I step through the code, I can see that the colour value is getting set to blue. But I can't see this having any consequence on what's rendered to the screen.
To try to distinguish between the two I've attempted to run the WebView on ESR 78 and, although I don't want to have to go to the trouble of recompiling, I can poke in values for the colour to see whether they have any effect.
Here's the debug output from me changing the colour value on ESR 78 mid-execution using the debugger.
But that also means that there's no scope to do more partial building of the code today. Once the full rebuild has completed I'll return to this topic to see whether I can get any more concrete results.
In the meantime, if you'd like to read any of my other gecko diary entries, they're all available on my Gecko-dev Diary page.
Comment
My plan has been to try to check that the texture that's used as a canvas is being rendered on to the screen properly. Historically the way I've done this when it comes to the browser (as opposed to the WebView) has been to clear the texture to a particular colour. The buffer-clearing calls sit in the sailfish-browser code and specifically the declarativewebcontainer.cpp source file where there's a method specifically for the purpose:
void DeclarativeWebContainer::clearWindowSurface()
{
    Q_ASSERT(m_context);
    // The GL context should always be used from the same thread in which it
    was created.
    Q_ASSERT(m_context->thread() == QThread::currentThread());
    m_context->makeCurrent(this);
    QOpenGLFunctions_ES2* funcs =
    m_context->versionFunctions<QOpenGLFunctions_ES2>();
    Q_ASSERT(funcs);

    funcs->glClearColor(1.0, 1.0, 1.0, 0.0);
    funcs->glClear(GL_COLOR_BUFFER_BIT);
    m_context->swapBuffers(this);
}
This method clears the texture to a white colour before performing rendering of the web page on top of it. By changing the value passed to glClearColor() it's possible to get immediate feedback about the fact that the texture is being rendered. For example, suppose the code is changed to the following:
    funcs->glClearColor(0.0, ).0, 1.0, 0.0);
    funcs->glClear(GL_COLOR_BUFFER_BIT);
In this case the screen will change to a dark blue on initial render, only later being painted over by the web page itself.But this isn't part of the WebView code. In the case of the WebView the location of the code that performs this task is less clear to me. In fact it may be there is no direct equivalent, but it still feels like I should be able to place this glClear() code somewhere in order to get a similar result, even if there isn't anything yet in the codebase that's doing this.
The challenge therefore is to find the right place for this. Checking through the code I eventually come upon the CompositorOGL::BeginFrame() method. This includes code like this:
  mGLContext->fClearColor(mClearColor.r, mClearColor.g, mClearColor.b,
                          mClearColor.a);
  mGLContext->fClear(clearBits);
This looks pretty similar to the sailfish-browser code, apart from the fact that the colour looks configurable. Moreover, checking with the debugger shows that this method, and the fClear() call within it, are definitely being called.I've added some changes to the ESR 91 codebase to set the colour to dark blue again, in the hope this will have an impact on the output. When I step through the code, I can see that the colour value is getting set to blue. But I can't see this having any consequence on what's rendered to the screen.
(gdb) b CompositorOGL::BeginFrame
Breakpoint 1 at 0x7ff11a6970: file ${PROJECT}/gecko-dev/gfx/layers/opengl/
    CompositorOGL.cpp, line 9
83.
(gdb) c
Continuing.
[...]
Thread 37 "Compositor" hit Breakpoint 1, mozilla::layers::
    CompositorOGL::BeginFrame (this=0x7ed8002f10, aInvalidRegion=...,
    aClipRect=...,
    aRenderBounds=..., aOpaqueRegion=...)
    at ${PROJECT}/gecko-dev/gfx/layers/opengl/CompositorOGL.cpp:983
983     in ${PROJECT}/gecko-dev/gfx/layers/opengl/CompositorOGL.cpp
(gdb) c
Continuing.
[...]
1050    in ${PROJECT}/gecko-dev/gfx/layers/opengl/CompositorOGL.cpp
(gdb) p mClearColor
(gdb) p mClearColor
$1 = {r = 0, g = 0, b = 0, a = 0}
(gdb) n
2436    ${PROJECT}/obj-build-mer-qt-xr/dist/include/nsRegion.h: No such file or
    directory.
(gdb) n
[...]
1086    in ${PROJECT}/gecko-dev/gfx/layers/opengl/CompositorOGL.cpp
(gdb) n
1087    in ${PROJECT}/gecko-dev/gfx/layers/opengl/CompositorOGL.cpp
(gdb) p mClearColor
$2 = {r = 0, g = 0, b = 1, a = 0}
(gdb) p /x clearBits
$5 = 0x4100
(gdb) n
There could be one of two reasons for this: the first it could be that this code simply has no effect no rendering anyway. The second is that this is having no effect in ESR 91 specifically because the rendering pipeline is broken in some other way.To try to distinguish between the two I've attempted to run the WebView on ESR 78 and, although I don't want to have to go to the trouble of recompiling, I can poke in values for the colour to see whether they have any effect.
Here's the debug output from me changing the colour value on ESR 78 mid-execution using the debugger.
[Switching to Thread 0x7fa516f9a0 (LWP 32148)]

Thread 36 "Compositor" hit Breakpoint 1, mozilla::layers::
    CompositorOGL::BeginFrame (this=0x7eac003420, aInvalidRegion=...,
    aClipRect=...,
    aRenderBounds=..., aOpaqueRegion=...) at gfx/layers/opengl/
    CompositorOGL.cpp:967
967                                              const nsIntRegion&
    aOpaqueRegion) {
(gdb) p mClearColor
$1 = {r = 0, g = 0, b = 0, a = 0}
(gdb) n
(gdb) n
968       AUTO_PROFILER_LABEL("CompositorOGL::BeginFrame", GRAPHICS);
[...]
313     obj-build-mer-qt-xr/dist/include/mozilla/RefPtr.h: No such file or
    directory.
(gdb) n
1045      mGLContext->fClearColor(mClearColor.r, mClearColor.g, mClearColor.b,
(gdb) p mClearColor
$2 = {r = 0, g = 0, b = 0, a = 0}
(gdb) mClearColor.b = 1.0
Undefined command: "mClearColor".  Try "help".
(gdb) set mClearColor.b = 1.0
(gdb) p mClearColor
$3 = {r = 0, g = 0, b = 1, a = 0}
(gdb)
I'm surprised to discover that this also has no effect on ESR 78. I'm left wondering whether there might be some other part of the code that's clearing the background instead. I'm going to need to investigate this further. However, one other issue I'm experiencing is that the ESR 91 build has lost its debug source annotations. This is as a result of me having performed partial builds almost exclusively for the last week or so. Partial builds can result in the debug source and library packages getting out of sync, the only solution to which is to perform a full rebuild. So I've set a full rebuild off in the hope that it will help provide more clarity tomorrow.But that also means that there's no scope to do more partial building of the code today. Once the full rebuild has completed I'll return to this topic to see whether I can get any more concrete results.
In the meantime, if you'd like to read any of my other gecko diary entries, they're all available on my Gecko-dev Diary page.
31 Mar 2024 : Day 202 #
Recently I've been looking at the EGL mesa display. Yesterday I finished restoring patch 0038, which is designed to fix this part of the rendering pipeline. Today I want to try to understand a little better what's being executed and when, in the hope that this will clarify whether what's happening is happening correctly or not.
In fact, I know there's something not working because rendering is still failing, but my hope is to narrow down what is and isn't working. After all, to badly misquote an expert on the matter, when you have eliminated the impossible, whatever remains, however improbable, must be the source of the bug.
The interesting methods, by which I mean the methods I'm interested in, which are those I've been making changes to over the last couple of days, are the following:
To understand how these are getting called, I've placed breakpoints on all of them:
So executing the code with the debugger I can quickly find out which of these methods are called, in what order, and which are never called at all.
That flow is useful, but it's not the entire picture. I also want to know the call stacks for these method calls. Some of them are obvious because there's only one path for them to be called via. But others, including the calls to GetAppDisplay(), are less clear. This method in particular is called in many different places in the code. It'd be useful to know which paths are causing it to be triggered.
The easiest way to find this out is to get a copy of the backtrace when the breakpoint has been hit. I didn't do this first time round, but a second run through allows me to collect this info too.
Here's the (slightly abridged) backtrace for the first hit of GetAppDisplay()
If you'd like to read any of my other gecko diary entries, they're all available on my Gecko-dev Diary page.
Comment
In fact, I know there's something not working because rendering is still failing, but my hope is to narrow down what is and isn't working. After all, to badly misquote an expert on the matter, when you have eliminated the impossible, whatever remains, however improbable, must be the source of the bug.
The interesting methods, by which I mean the methods I'm interested in, which are those I've been making changes to over the last couple of days, are the following:
- GetAppDisplay()
- CreateEmulatorBufferSurface()
- WaylandGLSurface::WaylandGLSurface()
- GLLibraryEGL::Create()
- GLLibraryEGL::DefaultDisplay()
- GLLibraryEGL::CreateDisplay()
- GetAndInitDisplay()
To understand how these are getting called, I've placed breakpoints on all of them:
(gdb) b GetAppDisplay
Breakpoint 1 at 0x7ff1105918: file ${PROJECT}/gecko-dev/gfx/gl/
    GLContextProviderEGL.cpp, line 161.
(gdb) b CreateEmulatorBufferSurface
Breakpoint 2 at 0x7ff111d054: file ${PROJECT}/gecko-dev/gfx/gl/
    GLContextProviderEGL.cpp, line 980.
(gdb) b WaylandGLSurface::WaylandGLSurface
Breakpoint 3 at 0x7ff111d17c: file ${PROJECT}/gecko-dev/gfx/gl/
    GLContextProviderEGL.cpp, line 952.
(gdb) b GLLibraryEGL::Create
Breakpoint 4 at 0x7ff1118c50: file ${PROJECT}/gecko-dev/gfx/gl/
    GLLibraryEGL.cpp, line 343.
(gdb) b GLLibraryEGL::DefaultDisplay
Breakpoint 5 at 0x7ff111ce84: file ${PROJECT}/gecko-dev/gfx/gl/
    GLLibraryEGL.cpp, line 736.
(gdb) b GLLibraryEGL::CreateDisplay
Breakpoint 6 at 0x7ff111c8b8: file ${PROJECT}/gecko-dev/gfx/gl/
    GLLibraryEGL.cpp, line 747.
(gdb) b GetAndInitDisplay
Breakpoint 7 at 0x7ff111c82c: file ${PROJECT}/gecko-dev/gfx/gl/
    GLLibraryEGL.cpp, line 149.
(gdb) r
The program being debugged has been started already.
Start it from the beginning? (y or n) y
Starting program: /usr/bin/harbour-webview
[...]
You can probably tell that today is going to be another day of lengthy backtraces. It's true I'm afraid and I can only apologise in advance. As always, these backtraces make for very dull reading, but are important for my records. You won't lose anything by skipping them.So executing the code with the debugger I can quickly find out which of these methods are called, in what order, and which are never called at all.
Thread 36 "Compositor" hit Breakpoint 1, mozilla::gl::GetAppDisplay ()
    at ${PROJECT}/gecko-dev/gfx/gl/GLContextProviderEGL.cpp:161
161     ${PROJECT}/gecko-dev/gfx/gl/GLContextProviderEGL.cpp: No such file or
    directory.
(gdb) c
Continuing.

Thread 36 "Compositor" hit Breakpoint 1, mozilla::gl::GetAppDisplay ()
    at ${PROJECT}/gecko-dev/gfx/gl/GLContextProviderEGL.cpp:161
161     in ${PROJECT}/gecko-dev/gfx/gl/GLContextProviderEGL.cpp
(gdb) c
Continuing.

Thread 36 "Compositor" hit Breakpoint 4, mozilla::gl::GLLibraryEGL::
    Create (out_failureId=out_failureId@entry=0x7f1f7cb1c8, aDisplay=0x1)
    at ${PROJECT}/gecko-dev/gfx/gl/GLLibraryEGL.cpp:343
343     ${PROJECT}/gecko-dev/gfx/gl/GLLibraryEGL.cpp: No such file or directory.
(gdb) c
Continuing.

Thread 36 "Compositor" hit Breakpoint 5, mozilla::gl::GLLibraryEGL::
    DefaultDisplay (this=0x7edc003200,
    out_failureId=out_failureId@entry=0x7f1f7cb1c8,
    aDisplay=aDisplay@entry=0x1) at ${PROJECT}/gecko-dev/gfx/gl/
    GLLibraryEGL.cpp:736
736     in ${PROJECT}/gecko-dev/gfx/gl/GLLibraryEGL.cpp
(gdb) c
Continuing.

Thread 36 "Compositor" hit Breakpoint 6, mozilla::gl::GLLibraryEGL::
    CreateDisplay (this=this@entry=0x7edc003200,
    forceAccel=forceAccel@entry=false,
    out_failureId=out_failureId@entry=0x7f1f7cb1c8, aDisplay=aDisplay@entry=0x1)
    at ${PROJECT}/gecko-dev/gfx/gl/GLLibraryEGL.cpp:747
747     in ${PROJECT}/gecko-dev/gfx/gl/GLLibraryEGL.cpp
(gdb) c
Continuing.

Thread 36 "Compositor" hit Breakpoint 7, mozilla::gl::
    GetAndInitDisplay (egl=..., displayType=displayType@entry=0x0,
    display=display@entry=0x1)
    at ${PROJECT}/gecko-dev/gfx/gl/GLLibraryEGL.cpp:149
149     in ${PROJECT}/gecko-dev/gfx/gl/GLLibraryEGL.cpp
(gdb) c
Continuing.
[New Thread 0x7f1f4fa7e0 (LWP 2850)]
=============== Preparing offscreen rendering context ===============
This looks pretty healthy to be honest. After this point, none of the methods are called, so everything is happening during initialisation, which I was hoping would be the case. So far so good.That flow is useful, but it's not the entire picture. I also want to know the call stacks for these method calls. Some of them are obvious because there's only one path for them to be called via. But others, including the calls to GetAppDisplay(), are less clear. This method in particular is called in many different places in the code. It'd be useful to know which paths are causing it to be triggered.
The easiest way to find this out is to get a copy of the backtrace when the breakpoint has been hit. I didn't do this first time round, but a second run through allows me to collect this info too.
Here's the (slightly abridged) backtrace for the first hit of GetAppDisplay()
Thread 38 "Compositor" hit Breakpoint 1, mozilla::gl::GetAppDisplay ()
    at ${PROJECT}/gecko-dev/gfx/gl/GLContextProviderEGL.cpp:161
161     ${PROJECT}/gecko-dev/gfx/gl/GLContextProviderEGL.cpp: No such file or
    directory.
(gdb) bt
#0  mozilla::gl::GetAppDisplay () at ${PROJECT}/gecko-dev/gfx/gl/
    GLContextProviderEGL.cpp:161
#1  0x0000007ff112e684 in mozilla::gl::GLContextProviderEGL::CreateHeadless (
    desc=..., out_failureId=out_failureId@entry=0x7f1f96f1c8)
    at ${PROJECT}/gecko-dev/gfx/gl/GLContextProviderEGL.cpp:1434
#2  0x0000007ff112efd4 in mozilla::gl::GLContextProviderEGL::CreateOffscreen (
    size=..., minCaps=...,
    flags=flags@entry=mozilla::gl::CreateContextFlags::REQUIRE_COMPAT_PROFILE,
    out_failureId=out_failureId@entry=0x7f1f96f1c8)
    at ${PROJECT}/gecko-dev/gfx/gl/GLContextProviderEGL.cpp:1476
#3  0x0000007ff1197b04 in mozilla::layers::CompositorOGL::CreateContext (
    this=this@entry=0x7edc002f10)
    at ${PROJECT}/gecko-dev/gfx/layers/opengl/CompositorOGL.cpp:254
#4  0x0000007ff11ad0f4 in mozilla::layers::CompositorOGL::Initialize (
    this=0x7edc002f10, out_failureReason=0x7f1f96f520)
    at ${PROJECT}/gecko-dev/gfx/layers/opengl/CompositorOGL.cpp:391
#5  0x0000007ff12c2d90 in mozilla::layers::CompositorBridgeParent::
    NewCompositor (this=this@entry=0x7fc4b7b7d0, aBackendHints=...)
    at ${PROJECT}/gecko-dev/gfx/layers/ipc/CompositorBridgeParent.cpp:1493
#6  0x0000007ff12cde0c in mozilla::layers::CompositorBridgeParent::
    InitializeLayerManager (this=this@entry=0x7fc4b7b7d0, aBackendHints=...)
    at ${PROJECT}/gecko-dev/gfx/layers/ipc/CompositorBridgeParent.cpp:1436
#7  0x0000007ff12cdf3c in mozilla::layers::CompositorBridgeParent::
    AllocPLayerTransactionParent (this=this@entry=0x7fc4b7b7d0,
    aBackendHints=..., aId=...)
    at ${PROJECT}/gecko-dev/gfx/layers/ipc/CompositorBridgeParent.cpp:1546
#8  0x0000007ff36649c8 in mozilla::embedlite::EmbedLiteCompositorBridgeParent::
    AllocPLayerTransactionParent (this=0x7fc4b7b7d0, aBackendHints=...,
    aId=...)
    at ${PROJECT}/gecko-dev/mobile/sailfishos/embedthread/
    EmbedLiteCompositorBridgeParent.cpp:80
#9  0x0000007ff0c5c3ac in mozilla::layers::PCompositorBridgeParent::
    OnMessageReceived (this=0x7fc4b7b7d0, msg__=...) at
    PCompositorBridgeParent.cpp:1285
#10 0x0000007ff0ca08c0 in mozilla::layers::PCompositorManagerParent::
    OnMessageReceived (this=<optimized out>, msg__=...)
    at ${PROJECT}/obj-build-mer-qt-xr/dist/include/mozilla/ipc/ProtocolUtils.h:
    675
[...]
#24 0x0000007ff6a0289c in thread_start () at ../sysdeps/unix/sysv/linux/aarch64/
    clone.S:78
(gdb)
The above backtrace shows that the call to GetAppDisplay() is being triggered from GLContextProviderEGL::CreateHeadless(). There it's being called directly. But interestingly, later in the same CreateHeadless() it gets called again, this time indirectly via DefaultEglDisplay() and then DefaultEglLibrary (despite the similar names those are very different methods; I find I need to focus hard on this stuff to properly distinguish). Here's the (again, slightly abridged) backtrace for this second call to GetAppDisplay().
Thread 38 "Compositor" hit Breakpoint 1, mozilla::gl::GetAppDisplay ()
    at ${PROJECT}/gecko-dev/gfx/gl/GLContextProviderEGL.cpp:161
161     in ${PROJECT}/gecko-dev/gfx/gl/GLContextProviderEGL.cpp
(gdb) bt
#0  mozilla::gl::GetAppDisplay () at ${PROJECT}/gecko-dev/gfx/gl/
    GLContextProviderEGL.cpp:161
#1  0x0000007ff1118e40 in mozilla::gl::DefaultEglLibrary (
    out_failureId=out_failureId@entry=0x7f1f96f1c8)
    at ${PROJECT}/gecko-dev/gfx/gl/GLContextProviderEGL.cpp:1519
#2  0x0000007ff112e694 in mozilla::gl::DefaultEglDisplay (aDisplay=0x1,
    out_failureId=0x7f1f96f1c8)
    at ${PROJECT}/gecko-dev/gfx/gl/GLContextEGL.h:29
#3  mozilla::gl::GLContextProviderEGL::CreateHeadless (desc=...,
    out_failureId=out_failureId@entry=0x7f1f96f1c8)
    at ${PROJECT}/gecko-dev/gfx/gl/GLContextProviderEGL.cpp:1434
#4  0x0000007ff112efd4 in mozilla::gl::GLContextProviderEGL::CreateOffscreen (
    size=..., minCaps=...,
    flags=flags@entry=mozilla::gl::CreateContextFlags::REQUIRE_COMPAT_PROFILE,
    out_failureId=out_failureId@entry=0x7f1f96f1c8)
    at ${PROJECT}/gecko-dev/gfx/gl/GLContextProviderEGL.cpp:1476
#5  0x0000007ff1197b04 in mozilla::layers::CompositorOGL::CreateContext (
    this=this@entry=0x7edc002f10)
    at ${PROJECT}/gecko-dev/gfx/layers/opengl/CompositorOGL.cpp:254
#6  0x0000007ff11ad0f4 in mozilla::layers::CompositorOGL::Initialize (
    this=0x7edc002f10, out_failureReason=0x7f1f96f520)
    at ${PROJECT}/gecko-dev/gfx/layers/opengl/CompositorOGL.cpp:391
#7  0x0000007ff12c2d90 in mozilla::layers::CompositorBridgeParent::
    NewCompositor (this=this@entry=0x7fc4b7b7d0, aBackendHints=...)
    at ${PROJECT}/gecko-dev/gfx/layers/ipc/CompositorBridgeParent.cpp:1493
#8  0x0000007ff12cde0c in mozilla::layers::CompositorBridgeParent::
    InitializeLayerManager (this=this@entry=0x7fc4b7b7d0, aBackendHints=...)
    at ${PROJECT}/gecko-dev/gfx/layers/ipc/CompositorBridgeParent.cpp:1436
#9  0x0000007ff12cdf3c in mozilla::layers::CompositorBridgeParent::
    AllocPLayerTransactionParent (this=this@entry=0x7fc4b7b7d0,
    aBackendHints=..., aId=...)
    at ${PROJECT}/gecko-dev/gfx/layers/ipc/CompositorBridgeParent.cpp:1546
#10 0x0000007ff36649c8 in mozilla::embedlite::EmbedLiteCompositorBridgeParent::
    AllocPLayerTransactionParent (this=0x7fc4b7b7d0, aBackendHints=...,
    aId=...)
    at ${PROJECT}/gecko-dev/mobile/sailfishos/embedthread/
    EmbedLiteCompositorBridgeParent.cpp:80
#11 0x0000007ff0c5c3ac in mozilla::layers::PCompositorBridgeParent::
    OnMessageReceived (this=0x7fc4b7b7d0, msg__=...) at
    PCompositorBridgeParent.cpp:1285
[...]
#26 0x0000007ff6a0289c in thread_start () at ../sysdeps/unix/sysv/linux/aarch64/
    clone.S:78
(gdb)
From here I think it starts getting less interesting (I'm pretending it ever was!), but for completeness, here's the backtrace for GLLibraryEGL::Create():
Thread 38 "Compositor" hit Breakpoint 4, mozilla::gl::GLLibraryEGL::
    Create (out_failureId=out_failureId@entry=0x7f1f96f1c8, aDisplay=0x1)
    at ${PROJECT}/gecko-dev/gfx/gl/GLLibraryEGL.cpp:343
343     ${PROJECT}/gecko-dev/gfx/gl/GLLibraryEGL.cpp: No such file or directory.
(gdb) bt
#0  mozilla::gl::GLLibraryEGL::Create (
    out_failureId=out_failureId@entry=0x7f1f96f1c8, aDisplay=0x1)
    at ${PROJECT}/gecko-dev/gfx/gl/GLLibraryEGL.cpp:343
#1  0x0000007ff1118e50 in mozilla::gl::DefaultEglLibrary (
    out_failureId=out_failureId@entry=0x7f1f96f1c8)
    at ${PROJECT}/gecko-dev/gfx/gl/GLContextProviderEGL.cpp:1519
#2  0x0000007ff112e694 in mozilla::gl::DefaultEglDisplay (aDisplay=0x1,
    out_failureId=0x7f1f96f1c8)
    at ${PROJECT}/gecko-dev/gfx/gl/GLContextEGL.h:29
#3  mozilla::gl::GLContextProviderEGL::CreateHeadless (desc=...,
    out_failureId=out_failureId@entry=0x7f1f96f1c8)
    at ${PROJECT}/gecko-dev/gfx/gl/GLContextProviderEGL.cpp:1434
#4  0x0000007ff112efd4 in mozilla::gl::GLContextProviderEGL::CreateOffscreen (
    size=..., minCaps=...,
    flags=flags@entry=mozilla::gl::CreateContextFlags::REQUIRE_COMPAT_PROFILE,
    out_failureId=out_failureId@entry=0x7f1f96f1c8)
    at ${PROJECT}/gecko-dev/gfx/gl/GLContextProviderEGL.cpp:1476
#5  0x0000007ff1197b04 in mozilla::layers::CompositorOGL::CreateContext (
    this=this@entry=0x7edc002f10)
    at ${PROJECT}/gecko-dev/gfx/layers/opengl/CompositorOGL.cpp:254
#6  0x0000007ff11ad0f4 in mozilla::layers::CompositorOGL::Initialize (
    this=0x7edc002f10, out_failureReason=0x7f1f96f520)
    at ${PROJECT}/gecko-dev/gfx/layers/opengl/CompositorOGL.cpp:391
#7  0x0000007ff12c2d90 in mozilla::layers::CompositorBridgeParent::
    NewCompositor (this=this@entry=0x7fc4b7b7d0, aBackendHints=...)
    at ${PROJECT}/gecko-dev/gfx/layers/ipc/CompositorBridgeParent.cpp:1493
#8  0x0000007ff12cde0c in mozilla::layers::CompositorBridgeParent::
    InitializeLayerManager (this=this@entry=0x7fc4b7b7d0, aBackendHints=...)
    at ${PROJECT}/gecko-dev/gfx/layers/ipc/CompositorBridgeParent.cpp:1436
#9  0x0000007ff12cdf3c in mozilla::layers::CompositorBridgeParent::
    AllocPLayerTransactionParent (this=this@entry=0x7fc4b7b7d0,
    aBackendHints=..., aId=...)
    at ${PROJECT}/gecko-dev/gfx/layers/ipc/CompositorBridgeParent.cpp:1546
#10 0x0000007ff36649c8 in mozilla::embedlite::EmbedLiteCompositorBridgeParent::
    AllocPLayerTransactionParent (this=0x7fc4b7b7d0, aBackendHints=...,
    aId=...)
    at ${PROJECT}/gecko-dev/mobile/sailfishos/embedthread/
    EmbedLiteCompositorBridgeParent.cpp:80
#11 0x0000007ff0c5c3ac in mozilla::layers::PCompositorBridgeParent::
    OnMessageReceived (this=0x7fc4b7b7d0, msg__=...) at
    PCompositorBridgeParent.cpp:1285
[...]
#26 0x0000007ff6a0289c in thread_start () at ../sysdeps/unix/sysv/linux/aarch64/
    clone.S:78
(gdb)
I won't give the backtraces for the others because their location is already pretty fixed in the code. But on checking all of the values passed in to these and the other methods it's clear that the value for mDisplay is consistently set to 1 in all cases:
(gdb) p aDisplay
$1 = (EGLDisplay) 0x1
(gdb)
That should be a good thing, but this doesn't mean everything is fixed and there's a nagging feeling in the back of my mind. I'll go through the flow and backtraces properly tomorrow, but that's it for today.
If you'd like to read any of my other gecko diary entries, they're all available on my Gecko-dev Diary page.
30 Mar 2024 : Day 201 #
Yesterday I restored (manually, because the underlying code has changed so much) patch 0038 back into the codebase. But it doesn't yet quite compile. There are a few sticking point errors that need to be resolved. The first I'm working on looks like this:
The choice of parameters turns out to be relatively straightforward. The out_failureId error string that's actually an output rather than an input is just a pointer which gets pointed at a string literal if something goes wrong. But I'm ignoring errors anyway at this point, so I can just pass in a dummy variable. The aDisplay input value should be set to the result of GetAppDisplay() since this is the whole point of the changes that were introduced in ESR 78 to support the emulator and native devices.
After these changes the code now looks like this:
The third error is more unexpected and looks like this:
Okay, I'll be honest, I'm not really sure what's going on here. More importantly the diff has examples of how this has been changed in other places and which match pretty closely to the situation I'm trying to solve. So I've copied those snippets of code and refactored them for the ESR 91 code. The result is that I've changed the following piece of code:
Having made these changes I'm pleased to discover that the code now compiles fully. I'm able to kick off the partial build and watch it generate the libxul.so file that we need. Having copied over and installed that file, when running the app I discover that... nothing overt has changed.
That's too bad. But what would be interesting to see now is what the actual values for the display are. I'll look in to that tomorrow.
As always if you'd like to read any of my other gecko diary entries, they're all available on my Gecko-dev Diary page.
Comment
In file included from Unified_cpp_gfx_gl0.cpp:47:
${PROJECT}/gecko-dev/gfx/gl/GLContextProviderEGL.cpp: In function ‘void*
    mozilla::gl::CreateEmulatorBufferSurface(mozilla::gl::GLLibraryEGL*,
    EGLConfig, mozilla::gfx::IntSize&)’:
${PROJECT}/gecko-dev/gfx/gl/GLContextProviderEGL.cpp:991:55: error: ‘class
    mozilla::gl::GLLibraryEGL’ has no member named ‘Display’; did you mean
    ‘fGetDisplay’?
   EGLSurface surface = egl->fCreateWindowSurface(egl->Display(), config,
    eglwindow, 0);                                           ^~~~~~~
                                                             fGetDisplay
This is code I copied over from ESR 78. The problem here is that egl->Display() no longer exists in ESR 91, for reasons we've already discussed, but most notably because there is no longer one single display in operation: there could be multiple. In ESR 78 the EGLLibrary::Display() method looked like this:
  EGLDisplay Display() const {
    MOZ_ASSERT(mInitialized);
    return mEGLDisplay;
  }
As you can see it just returns an mEGLDisplay value — the single canonical display for the application — every time. On ESR 91 this method has been removed entirely. It took me a while to decide which alternative method was the best match, but eventually I settled on this one:
  std::shared_ptr<EglDisplay> DefaultDisplay(nsACString* const out_failureId,
    EGLDisplay aDisplay);
The difficulty, as you can see, is that while the former required no parameters, the latter has acquired two new parameters. I have to be honest that I'm a bit uncomfortable with a method that takes in an EGLDisplay in order to return an EglDisplay: it should really be the other way around. But I'm going with the flow on this.The choice of parameters turns out to be relatively straightforward. The out_failureId error string that's actually an output rather than an input is just a pointer which gets pointed at a string literal if something goes wrong. But I'm ignoring errors anyway at this point, so I can just pass in a dummy variable. The aDisplay input value should be set to the result of GetAppDisplay() since this is the whole point of the changes that were introduced in ESR 78 to support the emulator and native devices.
After these changes the code now looks like this:
  EGLSurface surface = egl->fCreateWindowSurface(egl->DefaultDisplay(
    out_failureId, GetAppDisplay())->mDisplay, config, eglwindow, 0);
This line now compiles, so time to move on to the second error, which looks like this:
In file included from Unified_cpp_gfx_gl0.cpp:2:
${PROJECT}/gecko-dev/gfx/gl/AndroidSurfaceTexture.cpp: In static member
    function ‘static already_AddRefed<mozilla::gl::GLContextEGL> mozilla::gl::
    AndroidSharedBlitGL::CreateContextImpl(bool)’:
${PROJECT}/gecko-dev/gfx/gl/AndroidSurfaceTexture.cpp:78:52: error: too few
    arguments to function  std::shared_ptr<mozilla::gl::EglDisplay> mozilla::gl:
    :DefaultEglDisplay(nsACString*, EGLDisplay)’
     const auto egl = gl::DefaultEglDisplay(&ignored);
                                                    ^
In file included from ${PROJECT}/gecko-dev/gfx/gl/AndroidSurfaceTexture.cpp:9,
                 from Unified_cpp_gfx_gl0.cpp:2:
${PROJECT}/gecko-dev/gfx/gl/GLContextEGL.h:27:36: note: declared here
 inline std::shared_ptr<EglDisplay> DefaultEglDisplay(
                                    ^~~~~~~~~~~~~~~~~
There's a similar thing going on here, in that there should be an input parameter. But this is a little different because of where the code lives. It's being compiled in as part of the AndroidSurfaceTexture.cpp file. I'm wondering why this file is getting included at all, given the name seems to suggest it's rather Android focused. Nevertheless I've fixed this particular error by passing in EGL_DISPLAY_NONE as the parameter. To be honest I'm hoping this code never actually gets called so that the input value is somewhat irrelevant. Based on this assumption, this change should do the trick.The third error is more unexpected and looks like this:
In file included from Unified_cpp_gfx_gl0.cpp:47:
${PROJECT}/gecko-dev/gfx/gl/GLContextProviderEGL.cpp: In function ‘void*
    mozilla::gl::CreateEmulatorBufferSurface(mozilla::gl::GLLibraryEGL*,
    EGLConfig, mozilla::gfx::IntSize&)’:
${PROJECT}/gecko-dev/gfx/gl/GLContextProviderEGL.cpp:996:36: error:
    ‘nsTHashMap<nsPtrHashKey<void>, mozilla::gl::WaylandGLSurface*>’ {aka
    ‘class nsBaseHashtable<nsPtrHashKey<void>, mozilla::gl::WaylandGLSurface*,
    mozilla::gl::WaylandGLSurface*, nsDefaultConverter<mozilla::gl::
    WaylandGLSurface*, mozilla::gl::WaylandGLSurface*> >’} has no member named
    ‘LookupForAdd’; did you mean ‘LookupResult’?
     auto entry = sWaylandGLSurface.LookupForAdd(surface);
                                    ^~~~~~~~~~~~
                                    LookupResult
On the face of it it's unclear to me what's going wrong and how this should be fixed, but a dig through the git history shows that this error has been caused by change D104216 which relates to Bugzilla bug 1688833. The bug description has this to say:After bug 1681469, there will be two APIs for LookupForAdd (WithEntryHandle). The new one is based on nsTHashtable::WithEntryHandle which is based on PLDHashTable::WithEntryHandle. The new API isn't currently public, since there are still some open questions which need to be addressed.
Okay, I'll be honest, I'm not really sure what's going on here. More importantly the diff has examples of how this has been changed in other places and which match pretty closely to the situation I'm trying to solve. So I've copied those snippets of code and refactored them for the ESR 91 code. The result is that I've changed the following piece of code:
  if (surface) {
    WaylandGLSurface* waylandData = new WaylandGLSurface(wlsurface, eglwindow);
    auto entry = sWaylandGLSurface.LookupForAdd(surface);
    entry.OrInsert([&waylandData]() { return waylandData; });
  }
So that it now looks like this:
  if (surface) {
    WaylandGLSurface* waylandData = new WaylandGLSurface(wlsurface, eglwindow);
    sWaylandGLSurface.WithEntryHandle(surface, [&](auto&& entry) {
      entry.OrInsert(waylandData);
    })
  }
Does that look sensible? Well, it compiles and it's consistent with how the change was made in other parts of the code; and right now that's good enough for me.Having made these changes I'm pleased to discover that the code now compiles fully. I'm able to kick off the partial build and watch it generate the libxul.so file that we need. Having copied over and installed that file, when running the app I discover that... nothing overt has changed.
That's too bad. But what would be interesting to see now is what the actual values for the display are. I'll look in to that tomorrow.
As always if you'd like to read any of my other gecko diary entries, they're all available on my Gecko-dev Diary page.
30 Mar 2024 : Day 200 #
I thought I'd already had a go at applying patch 0038 "Fix mesa egl display and buffer initialisation" on Day 55. Looking back at my notes, I did try, but probably not hard enough. The patch failed to stick in many places and now I'm looking at the code it seems there are some really large gaps.
Trying to make a better job of it this time around I've been working my way carefully through the entire patch. I've manually applied all of the changes. As I mentioned yesterday, the patch contains a lot of material important for keeping Sailfish Browser working.
Now when I attempt to build the gecko library I start getting errors in far flung places in the code due to the way the API is accessed. The output below is typical of the errors I'm getting.
An obvious fix would be to make the parameter optional. But these errors do serve a purpose in exposing when things have changed, so it's convenient not to make it optional just yet. Maybe once everything is working I can return to this and add it as an optional parameter for the purposes of simplifying the code and reducing the size of the patches. But for now the added protection of knowing exactly when and where the calls are made is convenient.
I've not yet got through all of the changes so I'll have to continue tomorrow. I feel like I've been making quite good progress though. I just need to get the last pieces compiling.
As an aside, I finally got to watch Peter Mack's (1peter10's) FOSDEM'24 talk on The Linux Phone App Ecosystem. I've been meaning to watch it from before the event and really enjoyed it, especially the way it straddled so many different Linux-based mobile operating systems. If you've not watched it yet yourself I highly recommend it.
I'm hoping to get that completed and compiling tomorrow. In the meantime if you'd like to read any of my other gecko diary entries, they're all available on my Gecko-dev Diary page.
Comment
Trying to make a better job of it this time around I've been working my way carefully through the entire patch. I've manually applied all of the changes. As I mentioned yesterday, the patch contains a lot of material important for keeping Sailfish Browser working.
Now when I attempt to build the gecko library I start getting errors in far flung places in the code due to the way the API is accessed. The output below is typical of the errors I'm getting.
${PROJECT}/gecko-dev/gfx/gl/AndroidSurfaceTexture.cpp: In static member
    function ‘static already_AddRefed<mozilla::gl::GLContextEGL> mozilla::gl::
    AndroidSharedBlitGL::CreateContextImpl(bool)’:
${PROJECT}/gecko-dev/gfx/gl/AndroidSurfaceTexture.cpp:78:52: error: too few
    arguments to function  std::shared_ptr<mozilla::gl::EglDisplay> mozilla::gl:
    :DefaultEglDisplay(nsACString*, EGLDisplay)’
     const auto egl = gl::DefaultEglDisplay(&ignored);
                                                    ^
The reason for this error is clear: I changed some of the method signatures to include a display parameter. And while I've tried to update the code so that it's called correctly in all of the obvious places, it turns out there are some less obvious places too. In practice it looks to me like these are Android-specific, but if the compiler is going over them they'll need to be fixed.An obvious fix would be to make the parameter optional. But these errors do serve a purpose in exposing when things have changed, so it's convenient not to make it optional just yet. Maybe once everything is working I can return to this and add it as an optional parameter for the purposes of simplifying the code and reducing the size of the patches. But for now the added protection of knowing exactly when and where the calls are made is convenient.
I've not yet got through all of the changes so I'll have to continue tomorrow. I feel like I've been making quite good progress though. I just need to get the last pieces compiling.
As an aside, I finally got to watch Peter Mack's (1peter10's) FOSDEM'24 talk on The Linux Phone App Ecosystem. I've been meaning to watch it from before the event and really enjoyed it, especially the way it straddled so many different Linux-based mobile operating systems. If you've not watched it yet yourself I highly recommend it.
I'm hoping to get that completed and compiling tomorrow. In the meantime if you'd like to read any of my other gecko diary entries, they're all available on my Gecko-dev Diary page.
28 Mar 2024 : Day 199 #
Adam Pigg (piggz, who you'll know from his daily Ofono blog amongst other Sailfish-related things, asked a good question on Mastodon yesterday. "How" Adam asks "was the texture deletion missed? Was it present in 71?" This is in relation to how I ended up solving the app seizure problem. With apologies to those who have been following along and already know, but to recap, the problem turned out to be that an EGL texture was being created for each SharedSurface_EGLImage, but then in the destructor there was no code to delete the texture.
It's a classic resource leakage problem and one you might rightly ask (and that's exactly what Adam did) how such an obvious failure could have snuck through.
The answer is that the code to delete the texture was in ESR 78 but was removed from ESR 91. That sounds strange until you also realise that the code to create the texture was removed as well. A whole raft of changes were made as a result of changeset D75055 and the changes specifically to the SharedSurfaceEGL.cpp file involved stripping out the EGL code that the WebView relies on. When attempting to reintroduce this code back I returned the texture creation code but somehow missed the texture deletion code.
And that's the challenge of where I'm at with the WebView rendering changes now. It's all down to whether I've successfully reversed these changes or not. I know it can work because it works with ESR 78. But getting all of the pieces to balance together is turning out to be a bit of a challenge. It's just a matter of time before everything fits in the right way, but it is, I'm afraid, taking a lot of time.
So thanks Adam for asking the question. It's good to reflect on these things and hopefully in my case learn how to avoid similar problems happening in future. Now on to the work of finding and fixing the other issues.
So today I've been looking through the diffs I mentioned yesterday, but admittedly without making a huge amount of progress. The one thing I've discovered, that I think may be important, is that there's a difference in the way the display is being configured between ESR 78 and ESR 91.
On ESR 78 the display is collected via a call to GetAppDisplay(). This function can be found in GLContextProviderEGL.cpp and looks like this:
The initialisation process has been changed in ESR 91. But there's still a similar process that happens when the library is initialised, the difference being that currently EGL_NO_DISPLAY is passed into the method instead.
Eventually this gets passed on to the CreateDisplay() method, which is where we need the correct value to be. Using the debugger I've checked exactly how this gets called on ESR 91. It's clear from this that the display isn't being set up as it should be.
So it's just a short one today, but rest assured I'll be writing more about all this tomorrow.
Before finishing up, I also just want to reiterate my commitment to base-2 milestones. The fact I'll be hitting a day that just happens to be represented neatly in base 10 is of no interest to me and I won't be making a big deal out of it.
If you'd like to read any of my other gecko diary entries, they're all available on my Gecko-dev Diary page.
Comment
It's a classic resource leakage problem and one you might rightly ask (and that's exactly what Adam did) how such an obvious failure could have snuck through.
The answer is that the code to delete the texture was in ESR 78 but was removed from ESR 91. That sounds strange until you also realise that the code to create the texture was removed as well. A whole raft of changes were made as a result of changeset D75055 and the changes specifically to the SharedSurfaceEGL.cpp file involved stripping out the EGL code that the WebView relies on. When attempting to reintroduce this code back I returned the texture creation code but somehow missed the texture deletion code.
And that's the challenge of where I'm at with the WebView rendering changes now. It's all down to whether I've successfully reversed these changes or not. I know it can work because it works with ESR 78. But getting all of the pieces to balance together is turning out to be a bit of a challenge. It's just a matter of time before everything fits in the right way, but it is, I'm afraid, taking a lot of time.
So thanks Adam for asking the question. It's good to reflect on these things and hopefully in my case learn how to avoid similar problems happening in future. Now on to the work of finding and fixing the other issues.
So today I've been looking through the diffs I mentioned yesterday, but admittedly without making a huge amount of progress. The one thing I've discovered, that I think may be important, is that there's a difference in the way the display is being configured between ESR 78 and ESR 91.
On ESR 78 the display is collected via a call to GetAppDisplay(). This function can be found in GLContextProviderEGL.cpp and looks like this:
// Use the main app's EGLDisplay to avoid creating multiple Wayland connections
// See JB#56215
static EGLDisplay GetAppDisplay() {
#ifdef MOZ_WIDGET_QT
  QPlatformNativeInterface* interface = QGuiApplication::
    platformNativeInterface();
  MOZ_ASSERT(interface);
  return (EGLDisplay)(interface->nativeResourceForIntegration(QByteArrayLiteral(
    "egldisplay")));
#else
  return EGL_NO_DISPLAY;
#endif
}
In our case we have MOZ_WIDGET_QT defined, so it's the first half of the ifdef that's getting compiled. This gets passed in to the GLLibraryEGL::EnsureInitialized() method when the library is initialised.The initialisation process has been changed in ESR 91. But there's still a similar process that happens when the library is initialised, the difference being that currently EGL_NO_DISPLAY is passed into the method instead.
Eventually this gets passed on to the CreateDisplay() method, which is where we need the correct value to be. Using the debugger I've checked exactly how this gets called on ESR 91. It's clear from this that the display isn't being set up as it should be.
(gdb) b GLLibraryEGL::CreateDisplay
Function "GLLibraryEGL::CreateDisplay" not defined.
Make breakpoint pending on future shared library load? (y or [n]) y
Breakpoint 1 (GLLibraryEGL::CreateDisplay) pending.
(gdb) r
[...]
Thread 37 "Compositor" hit Breakpoint 1, mozilla::gl::GLLibraryEGL::
    CreateDisplay (this=this@entry=0x7ed8003200,
    forceAccel=forceAccel@entry=false,
    out_failureId=out_failureId@entry=0x7f176081c8, aDisplay=aDisplay@entry=0x0)
    at ${PROJECT}/gecko-dev/gfx/gl/GLLibraryEGL.cpp:747
747     ${PROJECT}/gecko-dev/gfx/gl/GLLibraryEGL.cpp: No such file or directory.
(gdb) bt
#0  mozilla::gl::GLLibraryEGL::CreateDisplay (this=this@entry=0x7ed8003200,
    forceAccel=forceAccel@entry=false,
    out_failureId=out_failureId@entry=0x7f176081c8, aDisplay=aDisplay@entry=0x0)
    at ${PROJECT}/gecko-dev/gfx/gl/GLLibraryEGL.cpp:747
#1  0x0000007ff111d850 in mozilla::gl::GLLibraryEGL::DefaultDisplay (
    this=0x7ed8003200, out_failureId=out_failureId@entry=0x7f176081c8)
    at ${PROJECT}/gecko-dev/gfx/gl/GLLibraryEGL.cpp:740
#2  0x0000007ff112ef28 in mozilla::gl::DefaultEglDisplay (
    out_failureId=0x7f176081c8)
    at ${PROJECT}/gecko-dev/gfx/gl/GLContextEGL.h:33
#3  mozilla::gl::GLContextProviderEGL::CreateHeadless (desc=...,
    out_failureId=out_failureId@entry=0x7f176081c8)
    at ${PROJECT}/gecko-dev/gfx/gl/GLContextProviderEGL.cpp:1246
#4  0x0000007ff112f804 in mozilla::gl::GLContextProviderEGL::CreateOffscreen (
    size=..., minCaps=...,
    flags=flags@entry=mozilla::gl::CreateContextFlags::REQUIRE_COMPAT_PROFILE,
    out_failureId=out_failureId@entry=0x7f176081c8)
    at ${PROJECT}/gecko-dev/gfx/gl/GLContextProviderEGL.cpp:1288
#5  0x0000007ff11982f8 in mozilla::layers::CompositorOGL::CreateContext (
    this=this@entry=0x7ed8002f10)
    at ${PROJECT}/gecko-dev/gfx/layers/opengl/CompositorOGL.cpp:254
#6  0x0000007ff11ad8e8 in mozilla::layers::CompositorOGL::Initialize (
    this=0x7ed8002f10, out_failureReason=0x7f17608520)
    at ${PROJECT}/gecko-dev/gfx/layers/opengl/CompositorOGL.cpp:391
#7  0x0000007ff12c3584 in mozilla::layers::CompositorBridgeParent::
    NewCompositor (this=this@entry=0x7fc46c2070, aBackendHints=...)
    at ${PROJECT}/gecko-dev/gfx/layers/ipc/CompositorBridgeParent.cpp:1493
#8  0x0000007ff12ce600 in mozilla::layers::CompositorBridgeParent::
    InitializeLayerManager (this=this@entry=0x7fc46c2070, aBackendHints=...)
    at ${PROJECT}/gecko-dev/gfx/layers/ipc/CompositorBridgeParent.cpp:1436
[...]
#26 0x0000007ff6a0289c in thread_start () at ../sysdeps/unix/sysv/linux/aarch64/
    clone.S:78
(gdb)
Besides this investigation I've also started making changes to try to fix the code, but this is still very much a work-in-progress. Hopefully tomorrow I'll have something more concrete to show for my efforts.So it's just a short one today, but rest assured I'll be writing more about all this tomorrow.
Before finishing up, I also just want to reiterate my commitment to base-2 milestones. The fact I'll be hitting a day that just happens to be represented neatly in base 10 is of no interest to me and I won't be making a big deal out of it.
If you'd like to read any of my other gecko diary entries, they're all available on my Gecko-dev Diary page.
27 Mar 2024 : Day 198 #
I'm looking forward to getting back to a more balanced cadence with gecko development. It's been frustrating to be stuck on app seizing for the last couple of weeks, now that it's out of the way it'll be nice to focus on other parts of the code. But I'm not going to be wandering too far afield as I continue to try to get the WebView render pipeline working.
What's become clear is that the front and back buffer are being successfully created (and now destroyed!). So now there are two other potential places where the rendering could be failing. It could be that the paint from the Web pages is failing to get on the texture. Or it could be that the paint from the texture is failing to get on the screen.
I'd like to devise ways to test both of those things, but before I do that I want to first check another area that's ripe for failure in my opinion, and that's the setting of the display value. The EGL library uses an EGLDisplay object to control where rendering happens. Although it's part of the Khronos EGL specification, the official documentation is frustratingly vague about what an EGLDisplay actually is. Thankfully the PowerVR documentation has a note that summarises it quite clearly.
The shift from ESR 78 to ESR 91 brought with it a more flexible handling of displays. In particular, while ESR 78 had just a single instance of a display, ESR 91 allows multiple displays to be configured. What the practical benefit of this is I'm not entirely certain of, but handling of EGLDisplay storage has become more complex as a result.
So whereas previously gecko had a single mDisplay value that got used everywhere, the EGLDisplay is now wrapped in a gecko-specific EglDisplay class, defined in GLLibraryEGL.h. This class captures a collection of functionalities, one of which is to store an EGLDisplay value. There can be multiple instances of EglDisplay live at any one time.
The subtle distinction in the capitalisation — EGLDisplay vs. EglDisplay — is critical. The former belongs to EGL whereas the latter belongs to gecko. The fact they're so similar and that the shift from ESR 78 to ESR 91 has resulted in a switch from one to the other in many parts of the code, makes things all the more confusing.
There's plenty of opportunity for errors here. So I'm thinking: this is something to check.
An obvious place to start these checks is with display initialisation. A quick grep of the code for eglInitialize doesn't give any useful results. However as we saw at some length on Monday, all of these EGL library calls have been abstracted away. And eglInitialize() is no different. The gecko code uses a method called GLLibraryEGL::fInitialize() instead.
Grepping for that throws up some more useful references. The most promising one being this:
Unfortunately applying the patch, especially due to the differences in the way EGLDisplay is handled, turned out to be a challenge.
Consequently I'm now working my way through this patch again. It'll take me longer than just today, so I'll continue with it until it's all applied properly and report back if I find anything important tomorrow. Raine (rainemak) also flagged up patches 0045 and 0065. The former claims to "Prioritize GMP plugins over all others, and support decoding video for h264, vp8 & vp9"; whereas the latter will:
It'll take me a while to work through these as well, which means that's it for today. I'll write more about all this tomorrow.
If you'd like to read any of my other gecko diary entries, they're all available on my Gecko-dev Diary page.
Comment
What's become clear is that the front and back buffer are being successfully created (and now destroyed!). So now there are two other potential places where the rendering could be failing. It could be that the paint from the Web pages is failing to get on the texture. Or it could be that the paint from the texture is failing to get on the screen.
I'd like to devise ways to test both of those things, but before I do that I want to first check another area that's ripe for failure in my opinion, and that's the setting of the display value. The EGL library uses an EGLDisplay object to control where rendering happens. Although it's part of the Khronos EGL specification, the official documentation is frustratingly vague about what an EGLDisplay actually is. Thankfully the PowerVR documentation has a note that summarises it quite clearly.
EGL uses the concept of a "display". This is an abstract object which will show the rendered graphical output. In most environments it corresponds to a single physical screen. After creating a native display for a given windowing system, EGL can use this handle to get a corresponding EGLDisplay handle for use in rendering.
The shift from ESR 78 to ESR 91 brought with it a more flexible handling of displays. In particular, while ESR 78 had just a single instance of a display, ESR 91 allows multiple displays to be configured. What the practical benefit of this is I'm not entirely certain of, but handling of EGLDisplay storage has become more complex as a result.
So whereas previously gecko had a single mDisplay value that got used everywhere, the EGLDisplay is now wrapped in a gecko-specific EglDisplay class, defined in GLLibraryEGL.h. This class captures a collection of functionalities, one of which is to store an EGLDisplay value. There can be multiple instances of EglDisplay live at any one time.
The subtle distinction in the capitalisation — EGLDisplay vs. EglDisplay — is critical. The former belongs to EGL whereas the latter belongs to gecko. The fact they're so similar and that the shift from ESR 78 to ESR 91 has resulted in a switch from one to the other in many parts of the code, makes things all the more confusing.
There's plenty of opportunity for errors here. So I'm thinking: this is something to check.
An obvious place to start these checks is with display initialisation. A quick grep of the code for eglInitialize doesn't give any useful results. However as we saw at some length on Monday, all of these EGL library calls have been abstracted away. And eglInitialize() is no different. The gecko code uses a method called GLLibraryEGL::fInitialize() instead.
Grepping for that throws up some more useful references. The most promising one being this:
static EGLDisplay GetAndInitDisplay(GLLibraryEGL& egl, void* displayType,
    EGLDisplay display = EGL_NO_DISPLAY) {
  if (display == EGL_NO_DISPLAY) {
      display = egl.fGetDisplay(displayType);
      if (display == EGL_NO_DISPLAY) return EGL_NO_DISPLAY;
      if (!egl.fInitialize(display, nullptr, nullptr)) return EGL_NO_DISPLAY;
  }
  return display;
}
That's on ESR 78. On ESR 91 things are different and for good reason. The GetAndInitDisplay() method assumes a single instance of EGLDisplay as discussed earlier. On ESR 91 the display is initialised when its EglDisplay wrapper is created:
// static
std::shared_ptr<EglDisplay> EglDisplay::Create(GLLibraryEGL& lib,
                                               const EGLDisplay display,
                                               const bool isWarp) {
  // Retrieve the EglDisplay if it already exists
  {
    const auto itr = lib.mActiveDisplays.find(display);
    if (itr != lib.mActiveDisplays.end()) {
      const auto ret = itr->second.lock();
      if (ret) {
        return ret;
      }
    }
  }

  if (!lib.fInitialize(display, nullptr, nullptr)) {
    return nullptr;
  }
[...]
}
I've chopped off the end of the method there, but the section shown highlights the important part. It's also worth mentioning that in ESR 78 this and the surrounding functionality were all amended by Patch 0038 "Fix mesa egl display and buffer initialisation". I attempted to apply this patch all the way back on Day 55 and it does contain plenty of relevant changes. Here's the way the patch describes itself:Ensure the same display is used for all initialisations to avoid creating multiple wayland connections. Fallback to a wayland window surface in case pixel buffers aren't supported. This is needed on the emulator.
Unfortunately applying the patch, especially due to the differences in the way EGLDisplay is handled, turned out to be a challenge.
Consequently I'm now working my way through this patch again. It'll take me longer than just today, so I'll continue with it until it's all applied properly and report back if I find anything important tomorrow. Raine (rainemak) also flagged up patches 0045 and 0065. The former claims to "Prioritize GMP plugins over all others, and support decoding video for h264, vp8 & vp9"; whereas the latter will:
Hardcode loopback address for profile lock filename. When engine started without network PR_GetHostByName takes 20 seconds when connman tries to resolve host name. As this is only used as part of the profile lock filename it can as well be like "127.0.0.1:+<pid>".
It'll take me a while to work through these as well, which means that's it for today. I'll write more about all this tomorrow.
If you'd like to read any of my other gecko diary entries, they're all available on my Gecko-dev Diary page.
26 Mar 2024 : Day 197 #
If you've been following any of these diary entries over the last couple of weeks you'll know I've been struggling to diagnose a problem related to graphics surfaces. A serious bug prevented the graphics surface from being properly created, but as soon as that was fixed another serious issue appeared: after a short period of time using the WebView the app started to seize up, rapidly progressing to the entire phone. After a while the watchdog kicked in causing the phone to reboot itself.
This is, as a general rule, not considered ideal behaviour for an application.
Since then I've been generally debugging, monitoring and annotating the code to try to figure out what was causing the problem. As of yesterday I'd narrowed the issue down to the creation of the EGL image associated with an EGL texture. Each frame the app would create the texture, then create the image from the texture and then create a surface from that.
Skipping execution from anywhere up to the image creation and beyond would result in the seizing up happening. This led me to the EGL instructions: creating and destroying the image.
I've been looking at this code in ShareSurfaceEGL.cpp quite deeply for a couple of weeks now. And finally, narrowing down the area of consideration has finally thrown up something useful.
It turns out that while the surface destructor is called correctly and that this calls fDestroyImage() correctly, that's not all it's supposed to be doing.
All of this was stuff we checked yesterday: a call to fDestroyImage() was being called for every call to fCreateImage() except two, allowing for the front and back buffer to exist at all times.
But looking at the code today I realised there was something missing. When the image is created in SharedSurface_EGLImage::Create() it needs a texture to work with. And so we have this code:
Here is our destructor code in ESR 91:
To be clear, there's still no rendering happening to the screen, but this is nevertheless an important step forwards and I'm pretty chuffed to have noticed the missing code. In retrospect, it's something I should have noticed a lot earlier, but this goes to show both how intricate these things are, and where my limitations are as a developer. It's hard to keep all of the execution paths in my head all at the same time. As a result I'm left using these often trial-and-error based approaches to finding fixes.
It's a small victory. But it means that tomorrow I can continue on with the proper job of finding out why the render never makes it to the screen. With this resolved I'm feeling more confident again that it will be possible to get to the bottom of it.
If you'd like to read any of my other gecko diary entries, they're all available on my Gecko-dev Diary page.
Comment
This is, as a general rule, not considered ideal behaviour for an application.
Since then I've been generally debugging, monitoring and annotating the code to try to figure out what was causing the problem. As of yesterday I'd narrowed the issue down to the creation of the EGL image associated with an EGL texture. Each frame the app would create the texture, then create the image from the texture and then create a surface from that.
Skipping execution from anywhere up to the image creation and beyond would result in the seizing up happening. This led me to the EGL instructions: creating and destroying the image.
I've been looking at this code in ShareSurfaceEGL.cpp quite deeply for a couple of weeks now. And finally, narrowing down the area of consideration has finally thrown up something useful.
It turns out that while the surface destructor is called correctly and that this calls fDestroyImage() correctly, that's not all it's supposed to be doing.
All of this was stuff we checked yesterday: a call to fDestroyImage() was being called for every call to fCreateImage() except two, allowing for the front and back buffer to exist at all times.
But looking at the code today I realised there was something missing. When the image is created in SharedSurface_EGLImage::Create() it needs a texture to work with. And so we have this code:
  GLuint prodTex = CreateTextureForOffscreen(prodGL, formats, size);
  if (!prodTex) {
    return ret;
  }

  EGLClientBuffer buffer =
      reinterpret_cast<EGLClientBuffer>(uintptr_t(prodTex));
  EGLImage image = egl->fCreateImage(context,
                                     LOCAL_EGL_GL_TEXTURE_2D, buffer, nullptr);
First create the texture then pass this in to the image creation routine. But while the image is deleted in the destructor, the texture is not!Here is our destructor code in ESR 91:
SharedSurface_EGLImage::~SharedSurface_EGLImage() {
  const auto& gle = GLContextEGL::Cast(mDesc.gl);
  const auto& egl = gle->mEgl;
  egl->fDestroyImage(mImage);

  if (mSync) {
    // We can't call this unless we have the ext, but we will always have
    // the ext if we have something to destroy.
    egl->fDestroySync(mSync);
    mSync = 0;
  }
}
The image and sync are both destroyed, but the texture never is. So what happens if we add in the texture deletion? To test this I've added it in and the code now looks like this:
SharedSurface_EGLImage::~SharedSurface_EGLImage() {
  const auto& gle = GLContextEGL::Cast(mDesc.gl);
  const auto& egl = gle->mEgl;
  egl->fDestroyImage(mImage);

  if (mSync) {
    // We can't call this unless we have the ext, but we will always have
    // the ext if we have something to destroy.
    egl->fDestroySync(mSync);
    mSync = 0;
  }

  if (!mDesc.gl || !mDesc.gl->MakeCurrent()) return;

  mDesc.gl->fDeleteTextures(1, &mProdTex);
  mProdTex = 0;
}
And now, after building and running this new version, the app no longer seizes up!To be clear, there's still no rendering happening to the screen, but this is nevertheless an important step forwards and I'm pretty chuffed to have noticed the missing code. In retrospect, it's something I should have noticed a lot earlier, but this goes to show both how intricate these things are, and where my limitations are as a developer. It's hard to keep all of the execution paths in my head all at the same time. As a result I'm left using these often trial-and-error based approaches to finding fixes.
It's a small victory. But it means that tomorrow I can continue on with the proper job of finding out why the render never makes it to the screen. With this resolved I'm feeling more confident again that it will be possible to get to the bottom of it.
If you'd like to read any of my other gecko diary entries, they're all available on my Gecko-dev Diary page.
25 Mar 2024 : Day 196 #
Yesterday I finally narrowed down the error causing the WebView app to seize up during execution to a call to EglDisplay::fCreateImage(). Now it may not be this call that's the problem, it might be the way the result is used or the fact that it's not being freed properly, or maybe the parameters that are being passed in to it. But the fact that we've narrowed it down is likely to be a big help in figuring things out.
The call itself goes through to a method that looks like this:
What does this do? According to the documentation:
Super. Where does that leave us? Well, it tells us that the call to fCreateImage() in our SharedSurface_EGLImage::Create() is really just a bunch of simple wrapper calls that ends up calling an EGL function. What could be going wrong? One obvious potential problem is that the input parameters may be messed up. Another one is that each call to eglCreateImageKHR() creating an EGLImage object should be balanced out with a call to eglDestroyImageKHR() to destroy it.
We do have a call to eglDestroyImageKHR() happening in our SharedSurface_EGLImage destructor. It looks like this:
Just to ensure this matches the behaviour of the previous version I've also tested the same using the debugger on ESR 78. I got the same sequence of calls. First two creates, followed by balanced create and destroy calls so that there are exactly two images in existence at any one time:
If you'd like to read any of my other gecko diary entries, they're all available on my Gecko-dev Diary page.
Comment
The call itself goes through to a method that looks like this:
  EGLImage fCreateImage(EGLContext ctx, EGLenum target, EGLClientBuffer buffer,
                        const EGLint* attribList) const {
    MOZ_ASSERT(HasKHRImageBase());
    return mLib->fCreateImage(mDisplay, ctx, target, buffer, attribList);
  }
Here mLib is an instance of GLLibraryEGL. It looks like we have several layers of wrappers here so let's continue digging. This goes through to the following method that's part of GLLibraryEGL:
  EGLImage fCreateImage(EGLDisplay dpy, EGLContext ctx, EGLenum target,
                        EGLClientBuffer buffer,
                        const EGLint* attrib_list) const {
    WRAP(fCreateImageKHR(dpy, ctx, target, buffer, attrib_list));
  }
That looks similar but it's not quite the same. It is just another wrapper though, this time going through to a dynamically created method. The WRAP() macro looks like this:
#define WRAP(X)                \
  PROFILE_CALL                 \
  BEFORE_CALL                  \
  const auto ret = mSymbols.X; \
  AFTER_CALL                   \
  return ret
The PROFILE_CALL, BEFORE_CALL and AFTER_CALL lines are all macros which turn into something functional in the Android build, but in our build are just empty. That means that the WRAP(fCreateImageKHR(dpy, ctx, target, buffer, attrib_list)) statement actually reduces down to just the following:
  const auto ret = mSymbols.fCreateImageKHR(dpy, ctx, target, buffer,
    attrib_list);
  return ret
The mSymbols object has the following defined on it:
    EGLImage(GLAPIENTRY* fCreateImageKHR)(EGLDisplay dpy, EGLContext ctx,
                                          EGLenum target,
                                          EGLClientBuffer buffer,
                                          const EGLint* attrib_list);
Here EGLImage is a typedef of void* and GLAPIENTRY is an empty define, giving us a final result that looks like this:
    void* (*fCreateImageKHR)(EGLDisplay dpy, EGLContext ctx,
                             EGLenum target,
                             EGLClientBuffer buffer,
                             const EGLint* attrib_list);
We're still not quite there though. Inside GLLibraryEGL.cpp we find this:
    const SymLoadStruct symbols[] = {SYMBOL(CreateImageKHR),
                                     SYMBOL(DestroyImageKHR), END_OF_SYMBOLS};
    (void)fnLoadSymbols(symbols);
This is packing symbols with some data which is then passed in to fnLoadSymbols(), a method for loading symbols from a dynamically loaded library. The define that's used here is the following:
#define SYMBOL(X)                 \
  {                               \
    (PRFuncPtr*)&mSymbols.f##X, { \
      { "egl" #X }                \
    }                             \
  }
Notice how here it's playing around with the input argument so that, with a little judicious simplification for clarity, SYMBOL(CreateImageKHR) becomes:
mSymbols.fCreateImageKHR, {{ "eglCreateImageKHR" }}
In other words (big reveal, but no big surprise) a call to mSymbols.fCreateImageKHR() will get converted into a call to the EGL function eglCreateImageKHR, loaded in from the EGL driver.What does this do? According to the documentation:
eglCreateImage is used to create an EGLImage object from an existing image resource buffer. display specifies the EGL display used for this operation. context specifies the EGL client API context used for this operation, or EGL_NO_CONTEXT if a client API context is not required. target specifies the type of resource being used as the EGLImage source (examples include two-dimensional textures in OpenGL ES contexts and VGImage objects in OpenVG contexts). buffer is the name (or handle) of a resource to be used as the EGLImage source, cast into the type EGLClientBuffer. attrib_list is a list of attribute-value pairs which is used to select sub-sections of buffer for use as the EGLImage source, such as mipmap levels for OpenGL ES texture map resources, as well as behavioral options, such as whether to preserve pixel data during creation. If attrib_list is non-NULL, the last attribute specified in the list must be EGL_NONE.
Super. Where does that leave us? Well, it tells us that the call to fCreateImage() in our SharedSurface_EGLImage::Create() is really just a bunch of simple wrapper calls that ends up calling an EGL function. What could be going wrong? One obvious potential problem is that the input parameters may be messed up. Another one is that each call to eglCreateImageKHR() creating an EGLImage object should be balanced out with a call to eglDestroyImageKHR() to destroy it.
We do have a call to eglDestroyImageKHR() happening in our SharedSurface_EGLImage destructor. It looks like this:
SharedSurface_EGLImage::~SharedSurface_EGLImage() {
  const auto& gle = GLContextEGL::Cast(mDesc.gl);
  const auto& egl = gle->mEgl;
  egl->fDestroyImage(mImage);
[...]
There's an unexpected difference with the way it's called in ESR 78, where the code looks like this:
SharedSurface_EGLImage::~SharedSurface_EGLImage() {
  const auto& gle = GLContextEGL::Cast(mGL);
  const auto& egl = gle->mEgl;
  egl->fDestroyImage(egl->Display(), mImage);
[...]
Notice the extra egl->Display() value being passed in as a parameter. That's because in ESR 91 EGLLibrary is storing its own copy of the EGLDisplay:
  EGLBoolean fDestroyImage(EGLImage image) const {
    MOZ_ASSERT(HasKHRImageBase());
    return mLib->fDestroyImage(mDisplay, image);
  }
That gives us a couple of things to look into: first, is the correctly value being passed in for image? Second, is the value stored for mDisplay valid? The underlying call to eglDestroyImage also has a Boolean return value which will return EGL_FALSE in case something goes wrong. A nice first step would be to check this return value in case it's indicating a problem. To do this I've added some additional debug output to the code:
  EGLBoolean result = egl->fDestroyImage(mImage);
  printf_stderr("RENDER: fDestroyImage() return value: %d\n", result);
The result of running it shows a large number of successful calls to fDestroyImage():
[...]
[JavaScript Warning: "Layout was forced before the page was fully loaded.
    If stylesheets are not yet loaded this may cause a flash of unstyled
    content." {file: "https://jolla.com/themes/unlike/js/
    modernizr.js?x98582&ver=2.6.2" line: 4}]
RENDER: fDestroyImage() return value: 1
RENDER: fDestroyImage() return value: 1
RENDER: fDestroyImage() return value: 1
RENDER: fDestroyImage() return value: 1
RENDER: fDestroyImage() return value: 1
RENDER: fDestroyImage() return value: 1
RENDER: fDestroyImage() return value: 1
[...]
Since this output looks okay I've taken it a step further and added a count to the creation and deletion calls in case it shows any imbalance between the two.
[...]
Frame script: embedhelper.js loaded
RENDER: fCreateImage() return value: 1, 0
RENDER: fCreateImage() return value: 1, 1
CONSOLE message:
[JavaScript Warning: "This page uses the non standard property “zoom”.
    Consider using calc() in the relevant property values, or using “transform”
    along with “transform-origin: 0 0”." {file: "https://jolla.com/
    " line: 0}]
CONSOLE message:
[JavaScript Warning: "Layout was forced before the page was fully loaded.
    If stylesheets are not yet loaded this may cause a flash of unstyled
    content." {file: "https://jolla.com/themes/unlike/js/
    modernizr.js?x98582&ver=2.6.2" line: 4}]
RENDER: fCreateImage() return value: 1, 2
RENDER: fDestroyImage() return value: 1, 0
RENDER: fCreateImage() return value: 1, 3
RENDER: fDestroyImage() return value: 1, 1
[...]

RENDER: fCreateImage() return value: 1, 316
RENDER: fDestroyImage() return value: 1, 314
RENDER: fCreateImage() return value: 1, 317
RENDER: fDestroyImage() return value: 1, 315
[...]
The increasing numbers (going up to 317 and 315 here) tell us that the balance between creates and destroys is pretty clean. There are two creates at the start which don't have matching destroys, after which everything is balanced. It seems unlikely therefore that this is the cause of the seize-ups. What's more, it all makes sense too: at any point in time there should be a front and a back buffer, so there should always be exactly two images in existence at any one time. That's a situation that's confirmed by the numbers.Just to ensure this matches the behaviour of the previous version I've also tested the same using the debugger on ESR 78. I got the same sequence of calls. First two creates, followed by balanced create and destroy calls so that there are exactly two images in existence at any one time:
fCreateImage
fCreateImage
fCreateImage
fDestroyImage
fCreateImage
fDestroyImage
fCreateImage
[...]
In conclusion everything here looks in order on ESR 91. So tomorrow I'll move on to checking that the display value is set correctly.
If you'd like to read any of my other gecko diary entries, they're all available on my Gecko-dev Diary page.
24 Mar 2024 : Day 195 #
I'm working my way through the SharedSurface_EGLImage::Create() method and gradually increasing the steps that are executed. Over the last few days I first established that preventing the SurfaceFactory_EGLImage from being created was enough to prevent the app from seizing up. Without the factory the surfaces themselves weren't going to get created. Next I enabled the factory but disabled the image creation.
Today I'm allowing the offscreen texture to be created by allowing this call to take place:
Change made, code built, binary transferred and library installed. Now running the app, there's no seizing up. So that takes us one more step closer to finding the culprit. Now I've moved the early return one step later, until after the EGLImage has been created using the texture, after these lines:
If you'd like to read any of my other gecko diary entries, they're all available on my Gecko-dev Diary page.
Comment
Today I'm allowing the offscreen texture to be created by allowing this call to take place:
GLuint prodTex = CreateTextureForOffscreen(prodGL, formats, size);But I've placed a return immediately afterwards so that neither the image nor the surface that builds on this are created. Once again the objective is to find out whether the app seizes up or not. If it does then that would point to the texture being the culprit. If not, it's likely something that follows it.
Change made, code built, binary transferred and library installed. Now running the app, there's no seizing up. So that takes us one more step closer to finding the culprit. Now I've moved the early return one step later, until after the EGLImage has been created using the texture, after these lines:
  EGLClientBuffer buffer =
      reinterpret_cast<EGLClientBuffer>(uintptr_t(prodTex));
  EGLImage image = egl->fCreateImage(context,
                                     LOCAL_EGL_GL_TEXTURE_2D, buffer, nullptr);
  if (!image) {
    prodGL->fDeleteTextures(1, &prodTex);
    return ret;
  }
Once again, I've build, transferred and installed the updated library. And now when I run it... the app seizes up! So we have our culprit. The problem seems to be the creation of the image from the surface that's either causing the problem in itself, or triggering something else to cause the problem. The most likely offender in the latter case would be if the created image weren't being freed:
  EGLImage image = egl->fCreateImage(context,
                                     LOCAL_EGL_GL_TEXTURE_2D, buffer, nullptr);
This is reminiscent of a problem I experienced earlier which resulted in me having to disable the texture capture for the cover image. Now that it's narrowed down I can look into the underlying reason. That will be my task for tomorrow morning.If you'd like to read any of my other gecko diary entries, they're all available on my Gecko-dev Diary page.
23 Mar 2024 : Day 194 #
Today I'm trying to narrow things down after reconfirming that when there's no SurfaceFactory_EGLImage the app doesn't seize up. I want to focus on two methods. First to check if anything is up with SurfaceFactory_EGLImage::Create(). Second I want to try disabling elements of SharedSurface_EGLImage::Create() in case that makes any difference. It's just a short one today, but still important tasks for helping get to the bottom of things.
First up SurfaceFactory_EGLImage::Create(). There's nothing to disable here (all it does is return the factory) but there are some input parameters to check. I added some debug print code for this:
Next up is SharedSurface_EGLImage::Create(). For the first check I've got it to return almost immediately with a null return value. This may or may not prevent the seizing up from happening. Either way it will be useful to know. If it does, then I'm focusing my intention in the correct place. If it doesn't I know I need to focus elsewhere.
The builds for this aren't taking the same seven hours that a full gecko builds, but they do still take tens of minutes. This seems to make me even more impatient. I think it's because 10 minutes is long enough to be noticeable, but not long enough that it's worth me context switching to some other task.
On copying over the library and executing the WebView app I find that this change has indeed stopped the app from seizing up. So this is excellent news. It means that tomorrow I can continue through the SharedSurface_EGLImage::Create() narrowing down where the problem starts.
If you'd like to read any of my other gecko diary entries, they're all available on my Gecko-dev Diary page.
Comment
First up SurfaceFactory_EGLImage::Create(). There's nothing to disable here (all it does is return the factory) but there are some input parameters to check. I added some debug print code for this:
  if (HasEglImageExtensions(*gle)) {
    printf_stderr("RENDER: prodGL: %p\n", prodGL);
    printf_stderr("RENDER: caps: any %d, color %d, alpha %d, bpp16 %d,
    depth %d, stencil %d, premultAlpha %d, preserve %d\n", caps.any,
    caps.color, caps.alpha, caps.bpp16, caps.depth, caps.stencil,
    caps.premultAlpha, caps.preserve);
    printf_stderr("RENDER: allocator: %p\n", allocator.get());
    printf_stderr("RENDER: flags: %#x\n", (uint32_t)flags);
    printf_stderr("RENDER: context: %p\n", context);

    // The surface allocator that we want to create this
    // for.  May be null.
    RefPtr<layers::LayersIPCChannel> surfaceAllocator;

    ret.reset(new ptrT({prodGL, SharedSurfaceType::Basic, layers::TextureType::
    Unknown, true}, caps, allocator, flags, context));
  }
On ESR 78 the values from this method are the following:
=============== Preparing offscreen rendering context ===============
RENDER: prodGL: 0x7eac109140
RENDER: caps: any 0, color 1, alpha 0, bpp16 0, depth 0, stencil 0,
    premultAlpha 1, preserve 0
RENDER: allocator: (nil)
RENDER: flags: 0x2
RENDER: context: 0x7eac004d50
And the values in ESR 91 are identical, other than certain structures residing in different places in memory:
=============== Preparing offscreen rendering context ===============
RENDER: prodGL: 0x7ed819aa50
RENDER: caps: any 0, color 1, alpha 0, bpp16 0, depth 0, stencil 0,
    premultAlpha 1, preserve 0
RENDER: allocator: (nil)
RENDER: flags: 0x2
RENDER: context: 0x7ed8004be0
I forgot to add caps.surfaceAllocator to this list, but using the debugger I was able to confirm that this is set to null in both cases.Next up is SharedSurface_EGLImage::Create(). For the first check I've got it to return almost immediately with a null return value. This may or may not prevent the seizing up from happening. Either way it will be useful to know. If it does, then I'm focusing my intention in the correct place. If it doesn't I know I need to focus elsewhere.
The builds for this aren't taking the same seven hours that a full gecko builds, but they do still take tens of minutes. This seems to make me even more impatient. I think it's because 10 minutes is long enough to be noticeable, but not long enough that it's worth me context switching to some other task.
On copying over the library and executing the WebView app I find that this change has indeed stopped the app from seizing up. So this is excellent news. It means that tomorrow I can continue through the SharedSurface_EGLImage::Create() narrowing down where the problem starts.
If you'd like to read any of my other gecko diary entries, they're all available on my Gecko-dev Diary page.
22 Mar 2024 : Day 193 #
We took a bit of an interlude from my usual plan yesterday to consider some of the many useful suggestions that I've received over the last couple of weeks. I generated quite a few log files but didn't find any obvious discrepancies in them. That's not to say we've seen the end of those ideas and I'm still interested to know if anyone else can spot anything that looks worth following up. In the meantime I'm dropping back into my usual cadence with a plan to test out changes to the source code.
The problem I'm trying to solve is the seizing up of the app. I first noticed this after fixing a bug in the SharedSurface_EGLImage::Create() method. Over the next couple of days I'm planning to work through this method disabling various parts of it to try to pin down exactly which parts are causing the problem.
The start of the method looks like this:
The rendering was already broken and this change will only break it further, but the question I want to know the answer to is: "will this stop the app from seizing up".
The answer is: "yes". This one small change means I can now leave the app running for long periods, swiping between the lipstick home screen and the app, swiping up and down on the page (which no obvious effect, but the touch input is still going through). The app remains responsive, my phone's watchdog doesn't bite and the OS doesn't reboot.
I'm glad about this. If it hadn't been the case it would have meant I'd misunderstood where the problem was coming from. Now reassured I can continue on to partition the code up and try to narrow down the error.
But that will be for tomorrow. For today, it's good to be armed with this backstop of knowledge about where the error is emanating from.
If you'd like to read any of my other gecko diary entries, they're all available on my Gecko-dev Diary page.
Comment
The problem I'm trying to solve is the seizing up of the app. I first noticed this after fixing a bug in the SharedSurface_EGLImage::Create() method. Over the next couple of days I'm planning to work through this method disabling various parts of it to try to pin down exactly which parts are causing the problem.
The start of the method looks like this:
/*static*/
UniquePtr<SurfaceFactory_EGLImage> SurfaceFactory_EGLImage::Create(
    GLContext* prodGL, const SurfaceCaps& caps,
    const RefPtr<layers::LayersIPCChannel>& allocator,
    const layers::TextureFlags& flags) {
  const auto& gle = GLContextEGL::Cast(prodGL);
  //const auto& egl = gle->mEgl;
  const auto& context = gle->mContext;

  typedef SurfaceFactory_EGLImage ptrT;
  UniquePtr<ptrT> ret;

  if (HasEglImageExtensions(*gle)) {
    ret.reset(new ptrT({prodGL, SharedSurfaceType::Basic, layers::TextureType::
    Unknown, true}, caps, allocator, flags, context));
  }

  return ret;
}
The original problem was that the HasExtensions() condition was causing the method to be exited early. In fact, really before the method had done anything at all. So I'm forcing an early return to simulate the same behaviour; like this:
[...]
  typedef SurfaceFactory_EGLImage ptrT;
  UniquePtr<ptrT> ret;

  return ret;
[...]
I've rebuilt it using the standard partial-build process, copied the resulting libxul.so over to my phone and installed it.
The rendering was already broken and this change will only break it further, but the question I want to know the answer to is: "will this stop the app from seizing up".
The answer is: "yes". This one small change means I can now leave the app running for long periods, swiping between the lipstick home screen and the app, swiping up and down on the page (which no obvious effect, but the touch input is still going through). The app remains responsive, my phone's watchdog doesn't bite and the OS doesn't reboot.
I'm glad about this. If it hadn't been the case it would have meant I'd misunderstood where the problem was coming from. Now reassured I can continue on to partition the code up and try to narrow down the error.
But that will be for tomorrow. For today, it's good to be armed with this backstop of knowledge about where the error is emanating from.
If you'd like to read any of my other gecko diary entries, they're all available on my Gecko-dev Diary page.
21 Mar 2024 : Day 192 #
Over the last week or so while I've been struggling with what's almost certainly a texture or surface related bug, I've received many more suggestions than I expected from other Sailfish OS developers, both from Sailors (Jolla employees) and independent developers. Receiving all of this helpful input is hugely motivational and much appreciated. I'm always keen to try out others' suggestions, not least because I'm very aware of how much amazing knowledge there is out there and which it's always going to be beneficial to draw from. The Sailfish OS hivemind is impressively well-informed when it comes to technical matters.
However, these diary entries all form part of a pipeline. There's the pipeline of the plans I'm working my way though, on top of which there's also the "editing" pipeline, which means there's a lag of a couple of days between me writing a post and it going online.
So since I already had a set collection of things I wanted to try (checking creation/deletion balance, measuring memory consumption, running the app through valgrind), I've not been in a position to try out some of these suggestions until now — until the other tasks had worked their way through the pipeline — essentially.
Now that I've moved off valgrind and am going back to the source code, now seems like a good time to take a look at some of the suggestions I've received. Now while on the one hand I want to give each suggestion each a fair crack at solving the problem, on the other hand many of the suggestions touch on areas I'm not so familiar with. Consequently I'm going to explain what's happening here, but I may need further input for some of them.
First up, Tone (tortoisedoc) has made a number of useful suggestions recently. The latest is about making use of extra Wayland debugging output:
Thank you for this Tone. Running using WAYLAND_DEBUG=1 certainly produces a lot of output:
Please do feel free to download the output file yourself to take a look. I've also generated a similar file for the working ESR 78 build and which I was hoping may be useful for comparison. On ESR 78 the loop it settles into is similar:
A second nice suggestion, this one made by Tomi (tomin) in the same thread, was to check in case the textures aren't being properly released, resulting in the reserve of file descriptors becoming exhausted:
This sounds very plausible indeed. My suspicion has always been that the particular issue I'm experiencing relates to textures/surfaces not being released, but it hadn't occurred to me at all that it might be file-descriptor related and it certainly wouldn't have occurred to try using lsof to list them.
Executing lsof while the app is running shows over 400 open file descriptors. But there's nothing too dramatic that I can see there. Again, please feel free to check the output file in case you can spot something of interest. Running the command repeatedly to show open file descriptors over time shows a steady increase until it hits 440, at which point it stays fairly steady:
I've also received some helpful advice from Raine (rainemak). As it was a private message I don't want to quote it here, but Raine suggests several ways to make better use of the gecko logging capabilities which I'll definitely be making use of. He also suggested to look at a couple of the patches:
I'll take a careful look at these two and report back.
Finally, I need to reiterate my thanks to Florian Xaver (wosrediinanatour). While I've not had a chance to document in this diary all of the useful points Florian has been making over the last few weeks, I still very much intend to do so.
As I round off, I also want to mention this nice article by Arthur Schiwon (blizzz) which details his impressive attempts to reduce the memory footprint of his Nextcloud Talk app. Very relevant to some of the discussion here in recent days and with thanks to Patrick (pherjung) for pointing it out.
A big thank you for all of the great suggestions, feedback and general encouragement. I'm always happy to get this input and gradually it's all helping to create a clearer picture.
If you'd like to read any of my other gecko diary entries, they're all available on my Gecko-dev Diary page.
Comment
However, these diary entries all form part of a pipeline. There's the pipeline of the plans I'm working my way though, on top of which there's also the "editing" pipeline, which means there's a lag of a couple of days between me writing a post and it going online.
So since I already had a set collection of things I wanted to try (checking creation/deletion balance, measuring memory consumption, running the app through valgrind), I've not been in a position to try out some of these suggestions until now — until the other tasks had worked their way through the pipeline — essentially.
Now that I've moved off valgrind and am going back to the source code, now seems like a good time to take a look at some of the suggestions I've received. Now while on the one hand I want to give each suggestion each a fair crack at solving the problem, on the other hand many of the suggestions touch on areas I'm not so familiar with. Consequently I'm going to explain what's happening here, but I may need further input for some of them.
First up, Tone (tortoisedoc) has made a number of useful suggestions recently. The latest is about making use of extra Wayland debugging output:
It seems you have exited browser world and are stepping into wayland lands, thats a good sign, problems yes but somewhere else 🙂 you could try the WAYLAND_DEBUG=1 (or "all" iirc) to complete your logs with the wayland surface creation protocol (it might be qt-wayland doesnt support swapchains?). Its a fairly simple protocol.
Thank you for this Tone. Running using WAYLAND_DEBUG=1 certainly produces a lot of output:
$ WAYLAND_DEBUG=1 harbour-webview 2>debug-harbour-webview-esr91-01.txt
[D] unknown:0 - QML debugging is enabled. Only use this in a safe environment.
[D] main:30 - WebView Example
[D] main:44 - Using default start URL:  "https://www.flypig.co.uk/search/
    "
[D] main:47 - Opening webview
[1522475.832]  -> wl_display@1.get_registry(new id wl_registry@2)
[1522477.064]  -> wl_display@1.sync(new id wl_callback@3)
[1522479.962] wl_display@1.delete_id(3)
[1522480.054] wl_registry@2.global(1, "wl_compositor", 3)
[...]
Having completed the initialisation sequence the output from the app then settles into a loop contianing the following:
[1523976.770] wl_buffer@4278190081.release()
[1523976.951] wl_callback@45.done(5115868)
[1523985.299]  -> wl_surface@20.frame(new id wl_callback@45)
[1523985.422]  -> wl_surface@20.attach(wl_buffer@4278190080, 0, 0)
[1523985.486]  -> wl_surface@20.damage(0, 0, 1080, 2520)
[1523985.557]  -> wl_surface@20.commit()
[1523985.581]  -> wl_display@1.sync(new id wl_callback@44)
[1523995.055] wl_display@1.delete_id(44)
[1524013.656] wl_display@1.delete_id(45)
Periodically there are also touch events that punctuate the output, presumably the result of me scrolling the page.
[1531447.943] qt_touch_extension@10.touch(5123658, 68, 65538, 7950000,
    16980000, 7367, 6740, 50027, 50027, 255, 0, 0, 196608, array)
[1531448.190] qt_touch_extension@10.touch(5123665, 68, 65538, 7940000,
    16920000, 7358, 6716, 50027, 50027, 255, 0, 0, 196608, array)
This continues right up until the app seizes up. Working through the file I don't see any changes towards the end that might explain why things are going wrong, but maybe Tone or another developer with a keener eye and greater expertise than I have can spot something?Please do feel free to download the output file yourself to take a look. I've also generated a similar file for the working ESR 78 build and which I was hoping may be useful for comparison. On ESR 78 the loop it settles into is similar:
[2484510.845] wl_buffer@4278190080.release()
[2484515.820] wl_display@1.delete_id(44)
[2484515.928] wl_callback@44.done(186889767)
[2484515.967]  -> wl_surface@20.frame(new id wl_callback@44)
[2484516.006]  -> wl_surface@20.attach(wl_buffer@4278190082, 0, 0)
[2484516.062]  -> wl_surface@20.damage(0, 0, 1080, 2520)
[2484516.129]  -> wl_surface@20.commit()
[2484516.152]  -> wl_display@1.sync(new id wl_callback@49)
[2484516.942] wl_display@1.delete_id(49)
There is a slight difference in ordering: one of the deletes is out of sync across the two versions. Could this be significant? It's quite possible these logs are hiding a critical piece of information, but nothing is currently leaping out at me unfortunately.
A second nice suggestion, this one made by Tomi (tomin) in the same thread, was to check in case the textures aren't being properly released, resulting in the reserve of file descriptors becoming exhausted:
The issue that @flypig is now trying to figure out sounds a bit like the one I had with Qt Scene Graph recently. I wasn’t properly releasing textures so it kept reserving dmabuf file descriptors and then eventually the app crashed because it run out of fds (or rather I think it tried to use fd > 1024 for something that’s not compatible with such “high” value). Anyway lsof -p output might be worth looking at.
This sounds very plausible indeed. My suspicion has always been that the particular issue I'm experiencing relates to textures/surfaces not being released, but it hadn't occurred to me at all that it might be file-descriptor related and it certainly wouldn't have occurred to try using lsof to list them.
Executing lsof while the app is running shows over 400 open file descriptors. But there's nothing too dramatic that I can see there. Again, please feel free to check the output file in case you can spot something of interest. Running the command repeatedly to show open file descriptors over time shows a steady increase until it hits 440, at which point it stays fairly steady:
$ while true ; do bash -c \
    'lsof -p $(pgrep "harbour-webview") | wc -l' ; \
    sleep 0.5 ; done
[...]
121
280
351
434
435
444
443
443
443
440
440
440
From this it doesn't look like it's a case of file descriptor exhaustion, but I'd be very interested in others' opinions on this.I've also received some helpful advice from Raine (rainemak). As it was a private message I don't want to quote it here, but Raine suggests several ways to make better use of the gecko logging capabilities which I'll definitely be making use of. He also suggested to look at a couple of the patches:
- rpm/0065-sailfishos-gecko-Prioritize-loading-of-extension-ver.patch
- rpm/0047-sailfishos-egl-Drop-swap_buffers_with_damage-extensi.patch
I'll take a careful look at these two and report back.
Finally, I need to reiterate my thanks to Florian Xaver (wosrediinanatour). While I've not had a chance to document in this diary all of the useful points Florian has been making over the last few weeks, I still very much intend to do so.
As I round off, I also want to mention this nice article by Arthur Schiwon (blizzz) which details his impressive attempts to reduce the memory footprint of his Nextcloud Talk app. Very relevant to some of the discussion here in recent days and with thanks to Patrick (pherjung) for pointing it out.
A big thank you for all of the great suggestions, feedback and general encouragement. I'm always happy to get this input and gradually it's all helping to create a clearer picture.
If you'd like to read any of my other gecko diary entries, they're all available on my Gecko-dev Diary page.
20 Mar 2024 : Day 191 #
This morning I'm taking the first opportunity to test out the new libxul.so binary generated from the build yesterday. Firing up the app there's no render and although initially things seem to be running fine (apart from the complete lack of anything useful on-screen!) after a short time the browser seizes up again.
So sadly this hasn't fixed the underlying issues. But I'm hoping it still fixed something. I can at least push the app through valgrind to see if it had some effect or not.
So this is exactly what I've done.
This is good news: it seems that the change did the trick and, although the render isn't working, the change also doesn't cause the WebView to crash. It feels like this is one step closer to getting our desired result.
For those who are still following along, or just desperate to get your hands on a build to test, I appreciate it's slow progress. But each fix is a fix that's necessary and I remain confident that eventually all of the pieces will fall in to place. This is very definitely a marathon and not a sprint. An Odyssey not a citybreak. We'll get there!
Having exhausted valgrind as a means to find the problem, we now need a new approach. In order to figure out where to focus, I'm going to go back to the SharedSurface_EGLImage::Create() method. You may recall that the seizing up of execution only happened after we persuaded this method to do something sensible and not just return null all the time.
I want to revisit this. My plan is to go through this method and judiciously remove parts of it until the seizing up no longer happens. The plan is to narrow down exactly which part is causing the issue, which should also narrow down where to look for a possible fix.
Unfortunately other commitments mean it's only a short one today. I'm very much hoping to be able to get to this task of cutting out elements to see the effects tomorrow.
If you'd like to read any of my other gecko diary entries, they're all available on my Gecko-dev Diary page.
Comment
So sadly this hasn't fixed the underlying issues. But I'm hoping it still fixed something. I can at least push the app through valgrind to see if it had some effect or not.
So this is exactly what I've done.
$ valgrind --log-file=valgrind-harbour-webview-esr91-02.txt harbour-webviewThe resulting output file still — unsurprisingly — contains no shortage of memory mess, but checking the Compositor thread there's no sign of anything related to fGetDisplay(), GetAndInitDisplay() nor CreateOffscreen().
This is good news: it seems that the change did the trick and, although the render isn't working, the change also doesn't cause the WebView to crash. It feels like this is one step closer to getting our desired result.
For those who are still following along, or just desperate to get your hands on a build to test, I appreciate it's slow progress. But each fix is a fix that's necessary and I remain confident that eventually all of the pieces will fall in to place. This is very definitely a marathon and not a sprint. An Odyssey not a citybreak. We'll get there!
Having exhausted valgrind as a means to find the problem, we now need a new approach. In order to figure out where to focus, I'm going to go back to the SharedSurface_EGLImage::Create() method. You may recall that the seizing up of execution only happened after we persuaded this method to do something sensible and not just return null all the time.
I want to revisit this. My plan is to go through this method and judiciously remove parts of it until the seizing up no longer happens. The plan is to narrow down exactly which part is causing the issue, which should also narrow down where to look for a possible fix.
Unfortunately other commitments mean it's only a short one today. I'm very much hoping to be able to get to this task of cutting out elements to see the effects tomorrow.
If you'd like to read any of my other gecko diary entries, they're all available on my Gecko-dev Diary page.
19 Mar 2024 : Day 190 #
Yesterday I collected valgrind logs from ESR 78 and ESR 91. Even though both logs contain a huge number of errors, I whittled the interesting ones down to just two.
First there's an invalid read size coming from GetAndInitDisplay(). This should be straightforward to track down.
The reason the for the EGLDisplay being deleted is because of this call here:
In ESR 78 the logic around EglDisplay didn't exist. Back then there was just an EGLDisplay value, which is a pointer to an opaque EGL structure and which could be passed around everywhere. In ESR 91 an effort has been made to generalise this, so that multiple such displays can be handled simultaneously. As part of this move the value was wrapped in the similarly — but not identically — named EglDisplay, which contains an EGLDisplay pointer along with some other values and helper methods.
It looks like there's something going wrong with this. Disentangling it could be horrific, but there is something that works in our favour, which is that the two calls don't happen to far apart from one another.
In fact, the call stack for both seems to originate in this method:
The actual failure is happening inside libEGL. I looked at the code there and, to be honest, it's not clear to me what the underlying reason is. Nevertheless, it's clear that there's something going wrong here in the gecko code that can be fixed and which should address it.
When the WebView is initialised it has to create an EGL display. Starting at the DefaultEglDisplay() method I copied out above there's a problem and the problem is that the display is created not once, but twice. To understand this, we have to note the fact that some time ago inside the GLLibraryEGL::Init() method I added the following code:
This piece of code is a problem for two reasons, which become clear when we follow the flow through DefaultEglDisplay():
I'm about to make this change when something else peculiar jumps out at me. The call to GLLibraryEGL::DefaultDisplay() checks whether the value of mDefaultDisplay is valid and only calls CreateDisplay() to create a new one if it's not. That's strange, since the value should already have been set in GLLibraryEGL::Init(). The exception is if CreateDisplay() returns null. It is possible that this is what's causing this issue. Let's check:
I've deleted the five lines. I've set the build running.
While that chugs away, let's briefly look at the other potentially relevant issue that valgrind threw up. This issue relates to APZCTreeManager::PrintAPZCInfo(). Although that doesn't sound especially relevant, the code is from the Compositor thread, so may be worth looking in to just in case.
It's been a long one today and I apologise for that. Sometimes it takes a lot to unravel the code and structure my thoughts around it. The key question now is whether the small change I've made will make any difference to the rendering. We'll find that out tomorrow.
If you'd like to read any of my other gecko diary entries, they're all available on my Gecko-dev Diary page.
Comment
First there's an invalid read size coming from GetAndInitDisplay(). This should be straightforward to track down.
==29044== Thread 32 Compositor:
==29044== Invalid read of size 8
==29044==    at 0xCCF62E0: hybris_egl_display_get_mapping (in /usr/lib64/
    libEGL.so.1.0.0)
==29044==    by 0xCCF63BB: ??? (in /usr/lib64/libEGL.so.1.0.0)
==29044==    by 0x758848B: fGetDisplay (GLLibraryEGL.h:193)
==29044==    by 0x758848B: mozilla::gl::GetAndInitDisplay(mozilla::gl::
    GLLibraryEGL&, void*, void*) (GLLibraryEGL.cpp:151)
==29044==    by 0x75889C7: mozilla::gl::GLLibraryEGL::CreateDisplay(bool,
    nsTSubstring<char>*, void*) (GLLibraryEGL.cpp:813)
==29044==    by 0x7589917: mozilla::gl::GLLibraryEGL::DefaultDisplay(
    nsTSubstring<char>*) (GLLibraryEGL.cpp:745)
==29044==    by 0x759AFBF: DefaultEglDisplay (GLContextEGL.h:33)
==29044==    by 0x759AFBF: mozilla::gl::GLContextProviderEGL::CreateHeadless(
    mozilla::gl::GLContextCreateDesc const&, nsTSubstring<char>*) (
    GLContextProviderEGL.cpp:1246)
==29044==    by 0x759B89B: mozilla::gl::GLContextProviderEGL::CreateOffscreen(
    mozilla::gfx::IntSizeTyped<mozilla::gfx::UnknownUnits> const&, mozilla::gl::
    SurfaceCaps const&, mozilla::gl::CreateContextFlags, nsTSubstring<char>*) (
    GLContextProviderEGL.cpp:1288)
==29044==    by 0x76042BB: mozilla::layers::CompositorOGL::CreateContext() (
    CompositorOGL.cpp:256)
[...]

==29044==  Address 0x14c39ef0 is 0 bytes inside a block of size 40 free'd
==29044==    at 0x484EAD8: operator delete(void*, unsigned long) (
    vg_replace_malloc.c:935)
==29044==    by 0xCCF64BB: eglTerminate (in /usr/lib64/libEGL.so.1.0.0)
==29044==    by 0x7587473: fTerminate (GLLibraryEGL.h:234)
==29044==    by 0x7587473: fTerminate (GLLibraryEGL.h:639)
==29044==    by 0x7587473: mozilla::gl::EglDisplay::~EglDisplay() (
    GLLibraryEGL.cpp:734)
==29044==    by 0x758752B: destroy<mozilla::gl::EglDisplay> (new_allocator.h:
    140)
==29044==    by 0x758752B: destroy<mozilla::gl::EglDisplay> (alloc_traits.h:487)
==29044==    by 0x758752B: std::_Sp_counted_ptr_inplace<mozilla::gl::
    EglDisplay, std::allocator<mozilla::gl::EglDisplay>, (__gnu_cxx::
    _Lock_policy)2>::_M_dispose() (shared_ptr_base.h:554)
==29044==    by 0x7575F33: std::_Sp_counted_base<(__gnu_cxx::_Lock_policy)2>::
    _M_release() (shared_ptr_base.h:155)
==29044==    by 0x758937F: ~__shared_count (shared_ptr_base.h:728)
==29044==    by 0x758937F: ~__shared_ptr (shared_ptr_base.h:1167)
==29044==    by 0x758937F: ~shared_ptr (shared_ptr.h:103)
==29044==    by 0x758937F: mozilla::gl::GLLibraryEGL::Init(bool,
    nsTSubstring<char>*, void*) (GLLibraryEGL.cpp:504)
==29044==    by 0x75895F7: mozilla::gl::GLLibraryEGL::Create(
    nsTSubstring<char>*) (GLLibraryEGL.cpp:345)
==29044==    by 0x758974F: mozilla::gl::DefaultEglLibrary(nsTSubstring<char>*) (
    GLContextProviderEGL.cpp:1331)
==29044==    by 0x759AFAB: DefaultEglDisplay (GLContextEGL.h:29)
==29044==    by 0x759AFAB: mozilla::gl::GLContextProviderEGL::CreateHeadless(
    mozilla::gl::GLContextCreateDesc const&, nsTSubstring<char>*) (
    GLContextProviderEGL.cpp:1246)
==29044==    by 0x759B89B: mozilla::gl::GLContextProviderEGL::CreateOffscreen(
    mozilla::gfx::IntSizeTyped<mozilla::gfx::UnknownUnits> const&, mozilla::gl::
    SurfaceCaps const&, mozilla::gl::CreateContextFlags, nsTSubstring<char>*) (
    GLContextProviderEGL.cpp:1288)
==29044==    by 0x76042BB: mozilla::layers::CompositorOGL::CreateContext() (
    CompositorOGL.cpp:256)
[...]

==29044==  Block was alloc'd at
==29044==    at 0x484BF24: operator new(unsigned long) (vg_replace_malloc.c:422)
==29044==    by 0x14E619FB: waylandws_GetDisplay (in /usr/lib64/libhybris/
    eglplatform_wayland.so)
==29044==    by 0xCCF63C7: ??? (in /usr/lib64/libEGL.so.1.0.0)
==29044==    by 0x14960F73: ??? (in /usr/lib64/qt5/plugins/
    wayland-graphics-integration-client/libwayland-egl.so)
==29044==    by 0x14778947: QtWaylandClient::QWaylandIntegration::
    initializeClientBufferIntegration() (in /usr/lib64/
    libQt5WaylandClient.so.5.6.3)
[...]
Let's dig into this one first. The code that's identified in the error output is the following:
static std::shared_ptr<EglDisplay> GetAndInitDisplay(GLLibraryEGL& egl,
                                          void* displayType,
                                          EGLDisplay display = EGL_NO_DISPLAY) {
  if (display == EGL_NO_DISPLAY) {
    display = egl.fGetDisplay(displayType);
  }
  if (!display) return nullptr;
  return EglDisplay::Create(egl, display, false);
}
It's the call to egl.fGetDisplay() that we can see towards the top of the error backtrace. But note that there are two call stacks in the output. The first is for the data being read that leads to the code above, the second is for where the memory being accessed was previously deleted:
==29044==  Address 0x14c39ef0 is 0 bytes inside a block of size 40 free'd
==29044==    at 0x484EAD8: operator delete(void*, unsigned long) (
    vg_replace_malloc.c:935)
The error itself is "Invalid read of size 8" which makes sense: we're reading from memory that's no longer allocated. Checking the call stack, here's the code (it's specifically the call to fTerminate()) that frees the memory that's subsequently read:
EglDisplay::~EglDisplay() {
  fTerminate();
  mLib->mActiveDisplays.erase(mDisplay);
}
It looks like value of egl that's being passed into GetAndInitDisplay() is an instance of EglDisplay that has already been deleted. Not good.The reason the for the EGLDisplay being deleted is because of this call here:
  std::shared_ptr<EglDisplay> defaultDisplay = CreateDisplay(forceAccel,
    out_failureId, aDisplay);
It's presumably not the call to CreateDisplay() that's causing the deletion, but rather the replacement of the EGlDisplay contained in the shared_ptr with the one that's returned from it.In ESR 78 the logic around EglDisplay didn't exist. Back then there was just an EGLDisplay value, which is a pointer to an opaque EGL structure and which could be passed around everywhere. In ESR 91 an effort has been made to generalise this, so that multiple such displays can be handled simultaneously. As part of this move the value was wrapped in the similarly — but not identically — named EglDisplay, which contains an EGLDisplay pointer along with some other values and helper methods.
It looks like there's something going wrong with this. Disentangling it could be horrific, but there is something that works in our favour, which is that the two calls don't happen to far apart from one another.
In fact, the call stack for both seems to originate in this method:
inline std::shared_ptr<EglDisplay> DefaultEglDisplay(
    nsACString* const out_failureId) {
  const auto lib = DefaultEglLibrary(out_failureId);
  if (!lib) {
    return nullptr;
  }
  return lib->DefaultDisplay(out_failureId);
}
The call to DefaultEglLibrary() in this code ends up calling eglTerminate() which deletes the value. Then the call to DefaultDisplay() attempts to read the value in again. It reads the value that was just deleted, whereas it should — presumably — be using the newly created value.The actual failure is happening inside libEGL. I looked at the code there and, to be honest, it's not clear to me what the underlying reason is. Nevertheless, it's clear that there's something going wrong here in the gecko code that can be fixed and which should address it.
When the WebView is initialised it has to create an EGL display. Starting at the DefaultEglDisplay() method I copied out above there's a problem and the problem is that the display is created not once, but twice. To understand this, we have to note the fact that some time ago inside the GLLibraryEGL::Init() method I added the following code:
  std::shared_ptr<EglDisplay> defaultDisplay = CreateDisplay(forceAccel,
    out_failureId, aDisplay);
  if (!defaultDisplay) {
    return false;
  }
  mDefaultDisplay = defaultDisplay;
Why did I add this? It was to replace the following code which had been removed from ESR 78 by D85496 in order to "Support multiple EglDisplays per GLLibraryEGL":
  mEGLDisplay = CreateDisplay(forceAccel, gfxInfo, out_failureId, aDisplay);
  if (!mEGLDisplay) {
    return false;
  }
It seemed natural, when reversing some of the changes moving from ESR 78 to ER 91, to reintroduce the creation of the display, albeit it's now an EglDisplay wrapper rather than the EGLDisplay itself. I remember these changes being a huge source of angst back when I made them around Day 77.This piece of code is a problem for two reasons, which become clear when we follow the flow through DefaultEglDisplay():
- DefaultEglLibrary() is called. At this stage things are still being initialised and so there is no GLLibraryEGL just yet. As a result the code is called to create it.
- This leads to a call to GLLibraryEGL::Init() which initialises the library.
- Inside this Init() method the code I added to call CreateDisplay() is called, the intention being to mimic the behaviour of ESR 78.
- defaultDisplay is a shared pointer so when the assignment happens there's a call made to the EglDisplay destructor. I wasn't expecting this, but it seems to be borne out by what the debugger shows. This is the first problem: there should be no construction or destruction happening here apart from via the call to CreateDisplay().
- Execution continues until we return back into the body of the DefaultEglDisplay() method. The local lib variable now contains a usable GLLibraryEGL, off of which the DefaultDisplay() method is called.
- DefaultDisplay() then goes ahead and calls CreateDisplay() all over again in order to set up the default EGL display. This is the second problem: the display has already been created by this point; we shouldn't be doing it again.
(gdb) b EglDisplay::~EglDisplay
(gdb) b GetAndInitDisplay
(gdb) r
[...]
Thread 38 "Compositor" hit Breakpoint 4, mozilla::gl::
GetAndInitDisplay (egl=..., displayType=displayType@entry=0x0,
display=display@entry=0x0)
at ${PROJECT}/gecko-dev/gfx/gl/GLLibraryEGL.cpp:149
149 ${PROJECT}/gecko-dev/gfx/gl/GLLibraryEGL.cpp: No such file or directory.
(gdb) bt
#0 mozilla::gl::GetAndInitDisplay (egl=..., displayType=displayType@entry=0x0,
display=display@entry=0x0)
at ${PROJECT}/gecko-dev/gfx/gl/GLLibraryEGL.cpp:149
#1 0x0000007ff111c9c8 in mozilla::gl::GLLibraryEGL::CreateDisplay (
this=this@entry=0x7ed80031c0, forceAccel=forceAccel@entry=false,
out_failureId=out_failureId@entry=0x7fd40eb1c8, aDisplay=aDisplay@entry=0x0)
at ${PROJECT}/gecko-dev/gfx/gl/GLLibraryEGL.cpp:813
#2 0x0000007ff111cdb0 in mozilla::gl::GLLibraryEGL::Init (
this=this@entry=0x7ed80031c0, forceAccel=forceAccel@entry=false,
out_failureId=out_failureId@entry=0x7fd40eb1c8, aDisplay=aDisplay@entry=0x0)
at ${PROJECT}/gecko-dev/gfx/gl/GLLibraryEGL.cpp:504
#3 0x0000007ff111d5f8 in mozilla::gl::GLLibraryEGL::Create (
out_failureId=out_failureId@entry=0x7fd40eb1c8)
at ${PROJECT}/gecko-dev/gfx/gl/GLLibraryEGL.cpp:345
#4 0x0000007ff111d750 in mozilla::gl::DefaultEglLibrary (
out_failureId=out_failureId@entry=0x7fd40eb1c8)
at ${PROJECT}/gecko-dev/gfx/gl/GLContextProviderEGL.cpp:1331
[...]
#29 0x0000007ff6a0289c in thread_start () at ../sysdeps/unix/sysv/linux/aarch64/
clone.S:78
(gdb) c
Continuing.
Thread 38 "Compositor" hit Breakpoint 3, mozilla::gl::EglDisplay::
~EglDisplay (this=0x7ed8003550, __in_chrg=<optimized out>)
at ${PROJECT}/gecko-dev/gfx/gl/GLLibraryEGL.cpp:733
733 in ${PROJECT}/gecko-dev/gfx/gl/GLLibraryEGL.cpp
(gdb) bt
#0 mozilla::gl::EglDisplay::~EglDisplay (this=0x7ed8003550,
__in_chrg=<optimized out>)
at ${PROJECT}/gecko-dev/gfx/gl/GLLibraryEGL.cpp:733
#1 0x0000007ff111b52c in __gnu_cxx::new_allocator<mozilla::gl::EglDisplay>::
destroy<mozilla::gl::EglDisplay> (__p=<optimized out>, this=<optimized out>)
at include/c++/8.3.0/ext/new_allocator.h:140
#2 std::allocator_traits<std::allocator<mozilla::gl::EglDisplay> >::
destroy<mozilla::gl::EglDisplay> (__p=<optimized out>, __a=...)
at include/c++/8.3.0/bits/alloc_traits.h:487
#3 std::_Sp_counted_ptr_inplace<mozilla::gl::EglDisplay, std::
allocator<mozilla::gl::EglDisplay>, (__gnu_cxx::_Lock_policy)2>::_M_dispose
(
this=<optimized out>) at include/c++/8.3.0/bits/shared_ptr_base.h:554
#4 0x0000007ff1109f34 in std::_Sp_counted_base<(__gnu_cxx::_Lock_policy)2>::
_M_release (this=0x7ed8003540)
at include/c++/8.3.0/ext/atomicity.h:69
#5 0x0000007ff111d380 in std::__shared_count<(__gnu_cxx::_Lock_policy)2>::
~__shared_count (this=0x7fd40ea790, __in_chrg=<optimized out>)
at include/c++/8.3.0/bits/shared_ptr_base.h:1167
#6 std::__shared_ptr<mozilla::gl::EglDisplay, (__gnu_cxx::_Lock_policy)2>::
~__shared_ptr (this=0x7fd40ea788, __in_chrg=<optimized out>)
at include/c++/8.3.0/bits/shared_ptr_base.h:1167
#7 std::shared_ptr<mozilla::gl::EglDisplay>::~shared_ptr (this=0x7fd40ea788,
__in_chrg=<optimized out>)
at include/c++/8.3.0/bits/shared_ptr.h:103
#8 mozilla::gl::GLLibraryEGL::Init (this=this@entry=0x7ed80031c0,
forceAccel=forceAccel@entry=false,
out_failureId=out_failureId@entry=0x7fd40eb1c8,
aDisplay=aDisplay@entry=0x0) at ${PROJECT}/gecko-dev/gfx/gl/
GLLibraryEGL.cpp:504
#9 0x0000007ff111d5f8 in mozilla::gl::GLLibraryEGL::Create (
out_failureId=out_failureId@entry=0x7fd40eb1c8)
at ${PROJECT}/gecko-dev/gfx/gl/GLLibraryEGL.cpp:345
#10 0x0000007ff111d750 in mozilla::gl::DefaultEglLibrary (
out_failureId=out_failureId@entry=0x7fd40eb1c8)
at ${PROJECT}/gecko-dev/gfx/gl/GLContextProviderEGL.cpp:1331
[...]
#35 0x0000007ff6a0289c in thread_start () at ../sysdeps/unix/sysv/linux/aarch64/
clone.S:78
(gdb) c
Continuing.
Thread 38 "Compositor" hit Breakpoint 4, mozilla::gl::
GetAndInitDisplay (egl=..., displayType=displayType@entry=0x0,
display=display@entry=0x0)
at ${PROJECT}/gecko-dev/gfx/gl/GLLibraryEGL.cpp:149
149 in ${PROJECT}/gecko-dev/gfx/gl/GLLibraryEGL.cpp
(gdb) bt
#0 mozilla::gl::GetAndInitDisplay (egl=..., displayType=displayType@entry=0x0,
display=display@entry=0x0)
at ${PROJECT}/gecko-dev/gfx/gl/GLLibraryEGL.cpp:149
#1 0x0000007ff111c9c8 in mozilla::gl::GLLibraryEGL::CreateDisplay (
this=this@entry=0x7ed80031c0, forceAccel=forceAccel@entry=false,
out_failureId=out_failureId@entry=0x7fd40eb1c8, aDisplay=aDisplay@entry=0x0)
at ${PROJECT}/gecko-dev/gfx/gl/GLLibraryEGL.cpp:813
#2 0x0000007ff111d918 in mozilla::gl::GLLibraryEGL::DefaultDisplay (
this=0x7ed80031c0, out_failureId=out_failureId@entry=0x7fd40eb1c8)
at ${PROJECT}/gecko-dev/gfx/gl/GLLibraryEGL.cpp:745
#3 0x0000007ff112efc0 in mozilla::gl::DefaultEglDisplay (
out_failureId=0x7fd40eb1c8)
at ${PROJECT}/gecko-dev/gfx/gl/GLContextEGL.h:33
#4 mozilla::gl::GLContextProviderEGL::CreateHeadless (desc=...,
out_failureId=out_failureId@entry=0x7fd40eb1c8)
at ${PROJECT}/gecko-dev/gfx/gl/GLContextProviderEGL.cpp:1246
#5 0x0000007ff112f89c in mozilla::gl::GLContextProviderEGL::CreateOffscreen (
size=..., minCaps=...,
flags=flags@entry=mozilla::gl::CreateContextFlags::REQUIRE_COMPAT_PROFILE,
out_failureId=out_failureId@entry=0x7fd40eb1c8)
at ${PROJECT}/gecko-dev/gfx/gl/GLContextProviderEGL.cpp:1288
#6 0x0000007ff11982bc in mozilla::layers::CompositorOGL::CreateContext (
this=this@entry=0x7ed8002ed0)
at ${PROJECT}/gecko-dev/gfx/layers/opengl/CompositorOGL.cpp:254
[...]
#27 0x0000007ff6a0289c in thread_start () at ../sysdeps/unix/sysv/linux/aarch64/
clone.S:78
(gdb) c
[...]
Assuming that all of the above is correct, on the face of it there seems to be a simple solution, which is to remove the code I added to GLLibraryEGL::Init() which calls CreateDisplay(). An important consequence of this is that mDefaultDisplay will then no longer be set. We can't just set this inside DefaultEglDisplay() because that's in the wrong context. But it's already being set by GLLibraryEGL::DefaultDisplay(), which is in the right context (it's part of the GLLibraryEGL) and should be enough already.I'm about to make this change when something else peculiar jumps out at me. The call to GLLibraryEGL::DefaultDisplay() checks whether the value of mDefaultDisplay is valid and only calls CreateDisplay() to create a new one if it's not. That's strange, since the value should already have been set in GLLibraryEGL::Init(). The exception is if CreateDisplay() returns null. It is possible that this is what's causing this issue. Let's check:
(gdb) b GLLibraryEGL.cpp:504
Breakpoint 5 at 0x7ff111cd98: file ${PROJECT}/gecko-dev/gfx/gl/
    GLLibraryEGL.cpp, line 504.
(gdb) r
[...]
Thread 37 "Compositor" hit Breakpoint 6, mozilla::gl::GLLibraryEGL::
    Init (this=this@entry=0x7ee00031c0, forceAccel=forceAccel@entry=false,
    out_failureId=out_failureId@entry=0x7f1f7bf1c8, aDisplay=aDisplay@entry=0x0)
    at ${PROJECT}/gecko-dev/gfx/gl/GLLibraryEGL.cpp:504
504     ${PROJECT}/gecko-dev/gfx/gl/GLLibraryEGL.cpp: No such file or directory.
(gdb) p defaultDisplay
$14 = std::shared_ptr<mozilla::gl::EglDisplay> (use count -134204000, weak
    count 125) = {get() = 0x0}
(gdb) p mDefaultDisplay
$15 = std::weak_ptr<mozilla::gl::EglDisplay> (empty) = {get() = 0x0}
(gdb) n
505     in ${PROJECT}/gecko-dev/gfx/gl/GLLibraryEGL.cpp
(gdb) p defaultDisplay
$16 = std::shared_ptr<mozilla::gl::EglDisplay> (use count 1, weak count 1) =
    {get() = 0x7ee0003570}
(gdb) p mDefaultDisplay
$17 = std::weak_ptr<mozilla::gl::EglDisplay> (empty) = {get() = 0x0}
(gdb) n
508     in ${PROJECT}/gecko-dev/gfx/gl/GLLibraryEGL.cpp
(gdb) n
510     in ${PROJECT}/gecko-dev/gfx/gl/GLLibraryEGL.cpp
(gdb) p mDefaultDisplay
$18 = std::weak_ptr<mozilla::gl::EglDisplay> (use count 1, weak count 2) = {get(
    ) = 0x7ee0003570}
(gdb) p this
$19 = (mozilla::gl::GLLibraryEGL * const) 0x7ee00031c0
As we can see that's not what's happening. The actual reason is that when it comes to the call to GLLibraryEGL::DefaultDisplay() the pointer has expired and hence it's created all over again.
(gdb) b GLLibraryEGL::DefaultDisplay
Breakpoint 7 at 0x7ff111d7f4: file ${PROJECT}/gecko-dev/gfx/gl/
    GLLibraryEGL.cpp, line 741.
(gdb) c
Continuing.

Thread 37 "Compositor" hit Breakpoint 7, mozilla::gl::GLLibraryEGL::
    DefaultDisplay (this=0x7ee00031c0,
    out_failureId=out_failureId@entry=0x7f1f7bf1c8)
    at ${PROJECT}/gecko-dev/gfx/gl/GLLibraryEGL.cpp:741
741     in ${PROJECT}/gecko-dev/gfx/gl/GLLibraryEGL.cpp
(gdb) n
742     in ${PROJECT}/gecko-dev/gfx/gl/GLLibraryEGL.cpp
(gdb) p this
$20 = (mozilla::gl::GLLibraryEGL * const) 0x7ee00031c0
(gdb) p mDefaultDisplay
$21 = std::weak_ptr<mozilla::gl::EglDisplay> (expired, weak count 1) = {get() =
    0x7ee0003570}
(gdb) p ret
$22 = std::shared_ptr<mozilla::gl::EglDisplay> (use count 1634882661, weak
    count 25954) = {get() = 0x7f1f7bf160}
(gdb) n
745     in ${PROJECT}/gecko-dev/gfx/gl/GLLibraryEGL.cpp
(gdb)
The flow all makes sense now and the solution to all of these issues is the same: remove the code I added to Init(). As long as nothing is attempting to access the mDefaultDisplay before GLLibraryEGL::DefaultDisplay() is called, it should all work out fine.I've deleted the five lines. I've set the build running.
While that chugs away, let's briefly look at the other potentially relevant issue that valgrind threw up. This issue relates to APZCTreeManager::PrintAPZCInfo(). Although that doesn't sound especially relevant, the code is from the Compositor thread, so may be worth looking in to just in case.
==29044== Thread 32 Compositor:
==29044== Mismatched free() / delete / delete []
==29044==    at 0x484E858: operator delete(void*) (vg_replace_malloc.c:923)
==29044==    by 0x5CEFFFF: std::__cxx11::basic_stringstream<char, std::
    char_traits<char>, std::allocator<char> >::~basic_stringstream() (in /usr/
    lib64/libstdc++.so.6.0.25)
==29044==    by 0x767C23F: void mozilla::layers::APZCTreeManager::
    PrintAPZCInfo<mozilla::layers::LayerMetricsWrapper>(mozilla::layers::
    LayerMetricsWrapper const&, mozilla::layers::AsyncPanZoomController const*)
    (APZCTreeManager.cpp:1014)
==29044==    by 0x768DC63: mozilla::layers::HitTestingTreeNode* mozilla::layers:
    :APZCTreeManager::PrepareNodeForLayer<mozilla::layers::LayerMetricsWrapper>(
    mozilla::RecursiveMutexAutoLock const&, mozilla::layers::
    LayerMetricsWrapper const&, mozilla::layers::FrameMetrics const&, mozilla::
    layers::LayersId, mozilla::Maybe<mozilla::layers::ZoomConstraints> const&,
    mozilla::layers::AncestorTransform const&, mozilla::layers::
    HitTestingTreeNode*, mozilla::layers::HitTestingTreeNode*, mozilla::layers::
    APZCTreeManager::TreeBuildingState&) (APZCTreeManager.cpp:1323)
==29044==    by 0x768E55F: mozilla::layers::APZCTreeManager::
    UpdateHitTestingTreeImpl<mozilla::layers::LayerMetricsWrapper>(mozilla::
    layers::LayerMetricsWrapper const&, bool, mozilla::layers::LayersId,
    unsigned int)::{lambda(mozilla::layers::LayerMetricsWrapper)#2}::operator()(
    mozilla::layers::LayerMetricsWrapper) const (APZCTreeManager.cpp:481)
[...]

==29044==  Address 0x18c00050 is 0 bytes inside a block of size 513 alloc'd
==29044==    at 0x484B7C0: malloc (vg_replace_malloc.c:381)
==29044==    by 0x48F61EB: moz_xmalloc (in /usr/lib64/
    libqt5embedwidget.so.1.53.9)
==29044==    by 0x48F644B: std::__cxx11::basic_string<char, std::
    char_traits<char>, std::allocator<char> >::_M_create(unsigned long&,
    unsigned long) (in /usr/lib64/libqt5embedwidget.so.1.53.9)
==29044==    by 0x5CFC2E7: std::__cxx11::basic_string<char, std::
    char_traits<char>, std::allocator<char> >::reserve(unsigned long) (in /usr/
    lib64/libstdc++.so.6.0.25)
==29044==    by 0x5CF14D7: std::__cxx11::basic_stringbuf<char, std::
    char_traits<char>, std::allocator<char> >::overflow(int) (in /usr/lib64/
    libstdc++.so.6.0.25)
==29044==    by 0x5CFA7B7: std::basic_streambuf<char, std::char_traits<char> >::
    xsputn(char const*, long) (in /usr/lib64/libstdc++.so.6.0.25)
==29044==    by 0x5CEC1AB: std::basic_ostream<char, std::char_traits<char> >&
    std::__ostream_insert<char, std::char_traits<char> >(std::
    basic_ostream<char, std::char_traits<char> >&, char const*, long) (in /usr/
    lib64/libstdc++.so.6.0.25)
==29044==    by 0x765AC0B: operator<< <std::char_traits<char> > (ostream:561)
==29044==    by 0x765AC0B: mozilla::layers::operator<<(std::ostream&, mozilla::
    layers::ScrollableLayerGuid const&) (ScrollableLayerGuid.cpp:52)
==29044==    by 0x767BE3F: void mozilla::layers::APZCTreeManager::
    PrintAPZCInfo<mozilla::layers::LayerMetricsWrapper>(mozilla::layers::
    LayerMetricsWrapper const&, mozilla::layers::AsyncPanZoomController const*)
    (APZCTreeManager.cpp:1015)
==29044==    by 0x768DC63: mozilla::layers::HitTestingTreeNode* mozilla::layers:
    :APZCTreeManager::PrepareNodeForLayer<mozilla::layers::LayerMetricsWrapper>(
    mozilla::RecursiveMutexAutoLock const&, mozilla::layers::
    LayerMetricsWrapper const&, mozilla::layers::FrameMetrics const&, mozilla::
    layers::LayersId, mozilla::Maybe<mozilla::layers::ZoomConstraints> const&,
    mozilla::layers::AncestorTransform const&, mozilla::layers::
    HitTestingTreeNode*, mozilla::layers::HitTestingTreeNode*, mozilla::layers::
    APZCTreeManager::TreeBuildingState&) (APZCTreeManager.cpp:1323)
[...]
The definition of the APZCTreeManager::PrintAPZCInfo() method that's referred to in the output above looks like this:
template <class ScrollNode>
void APZCTreeManager::PrintAPZCInfo(const ScrollNode& aLayer,
const AsyncPanZoomController* apzc) {
const FrameMetrics& metrics = aLayer.Metrics();
std::stringstream guidStr;
guidStr << apzc->GetGuid();
mApzcTreeLog << "APZC " << guidStr.str()
<< "\tcb=" << metrics.GetCompositionBounds()
<< "\tsr=" << metrics.GetScrollableRect()
<< (metrics.IsScrollInfoLayer() ? "\tscrollinfo" :
"")
<< (apzc->HasScrollgrab() ? "\tscrollgrab" :
"") << "\t"
<< aLayer.Metadata().GetContentDescription().get();
}
There may be something to do here, but this is so far removed from the rendering pipeline that I don't see how it can be related to the issues I'm trying to fix. So I'm going to ignore this one and potentially come back to it later. I'm thinking there's some work to be done cleaning up the valgrind output and if I do eventually do so, this would fall under that.It's been a long one today and I apologise for that. Sometimes it takes a lot to unravel the code and structure my thoughts around it. The key question now is whether the small change I've made will make any difference to the rendering. We'll find that out tomorrow.
If you'd like to read any of my other gecko diary entries, they're all available on my Gecko-dev Diary page.
18 Mar 2024 : Day 189 #
The memory graphs we looked at yesterday told a different story to the one we were expecting. The memory usage didn't shoot through the roof, instead stay stable at between 200-250 MB. So if memory allocation isn't the problem, it does beg the question of what is. It could be that it's graphics related, that is, to do with the way GL and EGL textures are being created and destroyed.
Despite this I still think it may be worthwhile running the harbour-webview app through valgrind. Valgrind is a debugging tool that, amongst other tricks, will tell you the state of the memory when the application is exited. In case some portion of the allocated memory isn't freed up at the end, it will highlight the fact. It'll also tell you all sorts of other useful memory information. But crucially, if memory isn't being freed, then that's typically a sign of a memory leak.
In the case of EmbedLite the memory management is pretty flaky, making it hard to disentangle what's normal from what's exceptional. I've nevertheless collected valgrind logs from both harbour-webview and sailfish-browser. I did this on both ESR 78 and ESR 91 in the hope that performing some kind of comparison might be useful. First on my phone running ESR 78:
There are multiple mismatched frees related to QMozViewPrivate::createView(), android_dlopen(), do_dlopen(), QCoreApplicationPrivate::sendPostedEvents(), QMozSecurity, QSGNode::destroy(), QMozContext and others. These all look unrelated to the parts of the code I'm looking at, plus they also appear for both ESR 78 and ESR 91. So I'm going to leave those to one side for now. It may be that there's some useful work to be done cleaning all of these up, but I don't believe they relate to the rendering issues I'm experiencing.
There are also a collection of memory bugs that happen in the Compositor thread. These are far more likely to relate to the changes I've been looking at. There are some that reference CompositorOGL::GetShaderProgramFor(), but which appear for both ESR 78 and ESR 91. Given they're in both, I think I'll ignore those as well.
There are four further errors which I can see appear in ESR 91 but not ESR 78. These are the ones I want to focus on. The first one doesn't seem to be directly associated with the gecko code. It references EGL, so it's possible it's related, but without something more concrete I'm not sure what to do with it.
If you'd like to read any of my other gecko diary entries, they're all available on my Gecko-dev Diary page.
Comment
Despite this I still think it may be worthwhile running the harbour-webview app through valgrind. Valgrind is a debugging tool that, amongst other tricks, will tell you the state of the memory when the application is exited. In case some portion of the allocated memory isn't freed up at the end, it will highlight the fact. It'll also tell you all sorts of other useful memory information. But crucially, if memory isn't being freed, then that's typically a sign of a memory leak.
In the case of EmbedLite the memory management is pretty flaky, making it hard to disentangle what's normal from what's exceptional. I've nevertheless collected valgrind logs from both harbour-webview and sailfish-browser. I did this on both ESR 78 and ESR 91 in the hope that performing some kind of comparison might be useful. First on my phone running ESR 78:
$ valgrind --log-file=valgrind-harbour-webview-esr78-01.txt harbour-webview
$ valgrind --log-file=valgrind-sailfish-browser-esr78-01.txt sailfish-browser
And then following that on a different phone running ESR 91:
$ valgrind --log-file=valgrind-harbour-webview-esr91-01.txt harbour-webview
$ valgrind --log-file=valgrind-sailfish-browser-esr91-01.txt sailfish-browser
The task now is to manually compare the two. The ESR 91 valgrind output shows a lot of errors:
==29044== ERROR SUMMARY: 7057 errors from 159 contexts (suppressed: 0 from 0)That's more than the number of errors in the ESR 78 output, but it's not an order of magnitude different:
==17128== ERROR SUMMARY: 5737 errors from 155 contexts (suppressed: 0 from 0)Skimming through, there are a lot of mismatched frees shown for QtWaylandClient; in fact this seems to be the majority of them. However these appear for both ESR 78 and ESR 91. I don't recommend it, but if you'd like to take a look yourself I've uploaded both the ESR 78 valgrind output and the ESR 91 valdgrind output and you're very welcome to take a look yourself. You might spot something I missed.
There are multiple mismatched frees related to QMozViewPrivate::createView(), android_dlopen(), do_dlopen(), QCoreApplicationPrivate::sendPostedEvents(), QMozSecurity, QSGNode::destroy(), QMozContext and others. These all look unrelated to the parts of the code I'm looking at, plus they also appear for both ESR 78 and ESR 91. So I'm going to leave those to one side for now. It may be that there's some useful work to be done cleaning all of these up, but I don't believe they relate to the rendering issues I'm experiencing.
There are also a collection of memory bugs that happen in the Compositor thread. These are far more likely to relate to the changes I've been looking at. There are some that reference CompositorOGL::GetShaderProgramFor(), but which appear for both ESR 78 and ESR 91. Given they're in both, I think I'll ignore those as well.
There are four further errors which I can see appear in ESR 91 but not ESR 78. These are the ones I want to focus on. The first one doesn't seem to be directly associated with the gecko code. It references EGL, so it's possible it's related, but without something more concrete I'm not sure what to do with it.
==29044== Mismatched free() / delete / delete []
==29044==    at 0x484E2B8: free (vg_replace_malloc.c:872)
==29044==    by 0x15CE6943: ??? (in /usr/libexec/droid-hybris/system/lib64/
    libEGL.so)
==29044==    by 0x15CE590B: ??? (in /usr/libexec/droid-hybris/system/lib64/
    libEGL.so)
==29044==    by 0x15CE523F: ??? (in /usr/libexec/droid-hybris/system/lib64/
    libEGL.so)
==29044==    by 0x15CDC4BF: ??? (in /usr/libexec/droid-hybris/system/lib64/
    libEGL.so)
==29044==    by 0x15CDC7A3: eglGetDisplay (in /usr/libexec/droid-hybris/system/
    lib64/libEGL.so)
==29044==    by 0xCCF63AF: ??? (in /usr/lib64/libEGL.so.1.0.0)
==29044==    by 0x14960F73: ??? (in /usr/lib64/qt5/plugins/
    wayland-graphics-integration-client/libwayland-egl.so)
==29044==    by 0x14778947: QtWaylandClient::QWaylandIntegration::
    initializeClientBufferIntegration() (in /usr/lib64/
    libQt5WaylandClient.so.5.6.3)
==29044==    by 0x14778C6F: QtWaylandClient::QWaylandIntegration::
    clientBufferIntegration() const (in /usr/lib64/libQt5WaylandClient.so.5.6.3)
==29044==    by 0x147784F3: QtWaylandClient::QWaylandIntegration::hasCapability(
    QPlatformIntegration::Capability) const (in /usr/lib64/
    libQt5WaylandClient.so.5.6.3)
==29044==    by 0x4B3EA1F: QSGRenderLoop::instance() (in /usr/lib64/
    libQt5Quick.so.5.6.3)
==29044==  Address 0x14bd40c0 is 0 bytes inside a block of size 48 alloc'd
==29044==    at 0x484BD54: operator new(unsigned long) (vg_replace_malloc.c:420)
==29044==    by 0x15A5C167: ??? (in /usr/libexec/droid-hybris/system/lib64/
    libc++.so)
Similarly, although the following is apparently happening in the Compositor thread, I don't see a way to tie it to the gecko code.
==29044== Mismatched free() / delete / delete []
==29044==    at 0x484E2B8: free (vg_replace_malloc.c:872)
==29044==    by 0x174836EF: ??? (in /odm/lib64/libllvm-glnext.so)
==29044==  Address 0x2156db90 is 0 bytes inside a block of size 48 alloc'd
==29044==    at 0x484BD54: operator new(unsigned long) (vg_replace_malloc.c:420)
==29044==    by 0x163E9167: std::__1::basic_string<char, std::__1::
    char_traits<char>, std::__1::allocator<char> >::__grow_by_and_replace(
    unsigned long, unsigned long, unsigned long, unsigned long, unsigned long,
    unsigned long, char const*) (in /apex/com.android.vndk.v30/lib64/libc++.so)
==29044==    by 0x163E9273: std::__1::basic_string<char, std::__1::
    char_traits<char>, std::__1::allocator<char> >::append(char const*) (in /
    apex/com.android.vndk.v30/lib64/libc++.so)
==29044==    by 0x17483623: ??? (in /odm/lib64/libllvm-glnext.so)
That leaves two remaining issues, both occurring in the Compositor thread. These look like the most promising avenues to look into, but I'm not going to look at them today; they'll need a bit more time than I have right now. I'll give full details and start working through them tomorrow.If you'd like to read any of my other gecko diary entries, they're all available on my Gecko-dev Diary page.
17 Mar 2024 : Day 188 #
I was still trying to find memory leaks yesterday, although I came to the conclusion that it may not be a memory leak causing the problem after all. I need to continue investigating to try to get a clearer picture, there are a couple of obvious things to try.
One approach worth trying is running the app through valgrind. I'm not super-hopeful that this will yield helpful results because gecko struggles to maintain a healthy memory map at the best of times. As a result valgrind is likely to generate a huge number of results, most of which are just the consequence of "normal" (for some definition of the word) EmbedLite behaviour and so unrelated to the problem I'm trying to fix.
So before trying out valgrind I'm going to try something simpler. That is, I thought I'd just measure the memory usage and see whether it's growing out of control, or remaining stable.
There are many ways to check memory usage: tops might be one way. But as I'm writing this up as a diary entry I thought it would be better to generate some graphs. This will also give a more concrete idea of what's happening over time.
There's also no shortage of tools for generating memory usage graphs. I've plumped for psrecord, a small Python tool, since it's easy to install and use and generates nice clean graphs of memory usage against time.
The fact it's so easy to install and run a random Python utility is one of the things I really love about Sailfish OS. All I have to do is drop to a shell (I usually have an SSH session running already anyway), create a virtual environment and use pip to install it:
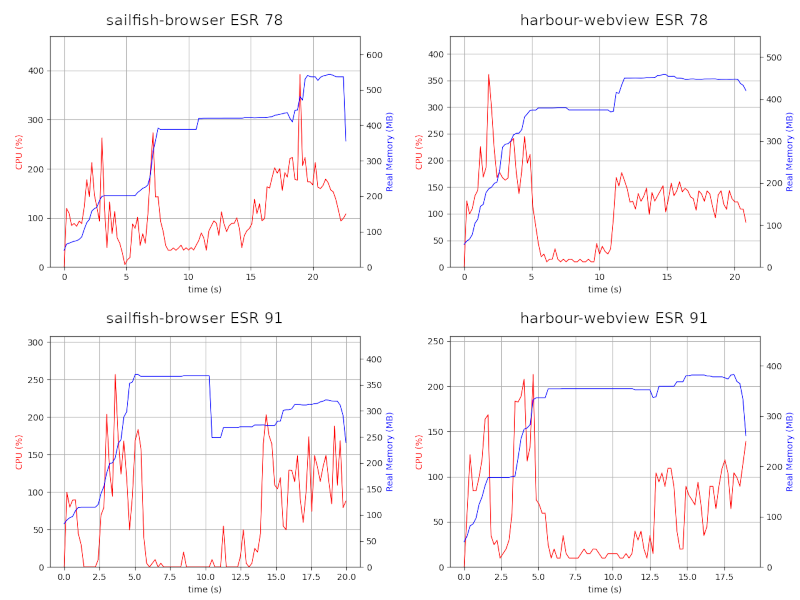
What do we find from these? With both ESR 78 and ESR 91 the browser increases memory to around 250-300 MB. It's nice to see that the memory footprint on ESR 91 is no higher than for ESR 78, in fact if anything it's lower. ESR 78 seems to accumulate memory until the app is shut down, whereas ESR 91 is more consistent.
We see a similar pattern for the WebView. ESR 78 quickly rises to 300 MB of memory usage before jumping up to 350 MB when I start scrolling the page. On ESR 91 the memory rapidly climbs to 200 MB where it stays pretty consistently throughout. Scrolling does cause some memory jitter, but not as much as on ESR 78.
This is all both encouraging and discouraging. It's encouraging to see ESR 91 isn't more of a memory hog than ESR 78. If anything it seems to be leaner. It's discouraging because the lack of excessive memory usage on ESR 91 suggests I may be looking in the wrong place for the solution to the issue I'm trying to solve.
Is that discouraging? Maybe it's encouraging. I have more information than I had before, but in truth I don't feel closer to finding a solution.
I spent a surprising amount of time investigating different ways to collect memory usage data. On top of that generating the graphs also took a whole, given it involved using two different phones and two different apps on each. So I'm going to call it a day. I still want to run the apps through valgrind — maybe this will pick up something new — but I'm going to leave that task until tomorrow.
If you'd like to read any of my other gecko diary entries, they're all available on my Gecko-dev Diary page.
Comment
One approach worth trying is running the app through valgrind. I'm not super-hopeful that this will yield helpful results because gecko struggles to maintain a healthy memory map at the best of times. As a result valgrind is likely to generate a huge number of results, most of which are just the consequence of "normal" (for some definition of the word) EmbedLite behaviour and so unrelated to the problem I'm trying to fix.
So before trying out valgrind I'm going to try something simpler. That is, I thought I'd just measure the memory usage and see whether it's growing out of control, or remaining stable.
There are many ways to check memory usage: tops might be one way. But as I'm writing this up as a diary entry I thought it would be better to generate some graphs. This will also give a more concrete idea of what's happening over time.
There's also no shortage of tools for generating memory usage graphs. I've plumped for psrecord, a small Python tool, since it's easy to install and use and generates nice clean graphs of memory usage against time.
The fact it's so easy to install and run a random Python utility is one of the things I really love about Sailfish OS. All I have to do is drop to a shell (I usually have an SSH session running already anyway), create a virtual environment and use pip to install it:
$ python3 -m venv venv
$ . ./venv/bin/activate
$ pip install --upgrade pip
$ pip install psrecord matplotlib
Beautiful! I'm sure there's a nice way to use Python on Android (using Termux?) and iOS (Pythonista?) but I'm not sure I'd be able to install and use psrecord quite so easily.
$ harbour-webview & psrecord --plot mem-harbour-webview-esr91.png \
    --interval 0.2 "$!"
$ sailfish-browser & psrecord --plot mem-sailfish-browser-esr91.png \
    --interval 0.2 "$!"
Then, when I'm done, I can deactivate and delete the virtual environment to restore my phone to its previous state.
$ deactivate
$ rm -rf venv
The resulting graphs are pretty clear, giving both memory usage in MB and CPU usage as a percentage of the total available. We're really only interested in memory usage though. For context, these graphs were collected by running each of the apps for 20 seconds. After 10 seconds I started scrolling the page up and down with my finger, since the problem doesn't seem to manifest itself when the display is static.
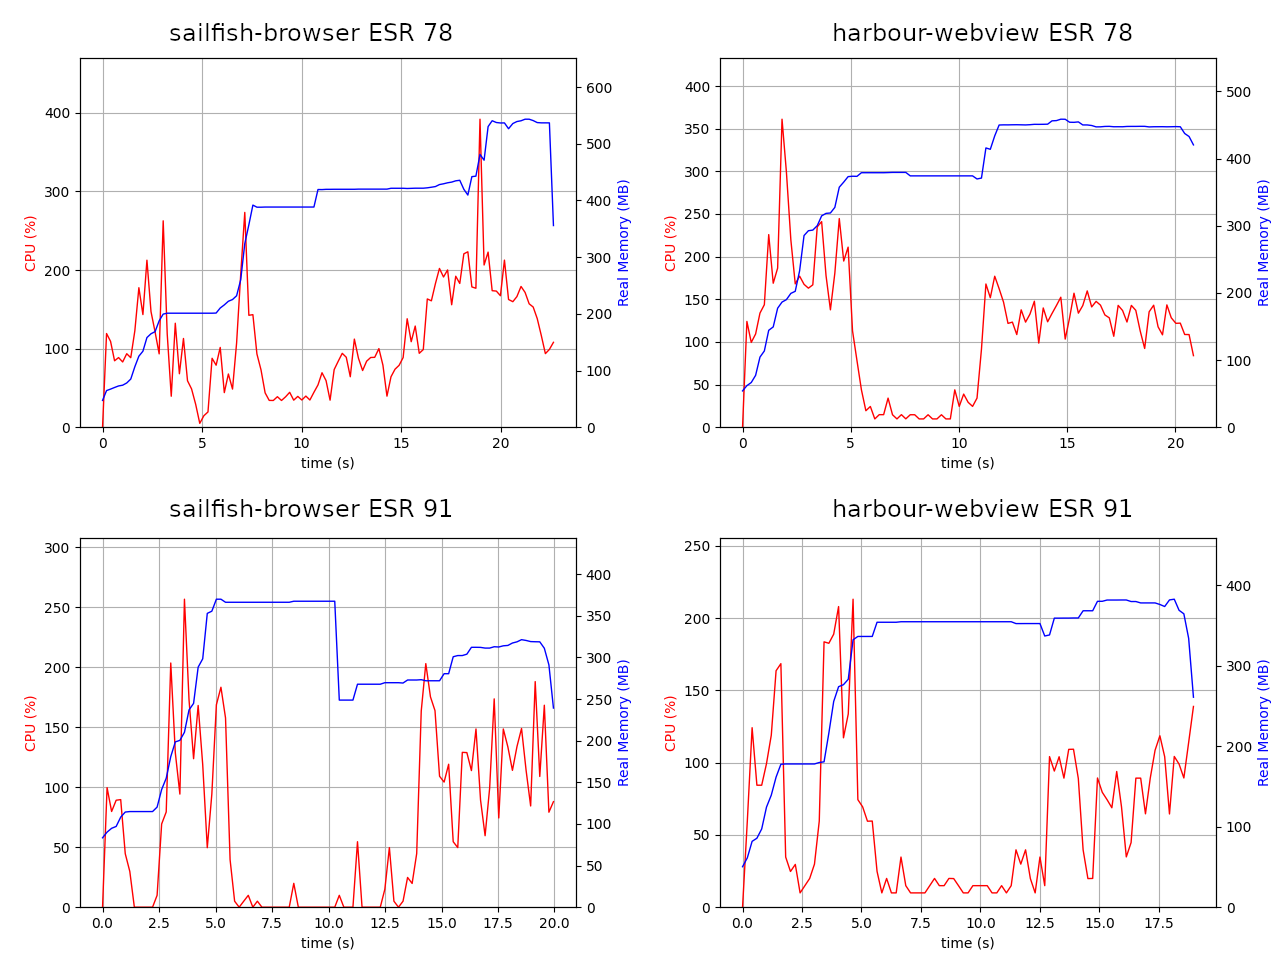
What do we find from these? With both ESR 78 and ESR 91 the browser increases memory to around 250-300 MB. It's nice to see that the memory footprint on ESR 91 is no higher than for ESR 78, in fact if anything it's lower. ESR 78 seems to accumulate memory until the app is shut down, whereas ESR 91 is more consistent.
We see a similar pattern for the WebView. ESR 78 quickly rises to 300 MB of memory usage before jumping up to 350 MB when I start scrolling the page. On ESR 91 the memory rapidly climbs to 200 MB where it stays pretty consistently throughout. Scrolling does cause some memory jitter, but not as much as on ESR 78.
This is all both encouraging and discouraging. It's encouraging to see ESR 91 isn't more of a memory hog than ESR 78. If anything it seems to be leaner. It's discouraging because the lack of excessive memory usage on ESR 91 suggests I may be looking in the wrong place for the solution to the issue I'm trying to solve.
Is that discouraging? Maybe it's encouraging. I have more information than I had before, but in truth I don't feel closer to finding a solution.
I spent a surprising amount of time investigating different ways to collect memory usage data. On top of that generating the graphs also took a whole, given it involved using two different phones and two different apps on each. So I'm going to call it a day. I still want to run the apps through valgrind — maybe this will pick up something new — but I'm going to leave that task until tomorrow.
If you'd like to read any of my other gecko diary entries, they're all available on my Gecko-dev Diary page.
16 Mar 2024 : Day 187 #
Yesterday I was struggling. And getting this WebView render pipeline working is starting to feel drawn out. I don't want to make any claims about the larger task, but I'm hoping that a good night's sleep and some time to ponder on the best approach in the shower this morning will have helped me focus on the task I'm struggling with.
And this task is figuring out what — if anything &mash; is different between the execution of TextureClient::Destroy() on ESR 78 compared to ESR 91. I'm still labouring under the hypothesis that it's this method that's causing the (hypothetical) memory leak that's causing ESR 91 execution to seize up over time.
The difficulties I experienced yesterday were twofold. First on ESR 78 the actual section of code that reclaims the allocated memory appeared never to be executed. Second applying the debugger to ESR 91 gave peculiar results: what appeared to be an infinite loop of calls to Destroy() that never allowed me to step in to the method.
To tackle these difficulties I'm going to try two things. First I need to stick a breakpoint inside the conditional code that reclaims the memory on ESR 78, to establish whether it ever gets called. Second I'm going to annotate the ESR 91 code with debug prints. That should allow me to get a better idea of the true execution flow. If the debugger isn't playing by the rules, I'll take my ball somewhere else.
So, first up, checking the ESR 78 flow. The structure of the Destroy() method looks like this on ESR 78:
The reason I've never seen it enter this condition is because data (which is derived from the mData class variable) and actor (which is derived from the mActor class variable) have always been null when entering this method.
Let's do this then.
Let's now try the same thing on ESR 91.
To return to our original questions, I think this has answered both of them. First we can see that on ESR 78 this is definitely a place where memory is actually being freed. But on the other hand we also see it being freed on ESR 91. That doesn't mean that there isn't a problem here, but it does make it less likely.
Nevertheless there has been a change to this code. The mWorkaroundAnnoyingSharedSurfaceLifetimeIssues flag was removed by upstream. It's possible that this is causing the issue we're experiencing, so I'm going to reverse this and reinsert the removed code. I'm not really expecting this to fix things, but having travelled out into the sticks I now need to check under every stone. I've no choice but to figure this thing out if the WebView is going to get back up and running again.
[...]
Having worked carefully through the code and reintroduced the mWorkaroundAnnoyingSharedSurfaceLifetimeIssues variable and its associated logic, it's disappointing to find it's not fixed the issue. I'm not out of ideas yet though. Tomorrow I'm going to have a go at profiling the application and using specific memory tools (e.g. valgrind) to try to figure out which memory is being allocated but not deallocated. I'm not sure I hold out much hope of success using valgrind given that gecko is so big and messy and suffering from leakage as it is, but you never know.
If you'd like to read any of my other gecko diary entries, they're all available on my Gecko-dev Diary page.
Comment
And this task is figuring out what — if anything &mash; is different between the execution of TextureClient::Destroy() on ESR 78 compared to ESR 91. I'm still labouring under the hypothesis that it's this method that's causing the (hypothetical) memory leak that's causing ESR 91 execution to seize up over time.
The difficulties I experienced yesterday were twofold. First on ESR 78 the actual section of code that reclaims the allocated memory appeared never to be executed. Second applying the debugger to ESR 91 gave peculiar results: what appeared to be an infinite loop of calls to Destroy() that never allowed me to step in to the method.
To tackle these difficulties I'm going to try two things. First I need to stick a breakpoint inside the conditional code that reclaims the memory on ESR 78, to establish whether it ever gets called. Second I'm going to annotate the ESR 91 code with debug prints. That should allow me to get a better idea of the true execution flow. If the debugger isn't playing by the rules, I'll take my ball somewhere else.
So, first up, checking the ESR 78 flow. The structure of the Destroy() method looks like this on ESR 78:
void TextureClient::Destroy() {
[...]
  RefPtr<TextureChild> actor = mActor;
[...]
  TextureData* data = mData;
  if (!mWorkaroundAnnoyingSharedSurfaceLifetimeIssues) {
    mData = nullptr;
  }

  if (data || actor) {
[...]
    DeallocateTextureClient(params);
  }
}
I'm interested in whether it ever goes inside the condition at the end in order to ultimately call DeallocateTextureClient(). If it doesn't — or if this only happens occasionally, say on shutdown — then I'm likely to be looking in the wrong place.The reason I've never seen it enter this condition is because data (which is derived from the mData class variable) and actor (which is derived from the mActor class variable) have always been null when entering this method.
Let's do this then.
(gdb) break TextureClient.cpp:583
Breakpoint 5 at 0x7fb8e9b2fc: file gfx/layers/client/TextureClient.cpp, line
585.
(gdb) r
[...]
Thread 7 "GeckoWorkerThre" hit Breakpoint 5, mozilla::layers::
TextureClient::Destroy (this=this@entry=0x7f8ea53bb0)
at gfx/layers/client/TextureClient.cpp:585
585 params.allocator = mAllocator;
(gdb) c
Continuing.
[LWP 16174 exited]
Thread 7 "GeckoWorkerThre" hit Breakpoint 5, mozilla::layers::
TextureClient::Destroy (this=this@entry=0x7f8effa780)
at gfx/layers/client/TextureClient.cpp:585
585 params.allocator = mAllocator;
(gdb) p mWorkaroundAnnoyingSharedSurfaceLifetimeIssues
$21 = false
(gdb) p data
$22 = (mozilla::layers::TextureData *) 0x7f8dac3a70
(gdb) p actor
$23 = <optimized out>
(gdb) b DeallocateTextureClient
Breakpoint 6 at 0x7fb8e9a908: file gfx/layers/client/TextureClient.cpp, line
490.
(gdb) c
Continuing.
Thread 7 "GeckoWorkerThre" hit Breakpoint 6, mozilla::layers::
DeallocateTextureClient (params=...)
at gfx/layers/client/TextureClient.cpp:490
490 void DeallocateTextureClient(TextureDeallocParams params) {
(gdb) p params
$24 = {data = 0x7f8dac3a70, actor = {mRawPtr = 0x7f8d648720}, allocator =
{mRawPtr = 0x7f8cb40ff8}, clientDeallocation = false, syncDeallocation =
false, workAroundSharedSurfaceOwnershipIssue = false}
(gdb) n
491 if (!params.actor && !params.data) {
(gdb) n
324 obj-build-mer-qt-xr/dist/include/nsCOMPtr.h: No such file or directory.
(gdb) n
499 if (params.allocator) {
(gdb) n
500 ipdlThread = params.allocator->GetThread();
(gdb) n
501 if (!ipdlThread) {
(gdb) n
510 if (ipdlThread && !ipdlThread->IsOnCurrentThread()) {
(gdb) n
532 if (!ipdlThread) {
(gdb) n
540 if (!actor) {
(gdb) n
555 actor->Destroy(params);
(gdb) n
497 nsCOMPtr<nsISerialEventTarget> ipdlThread;
(gdb) n
505 return;
(gdb) c
Continuing.
[...]
So that clears things up: it does go inside the condition and it does deallocate the actor. But the data and actor values are non-null and ultimately in this case because we're executing on the IPDL thread, the actor is destroyed directly.Let's now try the same thing on ESR 91.
(gdb) break TextureClient.cpp:574
Breakpoint 4 at 0x7ff1148ddc: TextureClient.cpp:574. (2 locations)
(gdb) r
[...]
Thread 7 "GeckoWorkerThre" hit Breakpoint 4, mozilla::layers::
TextureClient::Destroy (this=this@entry=0x7fc5612680)
at gfx/layers/client/TextureClient.cpp:587
587 if (actor) {
(gdb) c
Continuing.
Thread 7 "GeckoWorkerThre" hit Breakpoint 4, mozilla::layers::
TextureClient::Destroy (this=this@entry=0x7fc55b8690)
at gfx/layers/client/TextureClient.cpp:587
587 if (actor) {
(gdb) c
Continuing.
Thread 7 "GeckoWorkerThre" hit Breakpoint 4, mozilla::layers::
TextureClient::Destroy (this=this@entry=0x7fc55b6c10)
at gfx/layers/client/TextureClient.cpp:587
587 if (actor) {
(gdb) p data
$12 = (mozilla::layers::TextureData *) 0x7fc4d79e80
(gdb) p actor
$13 = <optimized out>
(gdb) b DeallocateTextureClient
Breakpoint 5 at 0x7ff1148394: file gfx/layers/client/TextureClient.cpp, line
489.
(gdb) c
Continuing.
Thread 7 "GeckoWorkerThre" hit Breakpoint 5, mozilla::layers::
DeallocateTextureClient (params=...)
at gfx/layers/client/TextureClient.cpp:489
489 void DeallocateTextureClient(TextureDeallocParams params) {
(gdb) p params
$14 = {data = 0x7fc4d79e80, actor = {mRawPtr = 0x7fc59e6620}, allocator =
{mRawPtr = 0x7fc46684e0}, clientDeallocation = false, syncDeallocation =
false}
(gdb) n
490 if (!params.actor && !params.data) {
(gdb) n
496 nsCOMPtr<nsISerialEventTarget> ipdlThread;
(gdb) n
[New LWP 5954]
498 if (params.allocator) {
(gdb) n
499 ipdlThread = params.allocator->GetThread();
(gdb) n
[LWP 5954 exited]
[New LWP 6110]
500 if (!ipdlThread) {
(gdb) n
509 if (ipdlThread && !ipdlThread->IsOnCurrentThread()) {
(gdb) n
[LWP 6110 exited]
867 ${PROJECT}/obj-build-mer-qt-xr/dist/include/nsCOMPtr.h: No such file or
directory.
(gdb) n
539 if (!actor) {
(gdb) n
548 actor->Destroy(params);
(gdb) n
496 nsCOMPtr<nsISerialEventTarget> ipdlThread;
(gdb) n
mozilla::layers::TextureClient::Destroy (this=this@entry=0x7fc55b6c10)
at gfx/layers/client/TextureClient.cpp:591
591 DeallocateTextureClient(params);
(gdb) c
Continuing.
[...]
Here we see something similar. The inner condition is entered and the DeallocateTextureClient() method is ultimately called on the same thread. The data and actor values are both non-null.To return to our original questions, I think this has answered both of them. First we can see that on ESR 78 this is definitely a place where memory is actually being freed. But on the other hand we also see it being freed on ESR 91. That doesn't mean that there isn't a problem here, but it does make it less likely.
Nevertheless there has been a change to this code. The mWorkaroundAnnoyingSharedSurfaceLifetimeIssues flag was removed by upstream. It's possible that this is causing the issue we're experiencing, so I'm going to reverse this and reinsert the removed code. I'm not really expecting this to fix things, but having travelled out into the sticks I now need to check under every stone. I've no choice but to figure this thing out if the WebView is going to get back up and running again.
[...]
Having worked carefully through the code and reintroduced the mWorkaroundAnnoyingSharedSurfaceLifetimeIssues variable and its associated logic, it's disappointing to find it's not fixed the issue. I'm not out of ideas yet though. Tomorrow I'm going to have a go at profiling the application and using specific memory tools (e.g. valgrind) to try to figure out which memory is being allocated but not deallocated. I'm not sure I hold out much hope of success using valgrind given that gecko is so big and messy and suffering from leakage as it is, but you never know.
If you'd like to read any of my other gecko diary entries, they're all available on my Gecko-dev Diary page.
15 Mar 2024 : Day 186 #
Today I'm still searching for memory leaks and one memory leak in particular: after fixing the SurfaceFactory_EGLImage::Create() which, as the name implies, creates EGL surface textures, there's now a massive memory leak that grinds not just the browser but the entire phone to a halt.
I'm hypothesising that there's something created by the method that should get freed. The texture itself is the most likely culprit, since even just a few 1080 by 2520 textures are going to consume a lot of memory. Generate a few of those each frame without freeing them and bad things will happen.
We're definitely seeing bad things happen, so this is my guess. However yesterday I checked a few of the associated destructors and they seem to be getting called.
So today I'm going to try to tackle it from a different angle. Rather than try to figure out what's not getting freed I'm going to try to find out what's causing the crash. I've started off by adjusting the size of the texture created as part of the render loop. Rather than a 1080 by 2520 texture, I've set it to always generate an 8 by 8 texture, by altering this code from GLContext.cpp (the commented part is the old code, replaced by the equivalent lines directly below):
While the updated code builds and gets transferred over to my phone I can continue looking through the code. Here's the backtrace from the SharedSurface_EGLImage::Create() method, the change to which has triggered the memory leak. It's possible, maybe even likely, that the code for reclaiming the resources will live somewhere in or close to the methods in this stack.
My new binary has copied over to my phone. The running app exhibits very similar symptoms as before: responsive at first but quickly seizes up and becoming unresponsive. I killed the process before it took down my phone, but a visual check suggests reducing the texture size didn't have any obvious benefit.
Back to looking through the code, I'm working through SharedSurfaceTextureClient::~SharedSurfaceTextureClient() and I notice this method called Destroy(). Although it's not immediately clear from the way the code is written, this call actually goes through to TextureClient::Destroy(). I recall making changes to this and scanning through my notes confirms it: it was back on Day 176. At the time I wrote this:
Could it be that the changes I made back then are causing the issues I'm experiencing now?
While I can step through the ESR 78 build, unfortunately all of changes integrated using partial builds have messed up the debug source for the ESR 91 build. Stepping through gives me just a slew of useless "TextureClientSharedSurface.cpp: No such file or directory." messages. So I've decided to kick off a full build. With a bit of luck it'll be completed before the end of the day and I'll be able to come back to this in the evening to compare the two executing flows by stepping through them.
[...]
It was just before 9:00 this morning that I set the build going. I could well imagine it running into the night and leaving me with no more time to get the benefit from it. But by 17:13 this evening the build had completed. That means there's still time to perform the comparison of TextureClient::Destroy() running on the two versions.
The results, however, are not what I was expecting. At least on ESR 78 things seem to act normally. The breakpoint is hit and it's possible to step through the code. It seems a little anomalous that both the data and actor variables are null, meaning that the actual dealocation step gets skipped:
If you'd like to read any of my other gecko diary entries, they're all available on my Gecko-dev Diary page.
Comment
I'm hypothesising that there's something created by the method that should get freed. The texture itself is the most likely culprit, since even just a few 1080 by 2520 textures are going to consume a lot of memory. Generate a few of those each frame without freeing them and bad things will happen.
We're definitely seeing bad things happen, so this is my guess. However yesterday I checked a few of the associated destructors and they seem to be getting called.
So today I'm going to try to tackle it from a different angle. Rather than try to figure out what's not getting freed I'm going to try to find out what's causing the crash. I've started off by adjusting the size of the texture created as part of the render loop. Rather than a 1080 by 2520 texture, I've set it to always generate an 8 by 8 texture, by altering this code from GLContext.cpp (the commented part is the old code, replaced by the equivalent lines directly below):
GLuint CreateTexture(GLContext* aGL, GLenum aInternalFormat, GLenum aFormat,
                     GLenum aType, const gfx::IntSize& aSize, bool linear) {
[...]
//  aGL->fTexImage2D(LOCAL_GL_TEXTURE_2D, 0, aInternalFormat, aSize.width,
//                   aSize.height, 0, aFormat, aType, nullptr);
  aGL->fTexImage2D(LOCAL_GL_TEXTURE_2D, 0, aInternalFormat, 8,
                   8, 0, aFormat, aType, nullptr);

  return tex;
}
This won't prevent the memory leak, but if this is the texture that's not being freed, it should at least slow it down, which should be discernible in use.While the updated code builds and gets transferred over to my phone I can continue looking through the code. Here's the backtrace from the SharedSurface_EGLImage::Create() method, the change to which has triggered the memory leak. It's possible, maybe even likely, that the code for reclaiming the resources will live somewhere in or close to the methods in this stack.
#0  SharedSurface_EGLImage::Create, SharedSurfaceEGL.cpp:58
#1  SurfaceFactory_EGLImage::CreateSharedImpl, WeakPtr.h:185
#2  SurfaceFactory::CreateShared, RefCounted.h:240
#3  SurfaceFactory::NewTexClient, SharedSurface.cpp:406
#4  GLScreenBuffer::Swap, UniquePtr.h:290
#5  GLScreenBuffer::PublishFrame, GLScreenBuffer.h:229
#6  EmbedLiteCompositorBridgeParent::PresentOffscreenSurface,
    EmbedLiteCompositorBridgeParent.cpp:191
#7  embedlite::nsWindow::PostRender, embedshared/nsWindow.cpp:248
#8  InProcessCompositorWidget::PostRender, InProcessCompositorWidget.cpp:60
#9  LayerManagerComposite::Render, Compositor.h:575
#10 LayerManagerComposite::UpdateAndRender, LayerManagerComposite.cpp:657
#11 LayerManagerComposite::EndTransaction, LayerManagerComposite.cpp:572
I should take a look more closely at SharedSurfaceTextureClient::~SharedSurfaceTextureClient() which is — in theory — being called each time Swap() is called when the contents of the mBack reference-counted pointer is freed.My new binary has copied over to my phone. The running app exhibits very similar symptoms as before: responsive at first but quickly seizes up and becoming unresponsive. I killed the process before it took down my phone, but a visual check suggests reducing the texture size didn't have any obvious benefit.
Back to looking through the code, I'm working through SharedSurfaceTextureClient::~SharedSurfaceTextureClient() and I notice this method called Destroy(). Although it's not immediately clear from the way the code is written, this call actually goes through to TextureClient::Destroy(). I recall making changes to this and scanning through my notes confirms it: it was back on Day 176. At the time I wrote this:
This mWorkaroundAnnoyingSharedSurfaceLifetimeIssues is used in ESR 78 to decide whether or not to deallocate the TextureData when the TextureClient is destroyed. This has been removed in ESR 91 and to be honest, I'm comfortable leaving it this way... Maybe this will cause problems later, but my guess is that this will show up with the debugger if that's the case, at which point we can refer back to the ESR 78 code to restore these checks.
Could it be that the changes I made back then are causing the issues I'm experiencing now?
While I can step through the ESR 78 build, unfortunately all of changes integrated using partial builds have messed up the debug source for the ESR 91 build. Stepping through gives me just a slew of useless "TextureClientSharedSurface.cpp: No such file or directory." messages. So I've decided to kick off a full build. With a bit of luck it'll be completed before the end of the day and I'll be able to come back to this in the evening to compare the two executing flows by stepping through them.
[...]
It was just before 9:00 this morning that I set the build going. I could well imagine it running into the night and leaving me with no more time to get the benefit from it. But by 17:13 this evening the build had completed. That means there's still time to perform the comparison of TextureClient::Destroy() running on the two versions.
The results, however, are not what I was expecting. At least on ESR 78 things seem to act normally. The breakpoint is hit and it's possible to step through the code. It seems a little anomalous that both the data and actor variables are null, meaning that the actual dealocation step gets skipped:
(gdb) b TextureClient::Destroy
Breakpoint 4 at 0x7fb8e9b1b8: file gfx/layers/client/TextureClient.cpp,
    line 558.
(gdb) c
Continuing.
[LWP 7428 exited]
[Switching to LWP 7404]

Thread 37 "Compositor" hit Breakpoint 4, mozilla::layers::TextureClient::
    Destroy (this=this@entry=0x7ea0118ab0)
    at gfx/layers/client/TextureClient.cpp:558
558     void TextureClient::Destroy() {
(gdb) n
[LWP 7308 exited]
[LWP 7374 exited]
[LWP 7375 exited]
560       MOZ_RELEASE_ASSERT(mPaintThreadRefs == 0);
(gdb) n
562       if (mActor && !mIsLocked) {
(gdb) n
566       mBorrowedDrawTarget = nullptr;
(gdb) n
567       mReadLock = nullptr;
(gdb) n
[New LWP 7538]
569       RefPtr<TextureChild> actor = mActor;
(gdb) n
577       TextureData* data = mData;
(gdb) n
578       if (!mWorkaroundAnnoyingSharedSurfaceLifetimeIssues) {
(gdb) n
582       if (data || actor) {
(gdb) p mWorkaroundAnnoyingSharedSurfaceLifetimeIssues
$11 = true
(gdb) p data
$12 = (mozilla::layers::TextureData *) 0x0
(gdb) p actor
$13 = {mRawPtr = 0x0}
(gdb)
Here are the most relevant parts of the code associated with the above debug output to help follow what's happening:
void TextureClient::Destroy() {
  // Async paints should have been flushed by now.
  MOZ_RELEASE_ASSERT(mPaintThreadRefs == 0);

  if (mActor && !mIsLocked) {
    mActor->Lock();
  }

  mBorrowedDrawTarget = nullptr;
  mReadLock = nullptr;

  RefPtr<TextureChild> actor = mActor;
  mActor = nullptr;

  if (actor && !actor->mDestroyed.compareExchange(false, true)) {
    actor->Unlock();
    actor = nullptr;
  }

  TextureData* data = mData;
  if (!mWorkaroundAnnoyingSharedSurfaceLifetimeIssues) {
    mData = nullptr;
  }

  if (data || actor) {
[...]
    DeallocateTextureClient(params);
  }
}
Although the code does step through okay, on ESR 91 something happens which I can't explain. The debugger suggests execution is getting stuck in a loop calling TextureClient::Destroy():
(gdb) b TextureClient::Destroy
Breakpoint 3 at 0x7ff1148c90: file layers/client/
    TextureClient.cpp, line 551.
(gdb) c
Continuing.
[LWP 18393 exited]
[Switching to LWP 18284]

Thread 7 "GeckoWorkerThre" hit Breakpoint 3, mozilla::layers::TextureClient::
    Destroy (this=this@entry=0x7fc5975380)
    at layers/client/TextureClient.cpp:551
551     void TextureClient::Destroy() {
(gdb) n
553       MOZ_RELEASE_ASSERT(mPaintThreadRefs == 0);
(gdb)

Thread 7 "GeckoWorkerThre" hit Breakpoint 3, mozilla::layers::TextureClient::
    Destroy (this=this@entry=0x7fc595de20)
    at layers/client/TextureClient.cpp:551
551     void TextureClient::Destroy() {
(gdb)
553       MOZ_RELEASE_ASSERT(mPaintThreadRefs == 0);
(gdb)

Thread 7 "GeckoWorkerThre" hit Breakpoint 3, mozilla::layers::TextureClient::
    Destroy (this=this@entry=0x7fc55d2280)
    at layers/client/TextureClient.cpp:551
551     void TextureClient::Destroy() {
(gdb)
The code is quite similar to the ESR 78 code, so I'm not sure why this might be happening. There's no obviously nested call to Destroy():
void TextureClient::Destroy() {
// Async paints should have been flushed by now.
MOZ_RELEASE_ASSERT(mPaintThreadRefs == 0);
if (mActor && !mIsLocked) {
mActor->Lock();
}
mBorrowedDrawTarget = nullptr;
mReadLock = nullptr;
RefPtr<TextureChild> actor = mActor;
mActor = nullptr;
if (actor && !actor->mDestroyed.compareExchange(false, true)) {
actor->Unlock();
actor = nullptr;
}
TextureData* data = mData;
mData = nullptr;
if (data || actor) {
[...]
DeallocateTextureClient(params);
}
}
The backtrace is showing nested calls to TextureClient::~TextureClient(). But none of this explains the repeated hits of the TextureClient::Destroy() breakpoint.
#0 mozilla::layers::TextureClient::Destroy (this=this@entry=0x7fc6f7a3a0)
at layers/client/TextureClient.cpp:551
#1 0x0000007ff1149144 in mozilla::layers::TextureClient::~TextureClient
(this=0x7fc6f7a3a0, __in_chrg=<optimized out>)
at layers/client/TextureClient.cpp:769
#2 0x0000007ff1149310 in mozilla::layers::TextureClient::~TextureClient
(this=0x7fc6f7a3a0, __in_chrg=<optimized out>)
at layers/client/TextureClient.cpp:764
#3 0x0000007ff110507c in mozilla::AtomicRefCountedWithFinalize
<mozilla::layers::TextureClient>::Release (this=0x7fc6f7a3a8)
at include/c++/8.3.0/bits/basic_ios.h:282
#4 0x0000007ff1268420 in mozilla::RefPtrTraits
<mozilla::layers::TextureClient>::Release (aPtr=<optimized out>)
at ${PROJECT}/obj-build-mer-qt-xr/dist/include/mozilla/RefPtr.h:381
#5 RefPtr<mozilla::layers::TextureClient>::ConstRemovingRefPtrTraits
<mozilla::layers::TextureClient>::Release (aPtr=<optimized out>)
at ${PROJECT}/obj-build-mer-qt-xr/dist/include/mozilla/RefPtr.h:381
[...]
I was hoping to get this part resolved today, but the situation is confusing and my head has stopped focusing, so I'm going to have to continue tomorrow.If you'd like to read any of my other gecko diary entries, they're all available on my Gecko-dev Diary page.
14 Mar 2024 : Day 185 #
By the time I'd finished writing my diary entry yesterday I was pretty tired; my mind wasn't entirely with it. But it wasn't just the need for sleep that was causing me confusion. I was also confused as to why the HasEglImageExtensions() was returning false on ESR 91 while HasExtensions() — which is essentially the same functionality — was returning true.
A good night's sleep hasn't helped answer this question unfortunately. My manual inspection of the code coupled with output from the debugger suggested that HasEglImageExtensions() should have been returning true.
What I'd really like to see is explicit output for each of the items in the condition to figure out which is returning false. The debugger on its own won't be any further help with this as there are too many steps optimised out. But if I expand the code a bit, rebuild and redeploy, then I may be able to get a clearer picture. So at least that's a clear path for today.
The first step is to make some changes to the code. I've added in variables to store return values for each of the four flags, all marked as volatile in the hope this will prevent the compiler from optimising them away. Then I print them all out. In practice I don't really care whether they actually get printed out or not, since my plan is to inspect them using the debugger. But I need to do something with them; printing them out is as good as anything.
On executing the updated code I'm surprised to discover that it does actually output to the console. And the results aren't what I was expected. Well, not exactly.
Here's the output I get. And as soon as I see this output I realise the stupid mistake I've made.
I feel more than a little bit silly. But it's okay, the important point is that it's fixed now. I've added in that crucial missing ! and this should now work as expected:
On executing the app and with this change in place we still don't unfortunately get a render. In fact the app now seems to hog CPU cycles and make my phone unresponsive. I have a feeling this is a memory leak, but a bit more digging will help confirm it (or otherwise).
If this change has triggered a memory leak, it's likely because the surface being created by SurfaceFactory_EGLImage::Create() is never being freed. Creating a new 1080 by 2520 texture each frame will start to eat up memory pretty fast. So an obvious next step is to find out where it's being freed on ESR 78 and establish whether the same thing is happening on ESR 91 or not.
Unfortunately it turns out to be harder to find than I'd expected. There are quite a few methods that are used for deleting textures or memory associated with them. I've tried adding breakpoints to all of the following:
If you'd like to read any of my other gecko diary entries, they're all available on my Gecko-dev Diary page.
Comment
A good night's sleep hasn't helped answer this question unfortunately. My manual inspection of the code coupled with output from the debugger suggested that HasEglImageExtensions() should have been returning true.
What I'd really like to see is explicit output for each of the items in the condition to figure out which is returning false. The debugger on its own won't be any further help with this as there are too many steps optimised out. But if I expand the code a bit, rebuild and redeploy, then I may be able to get a clearer picture. So at least that's a clear path for today.
The first step is to make some changes to the code. I've added in variables to store return values for each of the four flags, all marked as volatile in the hope this will prevent the compiler from optimising them away. Then I print them all out. In practice I don't really care whether they actually get printed out or not, since my plan is to inspect them using the debugger. But I need to do something with them; printing them out is as good as anything.
static bool HasEglImageExtensions(const GLContextEGL& gl) {
const auto& egl = *(gl.mEgl);
volatile bool imagebase = egl.HasKHRImageBase();
volatile bool tex2D = egl.IsExtensionSupported(
EGLExtension::KHR_gl_texture_2D_image);
volatile bool external = gl.IsExtensionSupported(
GLContext::OES_EGL_image_external);
volatile bool image = gl.IsExtensionSupported(GLContext::OES_EGL_image);
printf_stderr("RENDER: egl HasKHRImageBase: %d\n", imagebase);
printf_stderr("RENDER: egl KHR_gl_texture_2D_image: %d\n", tex2D);
printf_stderr("RENDER: gl OES_EGL_image_external: %d\n", external);
printf_stderr("RENDER: gl OES_EGL_image: %d\n", image);
return egl.HasKHRImageBase() &&
egl.IsExtensionSupported(EGLExtension::KHR_gl_texture_2D_image) &&
(gl.IsExtensionSupported(GLContext::OES_EGL_image_external) ||
gl.IsExtensionSupported(GLContext::OES_EGL_image));
}
Now I've set it building. As I write this I'm on a different mode of transport: travelling by bus. It's surprising that using a laptop on a bus feels far more socially awkward compared to using a laptop on a train. It's true the ride is more bumpy and the space more cramped, but I still find it odd that I don't see other people doing it. Everyone is on their phones; nobody (apart from me) ever seems to have a laptop out.On executing the updated code I'm surprised to discover that it does actually output to the console. And the results aren't what I was expected. Well, not exactly.
RENDER: egl HasKHRImageBase: 1 RENDER: egl KHR_gl_texture_2D_image: 1 RENDER: gl OES_EGL_image_external: 1 RENDER: gl OES_EGL_image: 1They're all coming back true, so I must have been mistaken about why the SurfaceFactory_EGLImage::Create() method is exiting early. I've therefore annotated the Create() method with some more debug output in the hope this will shed more light on things. See the added printf_stderr() calls in the code below.
if (HasEglImageExtensions(*gle)) {
printf_stderr("RENDER: !HasEglImageExtensions()\n");
return ret;
}
MOZ_ALWAYS_TRUE(prodGL->MakeCurrent());
GLuint prodTex = CreateTextureForOffscreen(prodGL, formats, size);
if (!prodTex) {
printf_stderr("RENDER: !prodTex\n");
return ret;
}
EGLClientBuffer buffer =
reinterpret_cast<EGLClientBuffer>(uintptr_t(prodTex));
EGLImage image = egl->fCreateImage(context,
LOCAL_EGL_GL_TEXTURE_2D, buffer, nullptr);
if (!image) {
prodGL->fDeleteTextures(1, &prodTex);
printf_stderr("RENDER: !image\n");
return ret;
}
ret.reset(new SharedSurface_EGLImage(prodGL, size, hasAlpha, formats, prodTex,
image));
printf_stderr("RENDER: returning normally\n");
return ret;
None of these should be necessary: it should be possible to extract all of this execution flow from the debugger. But for some reason the conclusion I came to from using the debugger doesn't make sense based on the values HasEglImageExtensions() is returning. Maybe I made a mistake somewhere. Nevertheless, this approach should hopefully give an answer to the question we want to know.Here's the output I get. And as soon as I see this output I realise the stupid mistake I've made.
RENDER: egl HasKHRImageBase: 1 RENDER: egl KHR_gl_texture_2D_image: 1 RENDER: gl OES_EGL_image_external: 1 RENDER: gl OES_EGL_image: 1 RENDER: !HasEglImageExtensions()So did you notice the stupid mistake? Here's the relevant ESR 78 code:
if (!HasExtensions(egl, prodGL)) {
return ret;
}
And here — oh dear — is what I replaced it with:
if (HasEglImageExtensions(*gle)) {
return ret;
}
See what's missing? It's the crucial negation of the condition. Oh boy. I can see why I made this mistake: it's because elsewhere in the same file the condition is used — correctly — with the opposite effect, like this:
if (HasEglImageExtensions(*gle)) {
ret.reset(new ptrT({prodGL, SharedSurfaceType::Basic,
layers::TextureType::Unknown, true}, caps, allocator, flags, context));
}
In one case the method should return early if the extension check fails; in the other case it should reset the returned texture if the extension check succeeds.I feel more than a little bit silly. But it's okay, the important point is that it's fixed now. I've added in that crucial missing ! and this should now work as expected:
if (!HasEglImageExtensions(*gle)) {
return ret;
}
I'm not expecting this change to miraculously fix the entire rendering pipeline, but it should certainly help.On executing the app and with this change in place we still don't unfortunately get a render. In fact the app now seems to hog CPU cycles and make my phone unresponsive. I have a feeling this is a memory leak, but a bit more digging will help confirm it (or otherwise).
If this change has triggered a memory leak, it's likely because the surface being created by SurfaceFactory_EGLImage::Create() is never being freed. Creating a new 1080 by 2520 texture each frame will start to eat up memory pretty fast. So an obvious next step is to find out where it's being freed on ESR 78 and establish whether the same thing is happening on ESR 91 or not.
Unfortunately it turns out to be harder to find than I'd expected. There are quite a few methods that are used for deleting textures or memory associated with them. I've tried adding breakpoints to all of the following:
- SharedSurface_EGLImage::~SharedSurface_EGLImage()
- GLContext::Readback()
- GLContext::fDeleteFramebuffers()
- GLContext::raw_fDeleteTextures()
- SharedSurfaceTextureClient::~SharedSurfaceTextureClient()
If you'd like to read any of my other gecko diary entries, they're all available on my Gecko-dev Diary page.
13 Mar 2024 : Day 184 #
Yesterday we determined that a problem in CreateShared() meant that the method was returning a null SharedSurface_EGLImage on ESR 91 when it should have been returning a valid pointer. The question I want to answer today is: "why"?
Stepping through the code the programme counter is jumping all over the place, making it hard to follow. But eventually it becomes clear that it's the HasEglImageExtensions() method that's returning false, causing CreateShared() to return early with a null return value. Although the method is called HasEglImageExtensions() in ESR 91, in ESR 78 it's called something else; just HasExtensions. Let's take a look at the two versions of it. But they're otherwise largely the same. First the ESR 78 version:
Both egl and gl use different enums, so we'll need to consider them separately.
Here's the enum associated with egl in ESR 78, found in GlLibraryEGL.h:
On ESR 91, the related enum, also found in GlLibraryEGL.h, looks like this:
So, no obvious problems on the egl side. Let's now check the longer enum for gl. Here are the active values based on the ESR 78 list available in GLContext.h:
It's not clear to me right now. Something is wrong, but I can't see where. I'd love to dig deeper in to this today but my mind has reached its limit. I'll have to pick this up again tomorrow.
If you'd like to read any of my other gecko diary entries, they're all available on my Gecko-dev Diary page.
Comment
Stepping through the code the programme counter is jumping all over the place, making it hard to follow. But eventually it becomes clear that it's the HasEglImageExtensions() method that's returning false, causing CreateShared() to return early with a null return value. Although the method is called HasEglImageExtensions() in ESR 91, in ESR 78 it's called something else; just HasExtensions. Let's take a look at the two versions of it. But they're otherwise largely the same. First the ESR 78 version:
bool SharedSurface_EGLImage::HasExtensions(GLLibraryEGL* egl, GLContext* gl) {
return egl->HasKHRImageBase() &&
egl->IsExtensionSupported(GLLibraryEGL::KHR_gl_texture_2D_image) &&
(gl->IsExtensionSupported(GLContext::OES_EGL_image_external) ||
gl->IsExtensionSupported(GLContext::OES_EGL_image));
}
Followed by the ESR 91 version:
static bool HasEglImageExtensions(const GLContextEGL& gl) {
const auto& egl = *(gl.mEgl);
return egl.HasKHRImageBase() &&
egl.IsExtensionSupported(EGLExtension::KHR_gl_texture_2D_image) &&
(gl.IsExtensionSupported(GLContext::OES_EGL_image_external) ||
gl.IsExtensionSupported(GLContext::OES_EGL_image));
}
As you can see, they're similar but not quite identical. Unfortunately the debugger claims the IsExtensionSupported() methods have been optimised out. But it's a pretty simple method, just returning as it does the value in the mAvailableExtensions array referenced by aKnownExtension.
bool IsExtensionSupported(EGLExtensions aKnownExtension) const {
return mAvailableExtensions[aKnownExtension];
}
There's a change on ESR 91 where the aKnownExtension is first redirected via the UnderlyingValue() method. Here's the ESR 91 version:
bool IsExtensionSupported(EGLExtension aKnownExtension) const {
return mAvailableExtensions[UnderlyingValue(aKnownExtension)];
}
We'll come back to UnderlyingValue() in a bit. Now that we know the implementations we can make use of this info when we perform our debugging to circumnavigate the fact the methods have been optimised out: we can just access the mAvailableExtensions array used by each directly instead. Let's take a look at that. First let's look at the values in ESR 78:
(gdb) b HasExtensions
Breakpoint 2 at 0x7fb8e84d70: HasExtensions. (2 locations)
(gdb) c
Continuing.
Thread 36 "Compositor" hit Breakpoint 2, mozilla::gl::SharedSurface_EGLImage::
HasExtensions (egl=0x7eac0036a0, gl=0x7eac109140)
at gfx/gl/SharedSurfaceEGL.cpp:59
59 return egl->HasKHRImageBase() &&
(gdb) p egl.mAvailableExtensions
$1 = std::bitset = { [0] = 1, [2] = 1, [3] = 1, [5] = 1, [6] = 1,
[7] = 1, [13] = 1, [21] = 1, [22] = 1}
(gdb) p gl.mAvailableExtensions
$2 = std::bitset = { [1] = 1, [57] = 1, [58] = 1, [60] = 1, [72] = 1,
[75] = 1, [77] = 1, [78] = 1, [86] = 1, [87] = 1,
[96] = 1, [97] = 1, [100] = 1, [111] = 1, [112] = 1,
[113] = 1, [114] = 1, [115] = 1, [117] = 1, [118] = 1,
[120] = 1, [121] = 1, [122] = 1, [123] = 1, [125] = 1,
[126] = 1, [127] = 1, [128] = 1, [129] = 1, [130] = 1,
[131] = 1, [132] = 1}
(gdb)
And for contrast, let's see what happens on ESR 91 using the same process:
(gdb) b HasEglImageExtensions
Breakpoint 1 at 0x7ff11322a0: file include/c++/8.3.0/bitset, line 1163.
(gdb) c
Continuing.
[LWP 26957 exited]
[LWP 26952 exited]
[New LWP 27078]
[LWP 27037 exited]
[Switching to LWP 26961]
Thread 38 "Compositor" hit Breakpoint 1, mozilla::gl::HasEglImageExtensions
(gl=...)
at ${PROJECT}/gfx/gl/SharedSurfaceEGL.cpp:28
28 ${PROJECT}/gfx/gl/SharedSurfaceEGL.cpp: No such file or directory.
(gdb) p egl.mAvailableExtensions
$1 = std::bitset = { [0] = 1, [2] = 1, [4] = 1, [5] = 1, [6] = 1,
[7] = 1, [8] = 1, [11] = 1, [16] = 1, [17] = 1,
[22] = 1}
(gdb) p gl.mAvailableExtensions
$2 = std::bitset = { [1] = 1, [57] = 1, [58] = 1, [60] = 1, [72] = 1,
[75] = 1, [77] = 1, [78] = 1, [86] = 1, [87] = 1,
[88] = 1, [97] = 1, [99] = 1, [101] = 1, [102] = 1,
[113] = 1, [114] = 1, [115] = 1, [116] = 1, [117] = 1,
[119] = 1, [120] = 1, [122] = 1, [123] = 1, [124] = 1,
[125] = 1, [127] = 1, [128] = 1, [129] = 1, [130] = 1,
[131] = 1, [132] = 1, [133] = 1, [134] = 1}
(gdb)
It's noticeable that neither the egl nor the gl values are identical across the two versions. The obvious question is whether this is a real difference, or whether the UnderlyingValue() method is obscuring the fact that they're the same. Here's what the code has to say about UnderlyingValue():
/**
* Get the underlying value of an enum, but typesafe.
*
* example:
*
* enum class Pet : int16_t {
* Cat,
* Dog,
* Fish
* };
* enum class Plant {
* Flower,
* Tree,
* Vine
* };
* UnderlyingValue(Pet::Fish) -> int16_t(2)
* UnderlyingValue(Plant::Tree) -> int(1)
*/
template <typename T>
inline constexpr auto UnderlyingValue(const T v) {
static_assert(std::is_enum_v<T>);
return static_cast<typename std::underlying_type<T>::type>(v);
}
So this isn't actually changing the value, it's checking and casting it to the appropriate type. So we can ignore this when we're comparing values and conclude that the mAvailableExtensions array definitely has different indices set to true between ESR 78 and ESR 91. But we still need to check the enums that these represent in order to be sure that these are real differences.Both egl and gl use different enums, so we'll need to consider them separately.
Here's the enum associated with egl in ESR 78, found in GlLibraryEGL.h:
0: KHR_image_base 2: KHR_gl_texture_2D_image 3: KHR_lock_surface 5: EXT_create_context_robustness 6: KHR_image 7: KHR_fence_sync 13: KHR_create_context 21: KHR_surfaceless_context 22: KHR_create_context_no_errorBased on the HasExtensions() implementation we're interested in KHR_gl_texture_2D_image, KHR_image and KHR_image_base; all of which are present in the list above (indices 2, 6 and 0).
On ESR 91, the related enum, also found in GlLibraryEGL.h, looks like this:
0: KHR_image_base 2: KHR_gl_texture_2D_image 4: ANGLE_surface_d3d_texture_2d_share_handle 5: EXT_create_context_robustness 6: KHR_image 7: KHR_fence_sync 8: ANDROID_native_fence_sync 11: ANGLE_platform_angle_d3d 16: EXT_device_query 17: NV_stream_consumer_gltexture_yuv 22: KHR_create_context_no_errorAgain, looking at the code and based on HasEglImageExtensions() we're interested in the same flags: KHR_gl_texture_2D_image, KHR_image and KHR_image_base. All of these are also present in the ESR 91 list (indices 2, 6 and 0).
So, no obvious problems on the egl side. Let's now check the longer enum for gl. Here are the active values based on the ESR 78 list available in GLContext.h:
1: AMD_compressed_ATC_texture 57: EXT_color_buffer_float 58: EXT_color_buffer_half_float 60: EXT_disjoint_timer_query 72: EXT_multisampled_render_to_texture 75: EXT_read_format_bgra 77: EXT_sRGB 78: EXT_sRGB_write_control 86: EXT_texture_filter_anisotropic 87: EXT_texture_format_BGRA8888 96: IMG_texture_npot 97: KHR_debug 100: KHR_robustness 111: NV_transform_feedback 112: NV_transform_feedback2 113: OES_EGL_image 114: OES_EGL_image_external 115: OES_EGL_sync 117: OES_depth24 118: OES_depth32 120: OES_element_index_uint 121: OES_fbo_render_mipmap 122: OES_framebuffer_object 123: OES_packed_depth_stencil 125: OES_standard_derivatives 126: OES_stencil8 127: OES_texture_3D 128: OES_texture_float 129: OES_texture_float_linear 130: OES_texture_half_float 131: OES_texture_half_float_linear 132: OES_texture_npotFrom the ESR 78 code the ones we're interested in are just OES_EGL_image_external and OES_EGL_image. These are both in the list (indices 114 and 113). What about ESR 91? Here's the enum list in this case:
1: AMD_compressed_ATC_texture 57: EXT_color_buffer_float 58: EXT_color_buffer_half_float 60: EXT_disjoint_timer_query 72: EXT_multisampled_render_to_texture 75: EXT_read_format_bgra 77: EXT_sRGB 78: EXT_sRGB_write_control 86: EXT_texture_filter_anisotropic 87: EXT_texture_format_BGRA8888 88: EXT_texture_norm16 97: KHR_debug 99: KHR_robust_buffer_access_behavior 101: KHR_texture_compression_astc_hdr 102: KHR_texture_compression_astc_ldr 113: OES_EGL_image 114: OES_EGL_image_external 115: OES_EGL_sync 116: OES_compressed_ETC1_RGB8_texture 117: OES_depth24 119: OES_depth_texture 120: OES_element_index_uint 122: OES_framebuffer_object 123: OES_packed_depth_stencil 124: OES_rgb8_rgba8 125: OES_standard_derivatives 127: OES_texture_3D 128: OES_texture_float 129: OES_texture_float_linear 130: OES_texture_half_float 131: OES_texture_half_float_linear 132: OES_texture_npot 133: OES_vertex_array_object 134: OVR_multiview2Once again from the ESR 91 code we can see the ones we're interested in are the same: OES_EGL_image_external and OES_EGL_image. These are both in the list (indices 114 and 113). So what gives? Both methods have the appropriate flags set, so why is one succeeding and the other failure?
It's not clear to me right now. Something is wrong, but I can't see where. I'd love to dig deeper in to this today but my mind has reached its limit. I'll have to pick this up again tomorrow.
If you'd like to read any of my other gecko diary entries, they're all available on my Gecko-dev Diary page.
12 Mar 2024 : Day 183 #
Before we get in to my usual dev diary I want to fist draw attention to a couple of new development blogs that have started up recently. Both related to mobile operating system development and Linux in particular.
First up is Adventures with Sailfish and Ofono from Adam Pigg (piggz). Adam will be well-known to many amSailfish OS users and already featured here back on Day 178.
A long-time porter of Sailfish OS, Adam is responsible for the native PinePhone, PinePhone Pro and Volla ports, amongst others.
He's recently turned his hand to contributing Sailfish-specific Ofono changes to upstream, with the aim of reversing the divergence that's grown between the two over the years. If successful, this would not only add functionality to upstream Ofono, it would also allow updating the Sailfish OS version and benefiting from recent upstream improvements as well.
Adam recently started writing a semi-daily blog about it. He's up to Day 5 already and it's a great read.
But it's not just Adam. Peter Mack (1peter10) from LINMOB.net has started a developer diary to chart his explorations of — and improvements to — Mobile Config Firefox. The project is aimed at getting Firefox nicely configured for mobile use, part of the postmarketOS project. Peter has already written about his first pull request to tidy up the URL bar for use on smaller displays.
I'm really enjoying reading about others' approach to development and watching as things progress. I'll be following along avidly to both.
It might seem a little obvious, but I also recommend Peter's weekly Mobile Linux Update as the best way to catch up on all the latest activity in the mobile Linux space. I like to think I'm keeping up with developments in the world of Sailfish OS, but keeping up with activity across all of the various distributions is a real challenge. I'd say it was impossible, except that this is exactly what Peter does, making it possible for the rest of us to keep up in the process.
On a separate but related note, I also want to give a shout-out to Florian Xaver (wosrediinanatour). Florian has been extremely helpful reviewing some of the code changes mentioned here in my diary. He's been sharing useful advice and tips. I'm going to go into this in more detail in a future diary entry, but for now, let me just say that I'm grateful for the input.
Alright, let's move back on to the gecko development track. After taking some steps to align the ESR 78 and ESR 91 offscreen rendering pipeline yesterday, I'm following on with more of the same today. My plan is to step through various methods I know to be relevant as part of the render process and see whether they differ between ESR 78 and ESR 91. I have a pretty good setup for this. Two phones, one with ESR 78 another with ESR 91. Two SSH sessions, one for each phone, running my test application through the debugger. Then on another display I have Qt Creator running with ESR 78 code on one side and ESR 91 code on the other.
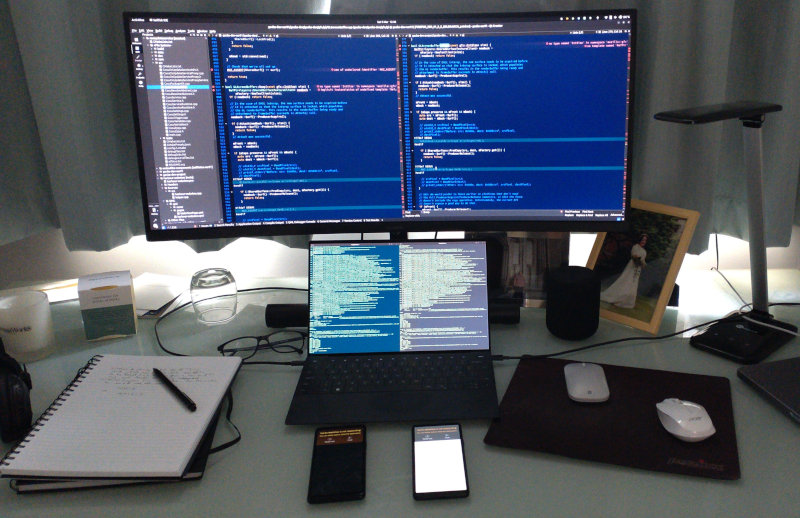
With this setup I can step through the code simultaneously on ESR 78 and ESR 91 to establish whether they diverge or not, and if so where. The first method I'm going to look at is the same one we started with yesterday, which is GLScreenBuffer::Swap(). What I'd really like to do is show the debugger output side-by-side here, but the line lengths are too wide for it to comfortably fit, so I'm just going to have to list them here serially.
Working this way it doesn't take long before I'm able to identify a critical issue. First ESR 78.
The SurfaceFactory_EGLImage class must be inheriting the method from SurfaceFactory::NewTexClient(). So we can check by stepping through that. First the ESR 78 code.
On ESR 91 there's a big difference: although mAllocator and mFlags are set correctly, the call to CreateShared returns null. Immediately afterwards the method notices this and returns early.
If you'd like to read any of my other gecko diary entries, they're all available on my Gecko-dev Diary page.
Comment
First up is Adventures with Sailfish and Ofono from Adam Pigg (piggz). Adam will be well-known to many amSailfish OS users and already featured here back on Day 178.
A long-time porter of Sailfish OS, Adam is responsible for the native PinePhone, PinePhone Pro and Volla ports, amongst others.
He's recently turned his hand to contributing Sailfish-specific Ofono changes to upstream, with the aim of reversing the divergence that's grown between the two over the years. If successful, this would not only add functionality to upstream Ofono, it would also allow updating the Sailfish OS version and benefiting from recent upstream improvements as well.
Adam recently started writing a semi-daily blog about it. He's up to Day 5 already and it's a great read.
But it's not just Adam. Peter Mack (1peter10) from LINMOB.net has started a developer diary to chart his explorations of — and improvements to — Mobile Config Firefox. The project is aimed at getting Firefox nicely configured for mobile use, part of the postmarketOS project. Peter has already written about his first pull request to tidy up the URL bar for use on smaller displays.
I'm really enjoying reading about others' approach to development and watching as things progress. I'll be following along avidly to both.
It might seem a little obvious, but I also recommend Peter's weekly Mobile Linux Update as the best way to catch up on all the latest activity in the mobile Linux space. I like to think I'm keeping up with developments in the world of Sailfish OS, but keeping up with activity across all of the various distributions is a real challenge. I'd say it was impossible, except that this is exactly what Peter does, making it possible for the rest of us to keep up in the process.
On a separate but related note, I also want to give a shout-out to Florian Xaver (wosrediinanatour). Florian has been extremely helpful reviewing some of the code changes mentioned here in my diary. He's been sharing useful advice and tips. I'm going to go into this in more detail in a future diary entry, but for now, let me just say that I'm grateful for the input.
Alright, let's move back on to the gecko development track. After taking some steps to align the ESR 78 and ESR 91 offscreen rendering pipeline yesterday, I'm following on with more of the same today. My plan is to step through various methods I know to be relevant as part of the render process and see whether they differ between ESR 78 and ESR 91. I have a pretty good setup for this. Two phones, one with ESR 78 another with ESR 91. Two SSH sessions, one for each phone, running my test application through the debugger. Then on another display I have Qt Creator running with ESR 78 code on one side and ESR 91 code on the other.
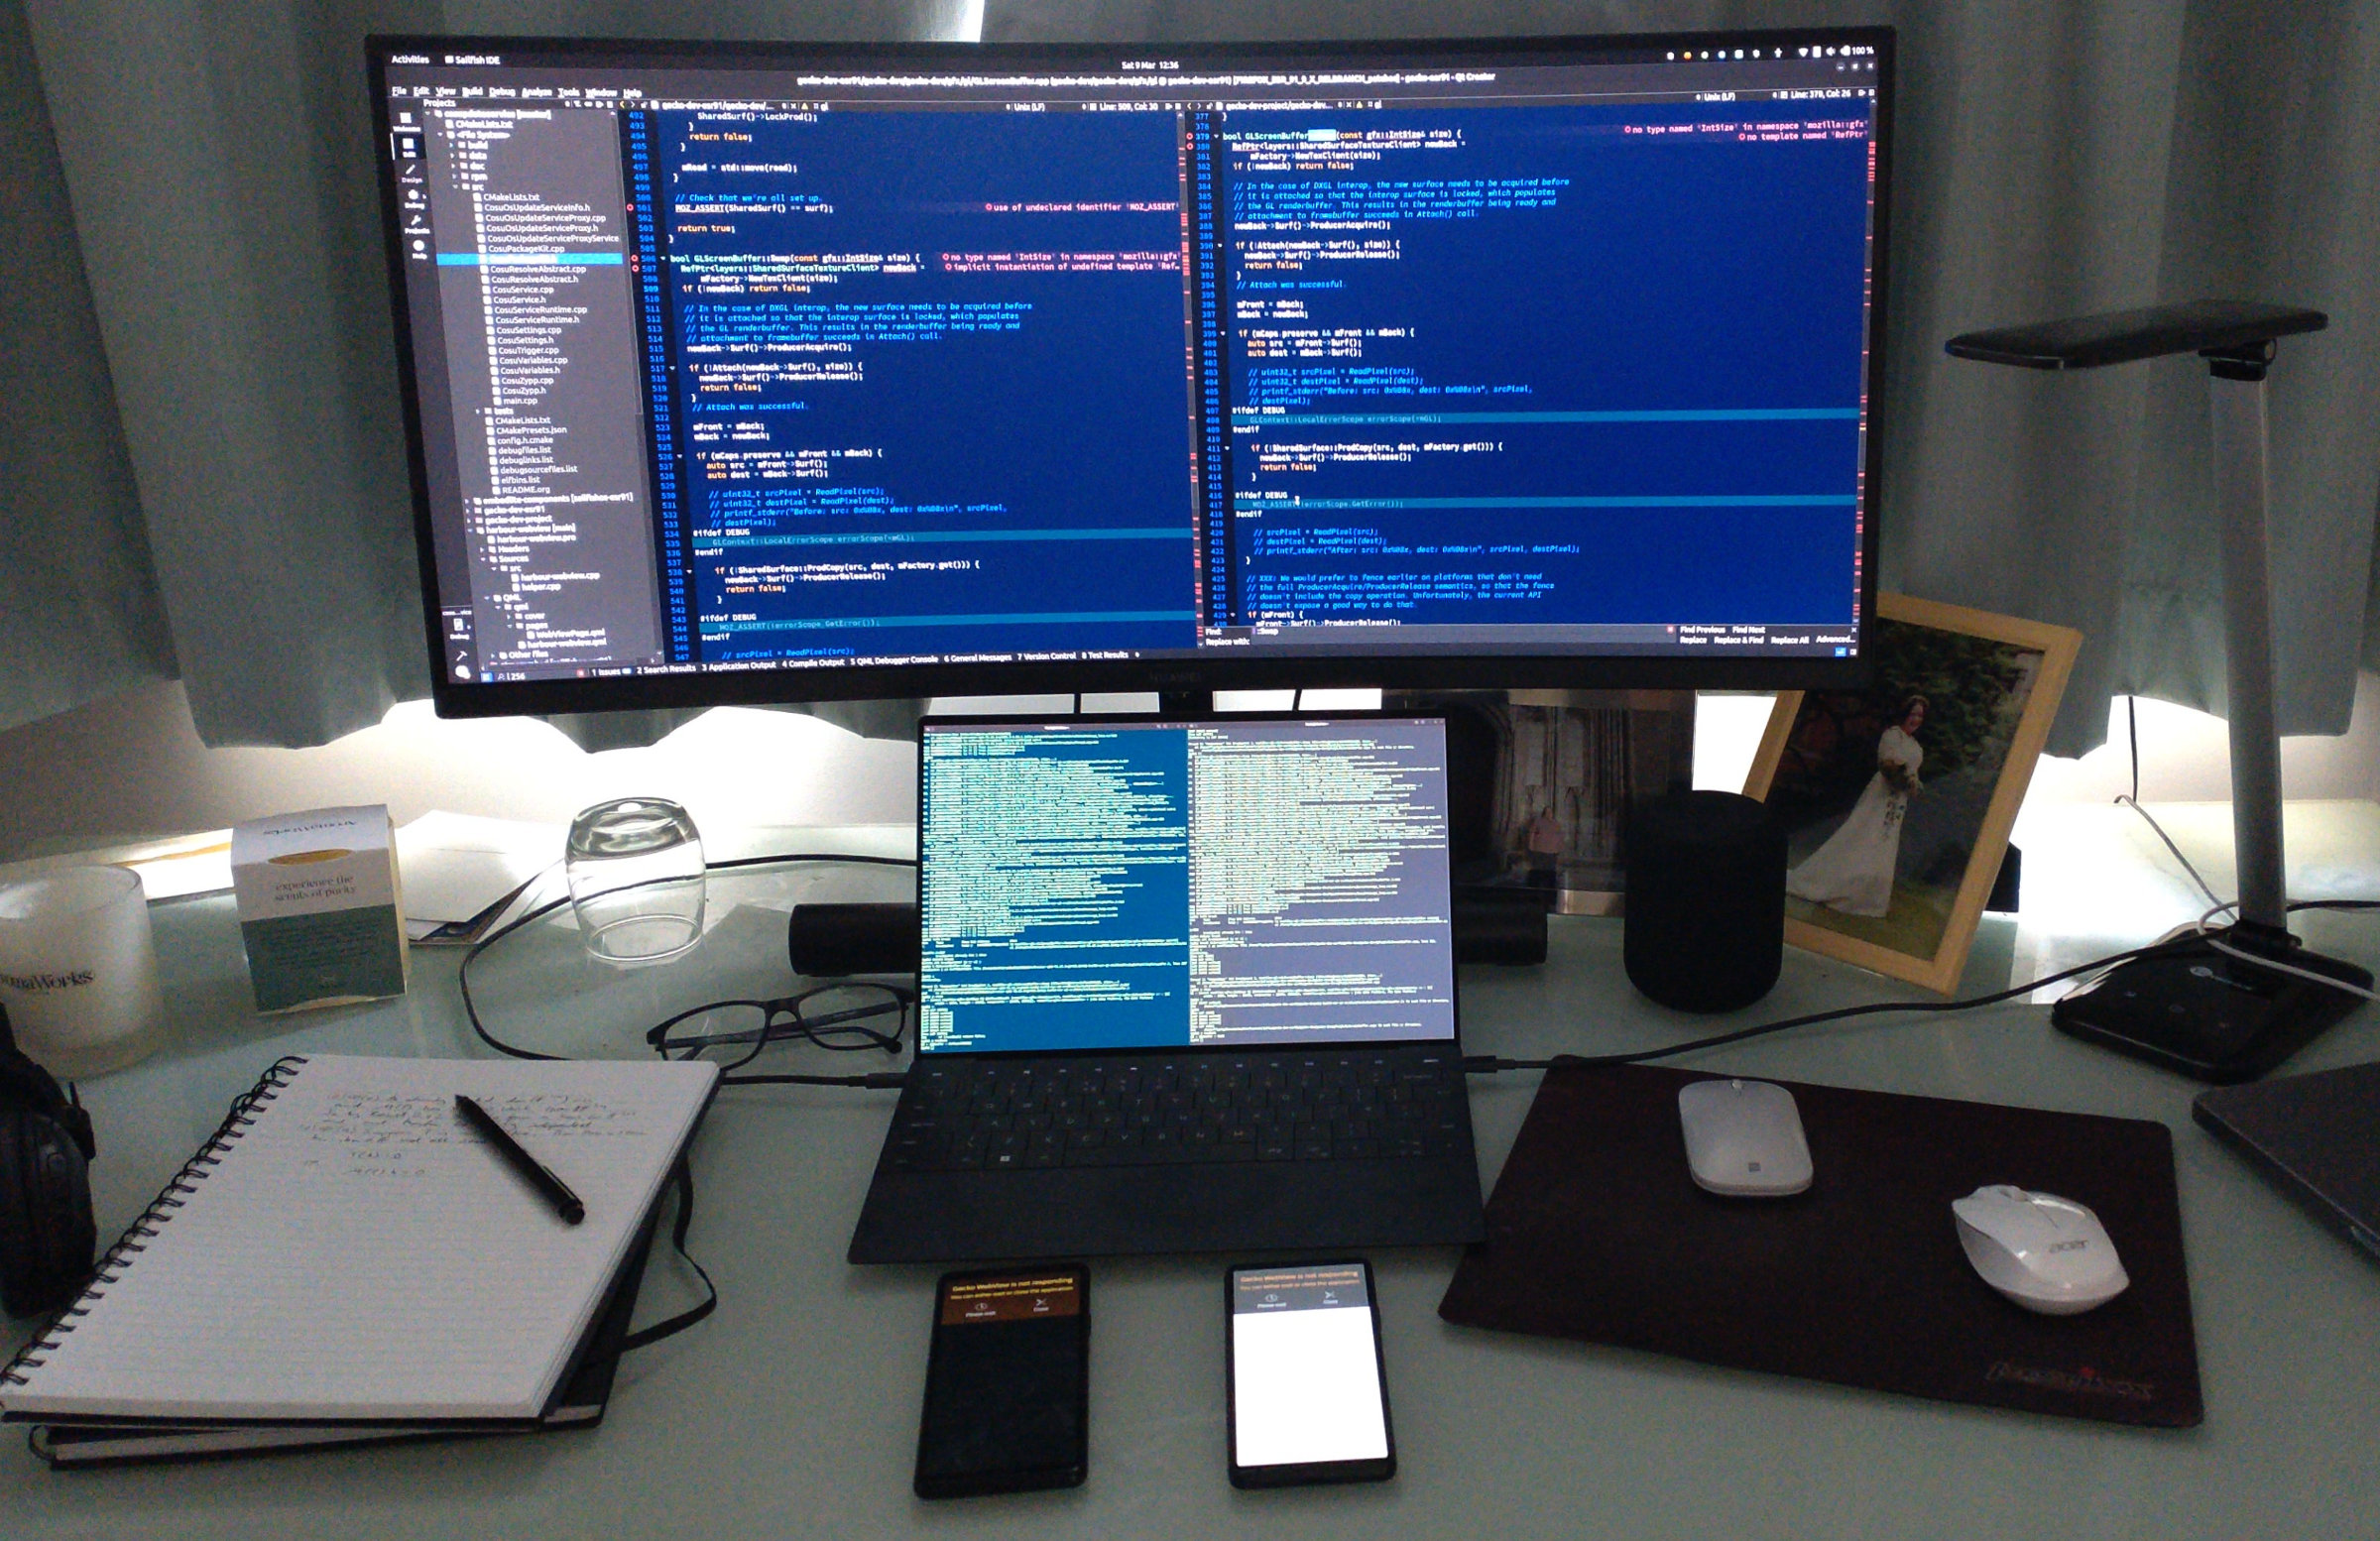
With this setup I can step through the code simultaneously on ESR 78 and ESR 91 to establish whether they diverge or not, and if so where. The first method I'm going to look at is the same one we started with yesterday, which is GLScreenBuffer::Swap(). What I'd really like to do is show the debugger output side-by-side here, but the line lengths are too wide for it to comfortably fit, so I'm just going to have to list them here serially.
Working this way it doesn't take long before I'm able to identify a critical issue. First ESR 78.
(gdb) b GLScreenBuffer::Swap
Breakpoint 2 at 0x7fb8e672b8: file dist/include/mozilla/UniquePtr.h, line 287.
(gdb) c
Continuing.
Thread 36 "Compositor" hit Breakpoint 2, mozilla::gl::GLScreenBuffer::Swap
(this=this@entry=0x7eac003c00, size=...)
at dist/include/mozilla/UniquePtr.h:287
287 in dist/include/mozilla/UniquePtr.h
(gdb) p size
$1 = (const mozilla::gfx::IntSize &) @0x7eac1deaa8:
{<mozilla::gfx::BaseSize<int, mozilla::gfx::IntSizeTyped<mozilla::gfx::
UnknownUnits> >> = {{{width = 1080, height = 2520}, components =
{1080, 2520}}}, <mozilla::gfx::UnknownUnits> = {<No data fields>},
<No data fields>}
(gdb) n
382 if (!newBack) return false;
(gdb) p newBack
$2 = {mRawPtr = 0x7eac138860}
(gdb)
And now ESR 91.
(gdb) break GLScreenBuffer::Swap
Breakpoint 2 at 0x7ff1106f8c: file ${PROJECT}/gfx/gl/GLScreenBuffer.cpp, line 506.
(gdb) c
Continuing.
[LWP 22652 exited]
Thread 36 "Compositor" hit Breakpoint 2, mozilla::gl::GLScreenBuffer::Swap
(this=this@entry=0x5555642d50, size=...)
at ${PROJECT}/gfx/gl/GLScreenBuffer.cpp:506
506 in ${PROJECT}/gfx/gl/GLScreenBuffer.cpp
(gdb) p size
$1 = (const mozilla::gfx::IntSize &) @0x7edc1a21e4:
{<mozilla::gfx::BaseSize<int, mozilla::gfx::IntSizeTyped<mozilla::gfx::
UnknownUnits> >> = {{{width = 1080, height = 2520}, components =
{1080, 2520}}}, <mozilla::gfx::UnknownUnits> = {<No data fields>},
<No data fields>}
(gdb) n
[LWP 22657 exited]
290 ${PROJECT}/obj-build-mer-qt-xr/dist/include/mozilla/UniquePtr.h:
No such file or directory.
(gdb) n
509 ${PROJECT}/gfx/gl/GLScreenBuffer.cpp: No such file or directory.
(gdb) p newBack
$2 = {mRawPtr = 0x0}
(gdb)
Debugging on the ESR 91 build isn't so clean due to the partial build messing up some of the debug source alignment, but we can nevertheless see that the call to SurfaceFactory_EGLImage::NewTexClient() is returning something sensible in ESR 78, but null in ESR 91. Here's the relevant code:
RefPtr<layers::SharedSurfaceTextureClient> newBack =
mFactory->NewTexClient(size);
if (!newBack) return false;
Let's ensure that mFactory is valid and of the correct type. First on ESR 78:
(gdb) p mFactory.mTuple.mFirstA $4 = (mozilla::gl::SurfaceFactory *) 0x7eac139b60 (gdb) set print object on (gdb) p mFactory.mTuple.mFirstA $5 = (mozilla::gl::SurfaceFactory_EGLImage *) 0x7eac139b60 (gdb) set print object off (gdb)And then, to compare, on ESR 91
(gdb) p mFactory.mTuple.mFirstA $7 = (mozilla::gl::SurfaceFactory *) 0x7edc1dc470 (gdb) set print object on (gdb) p mFactory.mTuple.mFirstA $8 = (mozilla::gl::SurfaceFactory_EGLImage *) 0x7edc1dc470 (gdb) set print object off (gdb)That all looks similar, so the next thing to check is what's happening inside SurfaceFactory_EGLImage::NewTexClient() that's preventing it from doing what it's supposed to. But when I try to place a breakpoint on SurfaceFactory_EGLImage::NewTexClient() I discover I can't: it doesn't exist.
The SurfaceFactory_EGLImage class must be inheriting the method from SurfaceFactory::NewTexClient(). So we can check by stepping through that. First the ESR 78 code.
(gdb) b SurfaceFactory::NewTexClient
Breakpoint 3 at 0x7fb8e6f338: file gfx/gl/SharedSurface.cpp, line 287.
(gdb) c
Continuing.
Thread 36 "Compositor" hit Breakpoint 3, mozilla::gl::SurfaceFactory::
NewTexClient (this=0x7eac139b60, size=...)
at gfx/gl/SharedSurface.cpp:287
287 SurfaceFactory::NewTexClient(const gfx::IntSize& size) {
(gdb) bt
#0 mozilla::gl::SurfaceFactory::NewTexClient (this=0x7eac139b60, size=...)
at gfx/gl/SharedSurface.cpp:287
#1 0x0000007fb8e672d8 in mozilla::gl::GLScreenBuffer::Swap
(this=this@entry=0x7eac003c00, size=...)
at dist/include/mozilla/UniquePtr.h:287
[...]
#25 0x0000007fbe70d89c in ?? () from /lib64/libc.so.6
(gdb) p size
$6 = (const mozilla::gfx::IntSize &) @0x7eac140ec8:
{<mozilla::gfx::BaseSize<int, mozilla::gfx::IntSizeTyped<mozilla::gfx::
UnknownUnits> >> = {{{width = 1080, height = 2520}, components =
{1080, 2520}}}, <mozilla::gfx::UnknownUnits> = {<No data fields>},
<No data fields>}
(gdb) p mRecycleFreePool
$7 = {mQueue = std::queue wrapping: std::deque with 0 elements}
(gdb) n
1367 include/c++/8.3.0/bits/stl_deque.h: No such file or directory.
(gdb) n
300 UniquePtr<SharedSurface> surf = CreateShared(size);
(gdb) n
301 if (!surf) return nullptr;
(gdb) p surf.mTuple.mFirstA
$8 = (mozilla::gl::SharedSurface *) 0x7eac1802b0
(gdb) n
292 dist/include/mozilla/UniquePtr.h: No such file or directory.
(gdb) n
289 dist/include/mozilla/RefPtr.h: No such file or directory.
(gdb) n
305 mAllocator, mFlags);
(gdb) n
307 StartRecycling(ret);
(gdb) p ret
$10 = {mRawPtr = 0x7eac138910}
(gdb) p mAllocator
$11 = {mRawPtr = 0x0}
(gdb) p mFlags
$12 = mozilla::layers::TextureFlags::ORIGIN_BOTTOM_LEFT
(gdb)
Notice how the call to CreateShared() returns an object which then when moved into Create() returns another object. The allocator is null and the flags are set to ORIGIN_BOTTOM_LEFT.On ESR 91 there's a big difference: although mAllocator and mFlags are set correctly, the call to CreateShared returns null. Immediately afterwards the method notices this and returns early.
(gdb) b SurfaceFactory::NewTexClient
Breakpoint 3 at 0x7ff111d888: file ${PROJECT}/gfx/gl/SharedSurface.cpp, line 393.
(gdb) c
Continuing.
Thread 36 "Compositor" hit Breakpoint 3, mozilla::gl::SurfaceFactory::
NewTexClient (this=0x7edc1dc470, size=...)
at ${PROJECT}/gfx/gl/SharedSurface.cpp:393
393 ${PROJECT}/gfx/gl/SharedSurface.cpp: No such file or directory.
(gdb) bt
#0 mozilla::gl::SurfaceFactory::NewTexClient (this=0x7edc1dc470, size=...)
at ${PROJECT}/gfx/gl/SharedSurface.cpp:393
#1 0x0000007ff1106fac in mozilla::gl::GLScreenBuffer::Swap
(this=this@entry=0x5555642d50, size=...)
at ${PROJECT}/obj-build-mer-qt-xr/dist/include/mozilla/UniquePtr.h:290
[...]
#24 0x0000007ff6a0489c in ?? () from /lib64/libc.so.6
(gdb) p size
$17 = (const mozilla::gfx::IntSize &) @0x7ed81a22e4:
{<mozilla::gfx::BaseSize<int, mozilla::gfx::IntSizeTyped<mozilla::gfx::
UnknownUnits> >> = {{{width = 1080, height = 2520}, components =
{1080, 2520}}}, <mozilla::gfx::UnknownUnits> = {<No data fields>},
<No data fields>}
(gdb) p mRecycleFreePool
$18 = {mQueue = std::queue wrapping: std::deque with 0 elements}
(gdb) p mAllocator
$19 = {mRawPtr = 0x0}
(gdb) p mFlags
$20 = mozilla::layers::TextureFlags::ORIGIN_BOTTOM_LEFT
(gdb) p mRecycleFreePool
$21 = {mQueue = std::queue wrapping: std::deque with 0 elements}
(gdb) n
394 in ${PROJECT}/gfx/gl/SharedSurface.cpp
(gdb) n
406 in ${PROJECT}/gfx/gl/SharedSurface.cpp
(gdb) n
407 in ${PROJECT}/gfx/gl/SharedSurface.cpp
(gdb) p surf.mTuple.mFirstA
$22 = (mozilla::gl::SharedSurface *) 0x0
(gdb) n
79 ${PROJECT}/obj-build-mer-qt-xr/dist/include/mozilla/RefPtr.h:
No such file or directory.
(gdb) n
mozilla::gl::GLScreenBuffer::Swap (this=this@entry=0x5555643a10, size=...)
at ${PROJECT}/gfx/gl/GLScreenBuffer.cpp:509
509 ${PROJECT}/gfx/gl/GLScreenBuffer.cpp: No such file or directory.
(gdb)
So it would seem that there's a problem in CreateShared(), so the next step will be to drill down into that. That's all I've time for today though; we'll pick this up again tomorrow.If you'd like to read any of my other gecko diary entries, they're all available on my Gecko-dev Diary page.
11 Mar 2024 : Day 182 #
We reached an important milestone yesterday when our WebView-augmented app finally ran without crashing for the first time. There's still nothing being rendered to the screen, but preventing the app from crashing feels like an important waypoint on the journey towards the result we want.
But crashes have their uses. In particular, when an app crashes the debugger provides a backtrace which can be the bedrock of an investigation; a place to start and fall back to in case things spiral out of control. Now we're presented with something more nebulous: somewhere in the program there are one or many bugs, or differences in execution, between the ESR 78 and ESR 91 rendering pipelines that we need to find and rewire. We've been here before, with the original browser rendering pipeline. That time it took a few weeks before I managed to find the root cause. I'm not expecting this to be any easier.
The first thing to check is whether the render loop is actually being called. Here we have something to go on in the form of the GLScreenBuffer::Swap() method. This should be called every frame in order to move the image on the back buffer onto the front buffer. We can use the debugger to see whether it's being called.
So let's try and find out why. In ESR 78 the code that's being called from CompositorVsyncScheduler::Composite() is the following:
I'm going to leave it there for today. Tomorrow we'll look further into the differences between ESR 78 and ESR 91.
If you'd like to read any of my other gecko diary entries, they're all available on my Gecko-dev Diary page.
Comment
But crashes have their uses. In particular, when an app crashes the debugger provides a backtrace which can be the bedrock of an investigation; a place to start and fall back to in case things spiral out of control. Now we're presented with something more nebulous: somewhere in the program there are one or many bugs, or differences in execution, between the ESR 78 and ESR 91 rendering pipelines that we need to find and rewire. We've been here before, with the original browser rendering pipeline. That time it took a few weeks before I managed to find the root cause. I'm not expecting this to be any easier.
The first thing to check is whether the render loop is actually being called. Here we have something to go on in the form of the GLScreenBuffer::Swap() method. This should be called every frame in order to move the image on the back buffer onto the front buffer. We can use the debugger to see whether it's being called.
(gdb) b GLScreenBuffer::Swap
Breakpoint 1 at 0x7ff1106f8c: file ${PROJECT}/gecko-dev/gfx/gl/
GLScreenBuffer.cpp, line 506.
(gdb) c
Continuing.
[LWP 1224 exited]
[LWP 1218 exited]
[New LWP 1735]
[LWP 1255 exited]
No hits. In one sense this is bad: something is broken. On the other hand, it's also good: we already knew something was broken, this at least gives us something concrete to fix. So the next step is to see whether it's also actually being called on ESR 78. It could be that I've misunderstood how this rendering pipeline is supposed to work.
(gdb) b GLScreenBuffer::Swap
Breakpoint 1 at 0x7fb8e672b8: file obj-build-mer-qt-xr/dist/include/mozilla/
UniquePtr.h, line 287.
(gdb) c
Continuing.
[LWP 20447 exited]
[LWP 20440 exited]
[LWP 20511 exited]
[LWP 20460 exited]
Also no hit! Ah... that is until I touch the screen. Then suddenly this:
[New LWP 20679]
[New LWP 20680]
[New LWP 20681]
[New LWP 20682]
[Switching to LWP 20444]
Thread 36 "Compositor" hit Breakpoint 1, mozilla::gl::GLScreenBuffer::Swap
(this=this@entry=0x7eac003c00, size=...)
at obj-build-mer-qt-xr/dist/include/mozilla/UniquePtr.h:287
287 obj-build-mer-qt-xr/dist/include/mozilla/UniquePtr.h:
No such file or directory.
(gdb)
We should get a backtrace from ESR 78 to compare against.
(gdb) bt
#0 mozilla::gl::GLScreenBuffer::Swap (this=this@entry=0x7eac003c00, size=...)
at obj-build-mer-qt-xr/dist/include/mozilla/UniquePtr.h:287
#1 0x0000007fbb2e2d8c in mozilla::gl::GLScreenBuffer::PublishFrame
(size=..., this=0x7eac003c00)
at obj-build-mer-qt-xr/dist/include/GLScreenBuffer.h:171
#2 mozilla::embedlite::EmbedLiteCompositorBridgeParent::
PresentOffscreenSurface (this=0x7f8c99d3b0)
at mobile/sailfishos/embedthread/EmbedLiteCompositorBridgeParent.cpp:183
#3 0x0000007fbb2f8600 in mozilla::embedlite::nsWindow::PostRender
(this=0x7f8c87db30, aContext=<optimized out>)
at mobile/sailfishos/embedshared/nsWindow.cpp:395
#4 0x0000007fb8fbff4c in mozilla::layers::LayerManagerComposite::Render
(this=this@entry=0x7eac1988c0, aInvalidRegion=..., aOpaqueRegion=...)
at obj-build-mer-qt-xr/dist/include/mozilla/TimeStamp.h:452
#5 0x0000007fb8fc02c4 in mozilla::layers::LayerManagerComposite::
UpdateAndRender (this=this@entry=0x7eac1988c0)
at gfx/layers/composite/LayerManagerComposite.cpp:647
#6 0x0000007fb8fc0514 in mozilla::layers::LayerManagerComposite::
EndTransaction (aFlags=mozilla::layers::LayerManager::END_DEFAULT,
aTimeStamp=..., this=0x7eac1988c0) at gfx/layers/composite/
LayerManagerComposite.cpp:566
#7 mozilla::layers::LayerManagerComposite::EndTransaction (this=0x7eac1988c0,
aTimeStamp=..., aFlags=mozilla::layers::LayerManager::END_DEFAULT)
at gfx/layers/composite/LayerManagerComposite.cpp:536
#8 0x0000007fb8fe7f9c in mozilla::layers::CompositorBridgeParent::
CompositeToTarget (this=0x7f8c99d3b0, aId=..., aTarget=0x0,
aRect=<optimized out>)
at obj-build-mer-qt-xr/dist/include/mozilla/RefPtr.h:313
#9 0x0000007fbb2e288c in mozilla::embedlite::EmbedLiteCompositorBridgeParent::
CompositeToDefaultTarget (this=0x7f8c99d3b0, aId=...)
at mobile/sailfishos/embedthread/EmbedLiteCompositorBridgeParent.cpp:159
#10 0x0000007fb8fc7988 in mozilla::layers::CompositorVsyncScheduler::Composite
(this=0x7f8cbacc40, aId=..., aVsyncTimestamp=...)
at gfx/layers/ipc/CompositorVsyncScheduler.cpp:249
#11 0x0000007fb8fc5ff0 in mozilla::detail::RunnableMethodArguments
<mozilla::layers::BaseTransactionId<mozilla::VsyncIdType>,
mozilla::TimeStamp>::applyImpl<mozilla::layers::CompositorVsyncScheduler,
void (mozilla::layers::CompositorVsyncScheduler::*)(mozilla::layers::
BaseTransactionId<mozilla::VsyncIdType>, mozilla::TimeStamp),
StoreCopyPassByConstLRef<mozilla::layers::BaseTransactionId<mozilla::
VsyncIdType> >, StoreCopyPassByConstLRef<mozilla::TimeStamp>, 0ul, 1ul>
(args=..., m=<optimized out>, o=<optimized out>)
at obj-build-mer-qt-xr/dist/include/nsThreadUtils.h:925
[...]
#24 0x0000007fbe70d89c in ?? () from /lib64/libc.so.6
(gdb)
Going back to ESR 91, it turns out the method isn't missing after all, it just needs a bit of prodding to get it to be called. So on touching the screen I get the same result. We should compare the backtraces. Here's what we get from ESR 91:
Thread 38 "Compositor" hit Breakpoint 1, mozilla::gl::GLScreenBuffer::Swap
(this=this@entry=0x5555643950, size=...)
at ${PROJECT}/gecko-dev/gfx/gl/GLScreenBuffer.cpp:506
506 ${PROJECT}/gecko-dev/gfx/gl/GLScreenBuffer.cpp: No such file or directory.
(gdb) bt
#0 mozilla::gl::GLScreenBuffer::Swap (this=this@entry=0x5555643950, size=...)
at ${PROJECT}/gecko-dev/gfx/gl/GLScreenBuffer.cpp:506
#1 0x0000007ff36667a8 in mozilla::gl::GLScreenBuffer::PublishFrame
(size=..., this=0x5555643950)
at ${PROJECT}/obj-build-mer-qt-xr/dist/include/GLScreenBuffer.h:229
#2 mozilla::embedlite::EmbedLiteCompositorBridgeParent::PresentOffscreenSurface
(this=0x7fc49fde60)
at ${PROJECT}/gecko-dev/mobile/sailfishos/embedthread/
EmbedLiteCompositorBridgeParent.cpp:191
#3 0x0000007ff367fc0c in mozilla::embedlite::nsWindow::PostRender
(this=0x7fc49fc290, aContext=<optimized out>)
at ${PROJECT}/gecko-dev/mobile/sailfishos/embedshared/nsWindow.cpp:248
#4 0x0000007ff2a64ec0 in mozilla::widget::InProcessCompositorWidget::PostRender
(this=0x7fc4b8df00, aContext=0x7f1f970848)
at ${PROJECT}/gecko-dev/widget/InProcessCompositorWidget.cpp:60
#5 0x0000007ff128f9f4 in mozilla::layers::LayerManagerComposite::Render
(this=this@entry=0x7ed41bb450, aInvalidRegion=..., aOpaqueRegion=...)
at ${PROJECT}/obj-build-mer-qt-xr/dist/include/mozilla/layers/Compositor.h:575
#6 0x0000007ff128fe70 in mozilla::layers::LayerManagerComposite::
UpdateAndRender (this=this@entry=0x7ed41bb450)
at ${PROJECT}/gecko-dev/gfx/layers/composite/LayerManagerComposite.cpp:657
#7 0x0000007ff1290220 in mozilla::layers::LayerManagerComposite::EndTransaction
(this=this@entry=0x7ed41bb450, aTimeStamp=...,
aFlags=aFlags@entry=mozilla::layers::LayerManager::END_DEFAULT)
at ${PROJECT}/gecko-dev/gfx/layers/composite/LayerManagerComposite.cpp:572
#8 0x0000007ff12d19bc in mozilla::layers::CompositorBridgeParent::
CompositeToTarget (this=0x7fc49fde60, aId=..., aTarget=0x0,
aRect=<optimized out>)
at ${PROJECT}/obj-build-mer-qt-xr/dist/include/mozilla/RefPtr.h:313
#9 0x0000007ff12b7104 in mozilla::layers::CompositorVsyncScheduler::Composite
(this=0x7fc429cac0, aVsyncEvent=...)
at ${PROJECT}/gecko-dev/gfx/layers/ipc/CompositorVsyncScheduler.cpp:256
#10 0x0000007ff12af57c in mozilla::detail::RunnableMethodArguments<mozilla::
VsyncEvent>::applyImpl<mozilla::layers::CompositorVsyncScheduler, void
(mozilla::layers::CompositorVsyncScheduler::*)(mozilla::VsyncEvent const&),
StoreCopyPassByConstLRef<mozilla::VsyncEvent>, 0ul> (args=...,
m=<optimized out>, o=<optimized out>)
at ${PROJECT}/obj-build-mer-qt-xr/dist/include/nsThreadUtils.h:887
[...]
#22 0x0000007ff6a0489c in ?? () from /lib64/libc.so.6
(gdb)
Both are largely similar, both are initially triggered from the vsync scheduler CompositorVsyncScheduler(), which makes sense for a render update pipeline. But there are some differences too. In between the vsync scheduler and the layer manager's EndTransaction() call we have this on ESR 78:
#7 LayerManagerComposite::EndTransaction, LayerManagerComposite.cpp:536
#8 CompositorBridgeParent::CompositeToTarget, mozilla/RefPtr.h:313
#9 EmbedLiteCompositorBridgeParent::CompositeToDefaultTarget,
EmbedLiteCompositorBridgeParent.cpp:159
#10 CompositorVsyncScheduler::Composite, CompositorVsyncScheduler.cpp:249
Whereas on ESR 91 we have this:
#7 LayerManagerComposite::EndTransaction, LayerManagerComposite.cpp:572 #8 CompositorBridgeParent::CompositeToTarget, RefPtr.h:313 #9 CompositorVsyncScheduler::Composite, CompositorVsyncScheduler.cpp:256It could be that this is a completely benign change, either due to us hitting a breakpoint at a slightly different point in the cycle, or due to upstream changes that are unrelated to the rendering issues we're experiencing. But I'm honing in on it because I remember there being differences in the way the target is set up and this immediately looks suspicious to me. Especially suspicious is the fact that EmbedLiteCompositorBridgeParent has been written out of the ESR 91 execution flow. That's Sailfish-specific code, so that could well indicate a problem.
So let's try and find out why. In ESR 78 the code that's being called from CompositorVsyncScheduler::Composite() is the following:
// Tell the owner to do a composite
mVsyncSchedulerOwner->CompositeToDefaultTarget(aId);
mVsyncNotificationsSkipped = 0;
In ESR 91 we have a strange addition to this.
// Tell the owner to do a composite
mVsyncSchedulerOwner->CompositeToTarget(aVsyncEvent.mId, nullptr, nullptr);
mVsyncSchedulerOwner->CompositeToDefaultTarget(aVsyncEvent.mId);
mVsyncNotificationsSkipped = 0;
The extra line spacing makes this look very intentional, but the real question I'd like to know the answer to is: "was this change done by upstream or by me?". If it was upstream then it's almost certainly intentional. If it was me, well, then it could well be a mistake. We can find out, as always, using git.
git blame gfx/layers/ipc/CompositorVsyncScheduler.cpp -L 255,259
Blaming lines: 1% (5/370), done.
7a2ef4343bb1d (Kartikaya Gupta 2018-02-01 16:28:53 -0500 255)
// Tell the owner to do a composite
97287dc1b1d82 (Markus Stange 2020-07-18 05:17:39 +0000 256)
mVsyncSchedulerOwner->CompositeToTarget(aVsyncEvent.mId, nullptr, nullptr);
0acadeba1ac39 (David Llewellyn-Jones 2023-08-28 14:55:57 +0100 257)
mVsyncSchedulerOwner->CompositeToDefaultTarget(aVsyncEvent.mId);
7a2ef4343bb1d (Kartikaya Gupta 2018-02-01 16:28:53 -0500 258)
133e28473a0f8 (Sotaro Ikeda 2016-11-18 02:37:04 -0800 259)
mVsyncNotificationsSkipped = 0;
Well, that's interesting. There is a line inserted by me, but it's not the line I was expecting. It looks very much like I added the line and intended to remove the line before, but forgot. I'm going to rectify this.
$ git diff gfx/layers/ipc/CompositorVsyncScheduler.cpp
diff --git a/gfx/layers/ipc/CompositorVsyncScheduler.cpp
b/gfx/layers/ipc/CompositorVsyncScheduler.cpp
index 2e8e58a2c46b..3abe24ceeeea 100644
--- a/gfx/layers/ipc/CompositorVsyncScheduler.cpp
+++ b/gfx/layers/ipc/CompositorVsyncScheduler.cpp
@@ -253,9 +253,7 @@ void CompositorVsyncScheduler::Composite
(const VsyncEvent& aVsyncEvent) {
mLastComposeTime = SampleTime::FromVsync(aVsyncEvent.mTime);
// Tell the owner to do a composite
- mVsyncSchedulerOwner->CompositeToTarget(aVsyncEvent.mId, nullptr, nullptr);
mVsyncSchedulerOwner->CompositeToDefaultTarget(aVsyncEvent.mId);
-
mVsyncNotificationsSkipped = 0;
TimeDuration compositeFrameTotal = TimeStamp::Now() - aVsyncEvent.mTime;
Line removed. Now to build and see what happens when we try to run it.
(gdb) b GLScreenBuffer::Swap
Breakpoint 1 at 0x7ff1106f8c: file ${PROJECT}/gecko-dev/gfx/gl/
GLScreenBuffer.cpp, line 506.
(gdb) c
Continuing.
[LWP 22665 exited]
[New LWP 22740]
[Switching to LWP 22660]
Thread 36 "Compositor" hit Breakpoint 1, mozilla::gl::GLScreenBuffer::Swap
(this=this@entry=0x5555642d50, size=...)
at ${PROJECT}/gecko-dev/gfx/gl/GLScreenBuffer.cpp:506
506 ${PROJECT}/gecko-dev/gfx/gl/GLScreenBuffer.cpp:
No such file or directory.
(gdb) bt
#0 mozilla::gl::GLScreenBuffer::Swap (this=this@entry=0x5555642d50, size=...)
at ${PROJECT}/gecko-dev/gfx/gl/GLScreenBuffer.cpp:506
#1 0x0000007ff3666788 in mozilla::gl::GLScreenBuffer::PublishFrame
(size=..., this=0x5555642d50)
at ${PROJECT}/obj-build-mer-qt-xr/dist/include/GLScreenBuffer.h:229
#2 mozilla::embedlite::EmbedLiteCompositorBridgeParent::PresentOffscreenSurface
(this=0x7fc49fde10)
at ${PROJECT}/gecko-dev/mobile/sailfishos/embedthread/
EmbedLiteCompositorBridgeParent.cpp:191
#3 0x0000007ff367fbec in mozilla::embedlite::nsWindow::PostRender
(this=0x7fc49fc240, aContext=<optimized out>)
at ${PROJECT}/gecko-dev/mobile/sailfishos/embedshared/nsWindow.cpp:248
#4 0x0000007ff2a64ea4 in mozilla::widget::InProcessCompositorWidget::PostRender
(this=0x7fc4b88770, aContext=0x7f177f87e8)
at ${PROJECT}/gecko-dev/widget/InProcessCompositorWidget.cpp:60
#5 0x0000007ff128f9f4 in mozilla::layers::LayerManagerComposite::Render
(this=this@entry=0x7edc1bb450, aInvalidRegion=..., aOpaqueRegion=...)
at ${PROJECT}/obj-build-mer-qt-xr/dist/include/mozilla/layers/
Compositor.h:575
#6 0x0000007ff128fe70 in mozilla::layers::LayerManagerComposite::
UpdateAndRender (this=this@entry=0x7edc1bb450)
at ${PROJECT}/gecko-dev/gfx/layers/composite/LayerManagerComposite.cpp:657
#7 0x0000007ff1290220 in mozilla::layers::LayerManagerComposite::EndTransaction
(this=this@entry=0x7edc1bb450, aTimeStamp=...,
aFlags=aFlags@entry=mozilla::layers::LayerManager::END_DEFAULT)
at ${PROJECT}/gecko-dev/gfx/layers/composite/LayerManagerComposite.cpp:572
#8 0x0000007ff12d19a0 in mozilla::layers::CompositorBridgeParent::
CompositeToTarget (this=0x7fc49fde10, aId=..., aTarget=0x0,
aRect=<optimized out>)
at ${PROJECT}/obj-build-mer-qt-xr/dist/include/mozilla/RefPtr.h:313
#9 0x0000007ff3666488 in mozilla::embedlite::EmbedLiteCompositorBridgeParent::
CompositeToDefaultTarget (this=0x7fc49fde10, aId=...)
at ${PROJECT}/gecko-dev/mobile/sailfishos/embedthread/
EmbedLiteCompositorBridgeParent.cpp:165
#10 0x0000007ff12b70fc in mozilla::layers::CompositorVsyncScheduler::Composite
(this=0x7fc4b82ef0, aVsyncEvent=...)
at ${PROJECT}/gecko-dev/gfx/layers/ipc/CompositorVsyncScheduler.cpp:256
#11 0x0000007ff12af57c in mozilla::detail::RunnableMethodArguments<mozilla::
VsyncEvent>::applyImpl<mozilla::layers::CompositorVsyncScheduler, void
(mozilla::layers::CompositorVsyncScheduler::*)(mozilla::VsyncEvent const&),
StoreCopyPassByConstLRef<mozilla::VsyncEvent>, 0ul> (args=...,
m=<optimized out>, o=<optimized out>)
at ${PROJECT}/obj-build-mer-qt-xr/dist/include/nsThreadUtils.h:887
[...]
#23 0x0000007ff6a0489c in ?? () from /lib64/libc.so.6
(gdb)
Let's strip out the part we're interested in.
#7 LayerManagerComposite::EndTransaction, LayerManagerComposite.cpp:572
#8 CompositorBridgeParent::CompositeToTarget, RefPtr.h:313
#9 EmbedLiteCompositorBridgeParent::CompositeToDefaultTarget,
EmbedLiteCompositorBridgeParent.cpp:165
#10 CompositorVsyncScheduler::Composite, CompositorVsyncScheduler.cpp:256
If we compare this with the previous backtrace from ESR 78 we can see that's now aligning fully. Unfortunately, despite fixing this issue, it doesn't give us a working render: the screen is still just plain white. But it will be one step on the way to fixing things fully.I'm going to leave it there for today. Tomorrow we'll look further into the differences between ESR 78 and ESR 91.
If you'd like to read any of my other gecko diary entries, they're all available on my Gecko-dev Diary page.
10 Mar 2024 : Day 181 #
Today it's time to test out the changes I made yesterday, adding in the SharedSurface_Basic functionality that got lost in the transition to ESR 91. The key change is that now the ProdTexture() will be overridden and so the call to it from SurfaceFactory during initialisation should — I'm hoping — no longer trigger a crash.
One of the downsides of using the massive partial libxul.so builds packed full of debugging information is that they just take up so much room on the device. But after deleting the library, the reinstallation of it then goes through without a hitch. It does strike me as a little odd that the calculation for how much space is needed doesn't take into account how much will be removed as well as how much will be added. I guess this is important for allowing transactional updates.
Nevertheless, this still seems to be a crash due to a missing override, as we can see from the error message that's output: "Did you forget to override this function". It's an induced crash again. But this time the surface is of type SharedSurface_EGLImage. Probably we'll have to add the overrides into this class as well. This will be similar to the work I did yesterday, but this time applied to a different class that's also inheriting from SharedSurface.
Looking at the SharedSurface_EGLImage class definition in SharedSurfaceEGL.h there are some very distinct differences between ESR 78 and ESR 91, including the lack of a ProdTexture() override in ESR 91. Here are the relevant code pieces from ESR 78 (I've rearranged some of the line orders for clarity):
The mFormats variable is also missing from ESR 91, but I can't see anywhere that's used in a meaningful way, so I'll leave that out. The Cast() method has also been removed. But the logic for this is pretty simple and it looks like this has just been replaced with the same logic and direct cast in the various places it's used in the code, rather than in a separate method. Given this, there looks to be no need to revert this particular change.
The other change I've had to make is to the SharedSurface_EGLImage::Create() and SurfaceFactory_EGLImage::Create() methods. I've changed their implementations slightly and redirected them to use the new (old?) constructors.
With all of these changes in place compilation the partial build now goes through. I've linked the partial build, copied it over to my phone and manually copied it to the correct directory. Now to see whether it's had any effect.
I'm afraid to say, there's still a long journey ahead of us. But we are still, slowly but surely, moving forwards.
If you'd like to read any of my other gecko diary entries, they're all available on my Gecko-dev Diary page.
Comment
One of the downsides of using the massive partial libxul.so builds packed full of debugging information is that they just take up so much room on the device. But after deleting the library, the reinstallation of it then goes through without a hitch. It does strike me as a little odd that the calculation for how much space is needed doesn't take into account how much will be removed as well as how much will be added. I guess this is important for allowing transactional updates.
$ rpm -U xulrunner-qt5-91.*.rpm xulrunner-qt5-debuginfo-91.*.rpm \
xulrunner-qt5-debugsource-91.*.rpm xulrunner-qt5-misc-91.*.rpm
installing package xulrunner-qt5-91.9.1+git1.aarch64 needs 7MB more
space on the / filesystem
$ rm /usr/lib64/xulrunner-qt5-91.9.1/libxul.so
$ rpm -U xulrunner-qt5-91.*.rpm xulrunner-qt5-debuginfo-91.*.rpm \
xulrunner-qt5-debugsource-91.*.rpm xulrunner-qt5-misc-91.*.rpm
When running the new code it still almost immediately crashes. And that's not a surprise; I'm expecting at least a few more cycles of this "run-crash-debug-fix" process before we have something working.
Thread 37 "Compositor" received signal SIGSEGV, Segmentation fault.
[Switching to LWP 4396]
0x0000007ff1107dc4 in mozilla::gl::SharedSurface::ProdTexture
(this=<optimized out>)
at gfx/gl/SharedSurface.h:157
157 MOZ_CRASH("GFX: Did you forget to override this function?");
(gdb) bt
#0 0x0000007ff1107dc4 in mozilla::gl::SharedSurface::ProdTexture
(this=<optimized out>)
at gfx/gl/SharedSurface.h:157
#1 0x0000007ff1106cc4 in mozilla::gl::ReadBuffer::Attach (this=0x7ed41a1700,
surf=surf@entry=0x7ed419f9c0)
at gfx/gl/GLScreenBuffer.cpp:718
#2 0x0000007ff1106ebc in mozilla::gl::GLScreenBuffer::Attach
(this=this@entry=0x5555642e30, surf=0x7ed419f9c0, size=...)
at gfx/gl/GLScreenBuffer.cpp:486
#3 0x0000007ff1106f60 in mozilla::gl::GLScreenBuffer::Swap
(this=this@entry=0x5555642e30, size=...)
at ${PROJECT}/obj-build-mer-qt-xr/dist/include/mozilla/UniquePtr.h:290
[...]
#25 0x0000007ff6a0489c in ?? () from /lib64/libc.so.6
(gdb) p this
$6 = <optimized out>
(gdb) frame 1
#1 0x0000007ff1106cc4 in mozilla::gl::ReadBuffer::Attach (this=0x7ed41a1700, surf=surf@entry=0x7ed419f9c0)
at gfx/gl/GLScreenBuffer.cpp:718
718 colorTex = surf->ProdTexture();
(gdb) p surf
$3 = (mozilla::gl::SharedSurface *) 0x7ed419f9c0
(gdb) set print object on
(gdb) p surf
$5 = (mozilla::gl::SharedSurface_EGLImage *) 0x7ed419f9c0
(gdb) set print object off
(gdb)
My initial reaction is that this is the same error that I spent yesterday trying to fix. But on closer inspection it's actually a little different. So maybe the changes made yesterday were actually worthwhile after all?Nevertheless, this still seems to be a crash due to a missing override, as we can see from the error message that's output: "Did you forget to override this function". It's an induced crash again. But this time the surface is of type SharedSurface_EGLImage. Probably we'll have to add the overrides into this class as well. This will be similar to the work I did yesterday, but this time applied to a different class that's also inheriting from SharedSurface.
Looking at the SharedSurface_EGLImage class definition in SharedSurfaceEGL.h there are some very distinct differences between ESR 78 and ESR 91, including the lack of a ProdTexture() override in ESR 91. Here are the relevant code pieces from ESR 78 (I've rearranged some of the line orders for clarity):
class SharedSurface_EGLImage : public SharedSurface {
[...]
protected:
mutable Mutex mMutex;
const GLFormats mFormats;
GLuint mProdTex;
[...]
virtual GLuint ProdTexture() override { return mProdTex; }
[...]
In comparison, the ProdTexture() method and associated mProdTex member variable are both missing in ESR 91. I'll need to add them in, along with all the logic associated with them.The mFormats variable is also missing from ESR 91, but I can't see anywhere that's used in a meaningful way, so I'll leave that out. The Cast() method has also been removed. But the logic for this is pretty simple and it looks like this has just been replaced with the same logic and direct cast in the various places it's used in the code, rather than in a separate method. Given this, there looks to be no need to revert this particular change.
static SharedSurface_EGLImage* Cast(SharedSurface* surf) {
MOZ_ASSERT(surf->mType == SharedSurfaceType::EGLImageShare);
return (SharedSurface_EGLImage*)surf;
}
Possibly these were changes I made myself at some point in the (now distant!) past while performing this update.The other change I've had to make is to the SharedSurface_EGLImage::Create() and SurfaceFactory_EGLImage::Create() methods. I've changed their implementations slightly and redirected them to use the new (old?) constructors.
With all of these changes in place compilation the partial build now goes through. I've linked the partial build, copied it over to my phone and manually copied it to the correct directory. Now to see whether it's had any effect.
$ harbour-webview
[D] unknown:0 - QML debugging is enabled. Only use this in a safe environment.
[D] main:30 - WebView Example
[D] main:47 - Opening webview
[D] unknown:0 - Using Wayland-EGL
[...]
Created LOG for EmbedLiteLayerManager
=============== Preparing offscreen rendering context ===============
CONSOLE message:
OpenGL compositor Initialized Succesfully.
[...]
Frame script: embedhelper.js loaded
CONSOLE message:
[JavaScript Warning: "This page uses the non standard property “zoom”. Consider
using calc() in the relevant property values, or using “transform” along
with “transform-origin: 0 0”." {file: "https://sailfishos.org/" line: 0}]
CONSOLE message:
[JavaScript Warning: "Layout was forced before the page was fully loaded. If
stylesheets are not yet loaded this may cause a flash of unstyled content."
{file: "https://sailfishos.org/wp-includes/js/jquery/
jquery.min.js?ver=3.5.1" line: 2}]
The good news is the WebView test app is no longer crashing. It stays running and even responds to touch input. But it's not rendering. The screen is just showing a completely white page. This is definitely good progress though. It means that tomorrow I can dive back in to the debugger to compare execution with ESR 78, see where they're diverging and hopefully gradually get them to align closer until the rendering works.I'm afraid to say, there's still a long journey ahead of us. But we are still, slowly but surely, moving forwards.
If you'd like to read any of my other gecko diary entries, they're all available on my Gecko-dev Diary page.
9 Mar 2024 : Day 180 #
I'm picking up where I left off, reintroducing code around the SharedSurface_Basic class. I've added back in the missing methods and code that ESR 78 includes as part of SharedSurface_Basic:
The good news is that with SharedSurface_Basic::Create() being a static function, it'll need to be fully qualified (in other words, prefixed with the class name) which makes it a lot easier to search the code for. On ESR 78 we have these cases:
I've now changed the ESR 91 code so that it uses the same Create() override as the single version available in ESR 78. I'm really hoping to match up this particular set of functionality as closely as possible.
Finally I need to do a similar check for the SharedSurface_Basic::Wrap() method. This is also static, which again helps with discovery.
Since I've only just now added the Wrap() method back in to ESR 91 there's no point doing a search there. All we'll find is the new code I just added. But let's do it anyway for completeness.
If you'd like to read any of my other gecko diary entries, they're all available on my Gecko-dev Diary page.
Comment
- Create(). There's already an existing Create() method, but this new implementation provides a new signature.
- Wrap(). This was missing from the ESR 91 version. It feels like we'll need it
- Cast(). Similarly this might turn out to be needed.
- SharedSurface_Basic(). Again, there was already a constructor but this one provides some new features.
- ~SharedSurface_Basic(). In ESR 91 the destructor had been removed.
- LockProdImpl(). This is an override; it's not clear that it's needed.
- UnlockProdImpl(). Similarly here.
- ProducerAcquireImpl(). And here.
- ProducerReleaseImpl(). And also here.
- ProdTexture(). However this override we need; the fact this was missing from ESR 91 is the reason we saw a segfault.
- const GLuint mTex.
- const bool mOwnsTex.
- GLuint mFB.
The good news is that with SharedSurface_Basic::Create() being a static function, it'll need to be fully qualified (in other words, prefixed with the class name) which makes it a lot easier to search the code for. On ESR 78 we have these cases:
$ grep -rIn "SharedSurface_Basic::Create(" *
gecko-dev/gfx/gl/SharedSurfaceGL.h:82:
return SharedSurface_Basic::Create(mGL, mFormats, size, hasAlpha);
gecko-dev/gfx/gl/SharedSurfaceGL.cpp:22:
UniquePtr<SharedSurface_Basic> SharedSurface_Basic::Create(
gecko-dev/gfx/gl/SharedSurface.cpp:41:
tempSurf = SharedSurface_Basic::Create(gl, factory->mFormats, src->mSize,
Comparing that to the instances in ESR 91, we can see they're surprisingly similar:
$ grep -rIn "SharedSurface_Basic::Create(" *
gecko-dev/gfx/gl/SharedSurfaceGL.h:72:
return SharedSurface_Basic::Create(desc);
gecko-dev/gfx/gl/SharedSurfaceGL.cpp:21:
UniquePtr<SharedSurface_Basic> SharedSurface_Basic::Create(
gecko-dev/gfx/gl/SharedSurfaceGL.cpp:57:
UniquePtr<SharedSurface_Basic> SharedSurface_Basic::Create(
gecko-dev/gfx/gl/SharedSurface.cpp:66:
tempSurf = SharedSurface_Basic::Create({{gl, SharedSurfaceType::Basic,
On ESR 91 there are two different versions of SharedSurface_Basic::Create() because we just added a new one. But there are also differences in the way the method is called and I'd like to fix that so that the ESR 91 code better aligns with the ESR 78 code.I've now changed the ESR 91 code so that it uses the same Create() override as the single version available in ESR 78. I'm really hoping to match up this particular set of functionality as closely as possible.
Finally I need to do a similar check for the SharedSurface_Basic::Wrap() method. This is also static, which again helps with discovery.
$ grep -rIn "SharedSurface_Basic::Wrap(" *
gecko-dev/gfx/gl/SharedSurfaceGL.cpp:44:
UniquePtr<SharedSurface_Basic> SharedSurface_Basic::Wrap(GLContext* gl,
$ grep -rIn "Wrap(" gecko-dev/gfx/gl/SharedSurfaceGL.h
38:
static UniquePtr<SharedSurface_Basic> Wrap(GLContext* gl,
$ grep -rIn "Wrap(" gecko-dev/gfx/gl/SharedSurfaceGL.cpp
44:
UniquePtr<SharedSurface_Basic> SharedSurface_Basic::Wrap(GLContext* gl,
The Wrap() method isn't an override, so this should be enough to demonstrate that the method isn't actually being used at all in ESR 78. So there should be no need to worry too much about it in ESR 91. And in fact once things are working it should almost certainly be removed. But I want to get a working executable before worrying about that.Since I've only just now added the Wrap() method back in to ESR 91 there's no point doing a search there. All we'll find is the new code I just added. But let's do it anyway for completeness.
$ grep -rIn "SharedSurface_Basic::Wrap(" *
gecko-dev/gfx/gl/SharedSurfaceGL.cpp:79:
UniquePtr<SharedSurface_Basic> SharedSurface_Basic::Wrap(GLContext* gl,
$ grep -rIn "Wrap(" gecko-dev/gfx/gl/SharedSurfaceGL.h
26:
static UniquePtr<SharedSurface_Basic> Wrap(GLContext* gl,
$ grep -rIn "Wrap(" gecko-dev/gfx/gl/SharedSurfaceGL.cpp
79:
UniquePtr<SharedSurface_Basic> SharedSurface_Basic::Wrap(GLContext* gl,
Having made these changes the partial builds have now all gone through, so it's time to set off the full build so I can test the executable again tomorrow.If you'd like to read any of my other gecko diary entries, they're all available on my Gecko-dev Diary page.
8 Mar 2024 : Day 179 #
The build started yesterday has now completed; let's not waste any time and get straight to testing it out.
One thing that we are able to work with is the differences between the ESR 78 code (working) and the ESR 91 code (broken). And they are different. In ESR 78 the SharedSurfaceTextureData constructor at the top of the stack looks like this:
I could fire up my second development phone and place a breakpoint on the SharedSurfaceTextureClient constructor to compare, but I'm on the train and one laptop and two phones is already leaving me cramped. A laptop and three phones would crowd me out entirely. So let's find out why surf is null by looking through the ESR 91 code instead.
The odd thing is that the parent method has plenty of checks for it not being null:
So accessing this value that's been optimised out is actually more difficult than I'd thought. I can't just go up (down) a stack frame and check it there after all.
The solution will be to place a breakpoint on SharedSurfaceTextureClient::Create() and inspect the value before it's moved. Let's try that out.
And now suddenly it's hit me. There's something very wrong with this ordering:
I'm going to attempt to run the library generated from the partial build. Unfortunately the partial builds mess up the symbol references so it's not always possible to debug with them. I've also stripping them of debug symbols to make uploading them quicker, so even if they don't get messed up, I still can't use them. But running it may nevertheless help to find out whether this fix has made any difference at all.
[...]
I'm home now. After digging around in the code a bit and comparing with the execution of ESR 78, the reason for the crash has become clear. At the top of the backtrace is SharedSurface::ProdTexture(). But this method is designed to crash; it looks like this:
For the same reason, when I place a breakpoint on SharedSurface::ProdTexture() in the ESR 78 version of the code it doesn't get hit. On the other hand, when I place a breakpoint on ReadBuffer::Create() which is further down the stack trace that does get hit. After which if we place a breakpoint on all instances of ProdTexture() we do get a hit, but it's from SharedSurface_Basic::ProdTexture() rather than from SharedSurface:
If you'd like to read any of my other gecko diary entries, they're all available on my Gecko-dev Diary page.
Comment
$ gdb harbour-webview
GNU gdb (GDB) Mer (8.2.1+git9)
[...]
(gdb) r
Starting program: /usr/bin/harbour-webview
[...]
Created LOG for EmbedLiteLayerManager
[New LWP 4065]
Thread 36 "Compositor" received signal SIGSEGV, Segmentation fault.
[Switching to LWP 4059]
0x0000007ff125d16c in mozilla::layers::SharedSurfaceTextureData::
SharedSurfaceTextureData (this=0x7ed81af3c0, surf=...)
at obj-build-mer-qt-xr/dist/include/mozilla/UniquePtr.h:283
283 obj-build-mer-qt-xr/dist/include/mozilla/UniquePtr.h:
No such file or directory.
(gdb) bt
#0 0x0000007ff125d16c in mozilla::layers::SharedSurfaceTextureData::
SharedSurfaceTextureData (this=0x7ed81af3c0, surf=...)
at obj-build-mer-qt-xr/dist/include/mozilla/UniquePtr.h:283
#1 0x0000007ff125d210 in mozilla::layers::SharedSurfaceTextureClient::
Create (surf=..., factory=factory@entry=0x7ed80043d0, aAllocator=0x0,
aFlags=<optimized out>) at obj-build-mer-qt-xr/dist/include/mozilla/
cxxalloc.h:33
#2 0x0000007ff111e038 in mozilla::gl::SurfaceFactory::NewTexClient
(this=0x7ed80043d0, size=...)
at obj-build-mer-qt-xr/dist/include/mozilla/RefPtr.h:289
#3 0x0000007ff1107088 in mozilla::gl::GLScreenBuffer::Resize
(this=0x5555643e90, size=...)
at obj-build-mer-qt-xr/dist/include/mozilla/UniquePtr.h:290
#4 0x0000007ff1131c04 in mozilla::gl::GLContext::CreateScreenBufferImpl
(this=this@entry=0x7ed819ee40, size=..., caps=...)
at gfx/gl/GLContext.cpp:2150
#5 0x0000007ff1131cc8 in mozilla::gl::GLContext::CreateScreenBuffer
(caps=..., size=..., this=0x7ed819ee40)
at gfx/gl/GLContext.h:3555
#6 mozilla::gl::GLContext::InitOffscreen
(this=this@entry=0x7ed819ee40, size=..., caps=...)
at gfx/gl/GLContext.cpp:2398
[...]
#29 0x0000007ff6a0489c in ?? () from /lib64/libc.so.6
(gdb)
This is progress: the application got a bit further today. But just from reading through the backtrace I'm not entirely certain what's going on here. The issues — and their locations — are being obscured by the various pointer wrappers (UniquePtr and RefPtr) in use. I'm finding it hard to get a purchase. The first actually useful location is line 2150 of GLContext.cpp but that's way down in frame 4.One thing that we are able to work with is the differences between the ESR 78 code (working) and the ESR 91 code (broken). And they are different. In ESR 78 the SharedSurfaceTextureData constructor at the top of the stack looks like this:
SharedSurfaceTextureData::SharedSurfaceTextureData(
UniquePtr<gl::SharedSurface> surf)
: mSurf(std::move(surf)) {}
Whereas in ESR 91 I appear to have added some additional initialisation steps:
SharedSurfaceTextureData::SharedSurfaceTextureData(
UniquePtr<gl::SharedSurface> surf)
: mSurf(std::move(surf)),
mDesc(),
mFormat(),
mSize(surf->mDesc.size)
{
}
One possibility is that the value of surf is null. This wouldn't necessarily cause a problem until we try to read the mDesc entry while setting mSize. I'm not able to extract the value of surf directly as the debugger informs me it's been "optimized out". But if I go up (down?) a stack frame I can seer what was passed in for its value.
(gdb) p surf
$3 = <optimized out>
(gdb) frame 1
#1 0x0000007ff125d210 in mozilla::layers::SharedSurfaceTextureClient::Create
(surf=..., factory=factory@entry=0x7ed80043d0, aAllocator=0x0,
aFlags=<optimized out>) at obj-build-mer-qt-xr/dist/include/mozilla/
cxxalloc.h:33
33 obj-build-mer-qt-xr/dist/include/mozilla/cxxalloc.h:
No such file or directory.
(gdb) p surf
$4 = {
mTuple = {<mozilla::detail::CompactPairHelper<mozilla::gl::SharedSurface*,
mozilla::DefaultDelete<mozilla::gl::SharedSurface>,
(mozilla::detail::StorageType)1, (mozilla::detail::StorageType)0>> =
{<mozilla::DefaultDelete<mozilla::gl::SharedSurface>> = {<No data fields>},
mFirstA = 0x0}, <No data fields>}}
(gdb) p surf.mTuple.mFirstA
$5 = (mozilla::gl::SharedSurface *) 0x0
(gdb)
So the fact that surf is null provides us with an immediate reason for the crash, but it leaves us with a question: should the value be null and we shouldn't be attempting to access its contents, or should it be a non-null value going in to this method?I could fire up my second development phone and place a breakpoint on the SharedSurfaceTextureClient constructor to compare, but I'm on the train and one laptop and two phones is already leaving me cramped. A laptop and three phones would crowd me out entirely. So let's find out why surf is null by looking through the ESR 91 code instead.
The odd thing is that the parent method has plenty of checks for it not being null:
already_AddRefed<SharedSurfaceTextureClient> SharedSurfaceTextureClient::Create(
UniquePtr<gl::SharedSurface> surf, gl::SurfaceFactory* factory,
LayersIPCChannel* aAllocator, TextureFlags aFlags) {
if (!surf) {
return nullptr;
}
TextureFlags flags = aFlags | TextureFlags::RECYCLE | surf->GetTextureFlags();
SharedSurfaceTextureData* data =
new SharedSurfaceTextureData(std::move(surf));
return MakeAndAddRef<SharedSurfaceTextureClient>(data, flags, aAllocator);
}
So the value going in isn't null. And now that I look at it carefully, I see that I have this all wrong: the surf variable isn't an instance of SharedSurface, it's a UniquePtr wrapping an instance of SharedSurface. When the value inside the unique pointer is moved, the value inside the unique pointer that it's coming from gets set to zero. That's the whole point of unique pointers.So accessing this value that's been optimised out is actually more difficult than I'd thought. I can't just go up (down) a stack frame and check it there after all.
The solution will be to place a breakpoint on SharedSurfaceTextureClient::Create() and inspect the value before it's moved. Let's try that out.
(gdb) b SharedSurfaceTextureClient::Create
Breakpoint 1 at 0x7ff125d1a4: file gfx/layers/client/
TextureClientSharedSurface.cpp, line 113.
(gdb) r
The program being debugged has been started already.
Start it from the beginning? (y or n) y
Starting program: /usr/bin/harbour-webview
[...]
Thread 36 "Compositor" hit Breakpoint 1, mozilla::layers::
SharedSurfaceTextureClient::Create (surf=...,
factory=factory@entry=0x7ee0004310, aAllocator=
0x0, aFlags=mozilla::layers::TextureFlags::ORIGIN_BOTTOM_LEFT)
at gfx/layers/client/TextureClientSharedSurface.cpp:113
113 LayersIPCChannel* aAllocator, TextureFlags aFlags) {
(gdb) p surf
$6 = {
mTuple = {<mozilla::detail::CompactPairHelper<mozilla::gl::SharedSurface*,
mozilla::DefaultDelete<mozilla::gl::SharedSurface>,
(mozilla::detail::StorageType)1, (mozilla::detail::StorageType)0>> =
{<mozilla::DefaultDelete<mozilla::gl::SharedSurface>> = {<No data fields>},
mFirstA = 0x7ee01a1c00}, <No data fields>}}
(gdb) p surf.mTuple.mFirstA
$7 = (mozilla::gl::SharedSurface *) 0x7ee01a1c00
(gdb) p surf.mTuple.mFirstA->mDesc.size
$9 = {<mozilla::gfx::BaseSize<int, mozilla::gfx::IntSizeTyped<mozilla::gfx::
UnknownUnits> >> = {{{width = 1080, height = 2520}, components = {1080,
2520}}}, <mozilla::gfx::UnknownUnits> = {<No data fields>},
<No data fields>}
(gdb) p surf.mTuple.mFirstA->mDesc.size.width
$10 = 1080
(gdb) p surf.mTuple.mFirstA->mDesc.size.height
$11 = 2520
(gdb)
This is all now looking a lot more healthy than I thought. Since it's not that the value is null going in, what else could be causing the crash here? It could be that there are multiple calls to this Create() method and this isn't the one causing the problem. But that's easy to check as well:
(gdb) n
114 if (!surf) {
(gdb)
49 obj-build-mer-qt-xr/dist/include/mozilla/TypedEnumBits.h:
No such file or directory.
(gdb)
117 TextureFlags flags = aFlags | TextureFlags::RECYCLE | surf->GetTextureFlags();
(gdb)
119 new SharedSurfaceTextureData(std::move(surf));
(gdb)
Thread 36 "Compositor" received signal SIGSEGV, Segmentation fault.
0x0000007ff125d16c in mozilla::layers::SharedSurfaceTextureData::
SharedSurfaceTextureData (this=0x7ee01af300, surf=...)
at obj-build-mer-qt-xr/dist/include/mozilla/UniquePtr.h:283
283 obj-build-mer-qt-xr/dist/include/mozilla/UniquePtr.h:
No such file or directory.
(gdb)
Stepping forwards to the next call to the SharedSurfaceTextureData constructor triggers the crash. So we're definitely in the right place and the problem isn't a null value for the surf parameter after all.And now suddenly it's hit me. There's something very wrong with this ordering:
: mSurf(std::move(surf)),
mDesc(),
mFormat(),
mSize(surf->mDesc.size)
The sequence here is going to be:
- Move surf into mSurf. This will leave the value stored inside surf as null.
- Create mDesc and mFormat in their default state.
- Attempt to access a value from inside surf. But surf has been moved out of the unique pointer wrapper and into another one, so we can't do this.
SharedSurfaceTextureData::SharedSurfaceTextureData(
UniquePtr<gl::SharedSurface> surf)
: mSurf(std::move(surf)),
mDesc(),
mFormat(),
mSize(mSurf->mDesc.size)
{
}
There may be other reasons why this constructor causes problems later, such as having the default values for mDesc and mFormat. I'm not sure how important these are. But this fix should get us closer to finding out.I'm going to attempt to run the library generated from the partial build. Unfortunately the partial builds mess up the symbol references so it's not always possible to debug with them. I've also stripping them of debug symbols to make uploading them quicker, so even if they don't get messed up, I still can't use them. But running it may nevertheless help to find out whether this fix has made any difference at all.
$ make -j1 -C obj-build-mer-qt-xr/gfx/layer
$ make -j16 -C `pwd`/obj-build-mer-qt-xr/toolkit
$ strip obj-build-mer-qt-xr/toolkit/library/build/libxul.so
[...]
$ scp obj-build-mer-qt-xr/toolkit/library/build/libxul.so \
defaultuser@172.28.172.2:~/Documents/Development/gecko/
$ ssh defaultuser@172.28.172.2
[...]
$ devel-su cp libxul.so /usr/lib64//xulrunner-qt5-91.9.1/
$ gdb harbour-webview
GNU gdb (GDB) Mer (8.2.1+git9)
[...]
(gdb) r
Starting program: /usr/bin/harbour-webview
[...]
Thread 36 "Compositor" received signal SIGSEGV, Segmentation fault.
[Switching to LWP 29907]
0x0000007ff1107e00 in ?? () from /usr/lib64/xulrunner-qt5-91.9.1/libxul.so
(gdb) bt
#0 0x0000007ff1107e00 in ?? () from /usr/lib64/xulrunner-qt5-91.9.1/libxul.so
#1 0x0000007ff1106948 in ?? () from /usr/lib64/xulrunner-qt5-91.9.1/libxul.so
#2 0x0000007ff1106c30 in ?? () from /usr/lib64/xulrunner-qt5-91.9.1/libxul.so
#3 0x0000007ff1106e5c in ?? () from /usr/lib64/xulrunner-qt5-91.9.1/libxul.so
#4 0x0000007ff1107104 in ?? () from /usr/lib64/xulrunner-qt5-91.9.1/libxul.so
#5 0x0000007ff1131c64 in ?? () from /usr/lib64/xulrunner-qt5-91.9.1/libxul.so
#6 0x0000007ff1131d28 in ?? () from /usr/lib64/xulrunner-qt5-91.9.1/libxul.so
#7 0x0000007ff1131e74 in ?? () from /usr/lib64/xulrunner-qt5-91.9.1/libxul.so
#8 0x0000007ff11999f8 in ?? () from /usr/lib64/xulrunner-qt5-91.9.1/libxul.so
#9 0x0000007ff11aefe8 in ?? () from /usr/lib64/xulrunner-qt5-91.9.1/libxul.so
#10 0x0000007ff12c4c98 in ?? () from /usr/lib64/xulrunner-qt5-91.9.1/libxul.so
#11 0x0000007ff12cfd14 in ?? () from /usr/lib64/xulrunner-qt5-91.9.1/libxul.so
[...]
#25 0x0000007ff07fe8d8 in ?? () from /usr/lib64/xulrunner-qt5-91.9.1/libxul.so
#26 0x0000007feca3c9f0 in ?? () from /usr/lib64/libnspr4.so
#27 0x0000007fefd00a4c in ?? () from /lib64/libpthread.so.0
#28 0x0000007ff6a0489c in ?? () from /lib64/libc.so.6
(gdb)
Clearly that's not as helpful as we might have hoped. Maybe it's worth a try without stripping out the debug symbols.
$ make -j16 -C `pwd`/obj-build-mer-qt-xr/toolkit
[...]
$ scp obj-build-mer-qt-xr/toolkit/library/build/libxul.so \
defaultuser@172.28.172.2:~/Documents/Development/gecko/
The problem with using the non-stripped version is that it's a large 2.7GiB file (that's three times larger than the RPM packages, even including the debuginfo). The consequence is that it's actually taking my entire train journey to copy the file over to my phone (via my other phone using a Wifi hotspot). It's finally got there... but with only a few minutes to spare before we pull in to Cambridge station. I'm going to have to be quick!
$ ssh defaultuser@172.28.172.2
[...]
$ devel-su cp libxul.so /usr/lib64//xulrunner-qt5-91.9.1/
$ gdb harbour-webview
GNU gdb (GDB) Mer (8.2.1+git9)
[...]
(gdb) r
Starting program: /usr/bin/harbour-webview
[...]
Thread 36 "Compositor" received signal SIGSEGV, Segmentation fault.
[Switching to LWP 2262]
0x0000007ff1107e00 in mozilla::gl::SharedSurface::ProdTexture
(this=<optimized out>)
at gecko-dev/gfx/gl/SharedSurface.h:154
154 gecko-dev/gfx/gl/SharedSurface.h: No such file or directory.
(gdb) bt
#0 0x0000007ff1107e00 in mozilla::gl::SharedSurface::ProdTexture
(this=<optimized out>)
at gecko-dev/gfx/gl/SharedSurface.h:154
#1 0x0000007ff1106948 in mozilla::gl::ReadBuffer::Create (gl=0x7ed819ee40,
caps=..., formats=..., surf=surf@entry=0x7ed81a1cc0)
at gecko-dev/gfx/gl/GLScreenBuffer.cpp:653
#2 0x0000007ff1106c30 in mozilla::gl::GLScreenBuffer::CreateRead
(this=this@entry=0x55556434d0, surf=surf@entry=0x7ed81a1cc0)
at gecko-dev/gfx/gl/GLScreenBuffer.cpp:584
#3 0x0000007ff1106e5c in mozilla::gl::GLScreenBuffer::Attach
(this=this@entry=0x55556434d0, surf=0x7ed81a1cc0, size=...)
at gecko-dev/gfx/gl/GLScreenBuffer.cpp:488
#4 0x0000007ff1107104 in mozilla::gl::GLScreenBuffer::Resize
(this=0x55556434d0, size=...)
at obj-build-mer-qt-xr/dist/include/mozilla/UniquePtr.h:290
#5 0x0000007ff1131c64 in mozilla::gl::GLContext::CreateScreenBufferImpl
(this=this@entry=0x7ed819ee40, size=..., caps=...)
at gecko-dev/gfx/gl/GLContext.cpp:2150
#6 0x0000007ff1131d28 in mozilla::gl::GLContext::CreateScreenBuffer
(caps=..., size=..., this=0x7ed819ee40)
at gecko-dev/gfx/gl/GLContext.h:3555
#7 mozilla::gl::GLContext::InitOffscreen (this=this@entry=0x7ed819ee40,
size=..., caps=...)
at gecko-dev/gfx/gl/GLContext.cpp:2398
#8 0x0000007ff1131e74 in mozilla::gl::GLContextProviderEGL::CreateOffscreen
(size=..., minCaps=..., flags=flags@entry=mozilla::gl::CreateContextFlags::
REQUIRE_COMPAT_PROFILE, out_failureId=out_failureId@entry=0x7f1778a1c8)
at gecko-dev/gfx/gl/GLContextProviderEGL.cpp:1308
[...]
#30 0x0000007ff6a0489c in ?? () from /lib64/libc.so.6
(gdb)
This is a more interesting backtrace! And it's certainly different from the one we had yesterday. But now we really are pulling in to the station so it's time to close up my laptop and prepare for the next stage of my journey home. When I get back, I'll dig in to this crash further.[...]
I'm home now. After digging around in the code a bit and comparing with the execution of ESR 78, the reason for the crash has become clear. At the top of the backtrace is SharedSurface::ProdTexture(). But this method is designed to crash; it looks like this:
virtual GLuint ProdTexture() {
MOZ_ASSERT(mAttachType == AttachmentType::GLTexture);
MOZ_CRASH("GFX: Did you forget to override this function?");
}
As you can see from the text passed to the crash macro, this function is never supposed to be called. It's supposed to be overridden by something else in a class that inherits from SharedSurface.For the same reason, when I place a breakpoint on SharedSurface::ProdTexture() in the ESR 78 version of the code it doesn't get hit. On the other hand, when I place a breakpoint on ReadBuffer::Create() which is further down the stack trace that does get hit. After which if we place a breakpoint on all instances of ProdTexture() we do get a hit, but it's from SharedSurface_Basic::ProdTexture() rather than from SharedSurface:
(gdb) b ReadBuffer::Create
Breakpoint 2 at 0x7fb8e66720: file gfx/gl/GLScreenBuffer.cpp, line 501.
(gdb) r
[...]
Thread 36 "Compositor" hit Breakpoint 2, mozilla::gl::ReadBuffer::Create
(gl=0x7eac109130, caps=..., formats=..., surf=surf@entry=0x7eac10a6e0)
at gfx/gl/GLScreenBuffer.cpp:501
501 SharedSurface* surf) {
(gdb) p surf
$1 = (mozilla::gl::SharedSurface *) 0x7eac10a6e0
(gdb) p surf->mAttachType
$2 = mozilla::gl::AttachmentType::GLTexture
(gdb) b ProdTexture
Breakpoint 3 at 0x7fb83835d0: ProdTexture. (5 locations)
(gdb) c
Continuing.
Thread 36 "Compositor" hit Breakpoint 3, mozilla::gl::SharedSurface_Basic::
ProdTexture (this=0x7eac10a6e0)
at gfx/gl/SharedSurfaceGL.h:65
65 virtual GLuint ProdTexture() override { return mTex; }
(gdb)
The SharedSurface_Basic class is defined in the SharedSurfaceGL.h file and in ESR 78 it does override the ProdTexture() method:
// For readback and bootstrapping:
class SharedSurface_Basic : public SharedSurface {
[...]
virtual GLuint ProdTexture() override { return mTex; }
[...]
};
However in the ESR 91 code there's no such override. I should have added one in, but the need hadn't made it on to my radar. So I'll make this change now. Unfortunately there are a collection of cascading changes that make this a slightly larger job than I'd hoped. Nothing crazy, but too much to do tonight, so I'll have to leave it until the morning.If you'd like to read any of my other gecko diary entries, they're all available on my Gecko-dev Diary page.
7 Mar 2024 : Day 178 #
Good morning! Well, it is for me at least. By the time this gets posted it'll be the evening. But for me right now it's early and when I check in on my laptop I can see that the build has completed.
We'll take a look at the build presently, but before we do, thank you to Adam Pigg (piggz) for commenting on my meander into virtual methods yesterday. As Adam rightly pointed out, my C++ code was missing some accoutrements that he'd have preferred to see included.
Adam is right of course, not only are these sensible ways to improve the code, but the use of override would also have improved clarity. Adam has kindly provide his own, improved, version of the code which I'll share below. He then went on to make a few, perhaps more controversial, suggestions"
I'll leave it to the reader to judge whether these would actually be improvements or not. Here's Adam's updated version of the code. One thing to note is that support for C++23's std::print requires at least GCC 14 or Clang 18 if you want to compile this at home, but Adam has confirmed it all works as expected using the online Godbolt Compiler Explorer.
The latest Gecko build incorporates all of the GLScreenBuffer code that I've been adding in and following changes made yesterday should also now no longer make use of the SwapChain class. I've copied the packages over to my development phone, installed them and now it's time to test them.
Looking through the ESR 78 code there's only one place I can discern that sets the mScreen variable and that's this one:
Let's continue digging backwards and find out where InitOffscreen() gets called. It turns out it's called in quite a few places:
We're building up a pretty clear path for how mScreen ends up initialised in ESR 78. The CreateContext() method is the first time we've reached something on this path which also exists in ESR 91. So this would seem to be a good place to switch back to ESR 91 and try to reconstruct the path in the opposite direction.
Just to make sure we're not being led in the wrong direction, it's also worth checking that CreateContext() is actually being called in ESR 91 and that this is happening before the segmentation fault causes the application to crash.
So the next step is to add the CreateOffscreen() code to GLContextProviderEGL. There's code in ESR 78 to copy over, so that part's straightforward. However various interfaces it makes use of have been changed or are missing. I've had to make some quite heavy, but nevertheless justifiable, changes to the code. For example the GLLibraryEGL::EnsureInitialized() method has been replaced by GLLibraryEGL::Init(). That's more than just a name change: the former can be safely called multiple times, whereas the latter can only be called once (or so it appears). Consequently I've removed the call entirely, on the assumption that the Init() method is being called somewhere else. We'll find out whether that's true or not when we come to execute the program.
Nevertheless the partial builds now compile, so it's time to run the full build again, which will take more hours than there are left in the day. So we'll return to this again tomorrow.
If you'd like to read any of my other gecko diary entries, they're all available on my Gecko-dev Diary page.
Comment
We'll take a look at the build presently, but before we do, thank you to Adam Pigg (piggz) for commenting on my meander into virtual methods yesterday. As Adam rightly pointed out, my C++ code was missing some accoutrements that he'd have preferred to see included.
Sorry, but i have to deduct points for using raw pointers and not smart pointers, and missing the override keyword ;)
Adam is right of course, not only are these sensible ways to improve the code, but the use of override would also have improved clarity. Adam has kindly provide his own, improved, version of the code which I'll share below. He then went on to make a few, perhaps more controversial, suggestions"
I'd also drop using namespace, and maybe mix in some C++23, and swap cout for std::print 🙃
I'll leave it to the reader to judge whether these would actually be improvements or not. Here's Adam's updated version of the code. One thing to note is that support for C++23's std::print requires at least GCC 14 or Clang 18 if you want to compile this at home, but Adam has confirmed it all works as expected using the online Godbolt Compiler Explorer.
#includeThanks for that Adam! I'm always up for a bit of blog-based code review. Okay, now back to the Gecko changes from yesterday.#include #include class Parent { public: virtual ~Parent() {}; std::string hello() { return std::string("Hello son"); } std::string wave() { return std::string("Waves"); } virtual std::string goodbye() { return std::string("Goodbye son"); } }; class Child : public Parent { public: std::string hello() { return std::string("Hello Mum"); } std::string goodbye() override { return std::string("Goodbye Mum"); } }; int main() { std::unique_ptr parent(new Parent); std::shared_ptr child = std::make_shared (); std::shared_ptr vparent = std::dynamic_pointer_cast (child); std::println("1. {} ", parent->hello()); std::println("2. {} ", child->hello()); std::println("3. {} ", vparent->hello()); std::println("4. {} ", parent->wave()); std::println("5. {} ", child->wave()); std::println("6. {} ", vparent->wave()); std::println("7. {} ", parent->goodbye()); std::println("8. {} ", child->goodbye()); std::println("9. {} ", vparent->goodbye()); std::println("10. {} ", reinterpret_cast (parent.get())); std::println("11. {} ", reinterpret_cast (child.get())); std::println("12. {} ", reinterpret_cast (vparent.get())); return 0; }
The latest Gecko build incorporates all of the GLScreenBuffer code that I've been adding in and following changes made yesterday should also now no longer make use of the SwapChain class. I've copied the packages over to my development phone, installed them and now it's time to test them.
$ gdb harbour-webview
GNU gdb (GDB) Mer (8.2.1+git9)
[...]
(gdb) r
[...]
=============== Preparing offscreen rendering context ===============
[New LWP 20044]
Thread 37 "Compositor" received signal SIGSEGV, Segmentation fault.
[Switching to LWP 20040]
0x0000007ff110a0a8 in mozilla::gl::GLScreenBuffer::Size (this=0x0)
at ${PROJECT}/obj-build-mer-qt-xr/dist/include/mozilla/UniquePtr.h:290
290 ${PROJECT}/obj-build-mer-qt-xr/dist/include/mozilla/UniquePtr.h:
No such file or directory.
(gdb) bt
#0 0x0000007ff110a0a8 in mozilla::gl::GLScreenBuffer::Size (this=0x0)
at ${PROJECT}/obj-build-mer-qt-xr/dist/include/mozilla/UniquePtr.h:290
#1 mozilla::gl::GLContext::OffscreenSize (this=this@entry=0x7ed419ee40)
at gfx/gl/GLContext.cpp:2141
#2 0x0000007ff3666804 in mozilla::embedlite::EmbedLiteCompositorBridgeParent::
CompositeToDefaultTarget (this=0x7fc4ba91a0, aId=...)
at mobile/sailfishos/embedthread/EmbedLiteCompositorBridgeParent.cpp:156
#3 0x0000007ff12b6f50 in mozilla::layers::CompositorVsyncScheduler::
ForceComposeToTarget (this=0x7fc4cabe80, aTarget=aTarget@entry=0x0,
aRect=aRect@entry=0x0)
at ${PROJECT}/obj-build-mer-qt-xr/dist/include/mozilla/layers/LayersTypes.h:82
#4 0x0000007ff12b6fac in mozilla::layers::CompositorBridgeParent::
ResumeComposition (this=this@entry=0x7fc4ba91a0)
at ${PROJECT}/obj-build-mer-qt-xr/dist/include/mozilla/RefPtr.h:313
#5 0x0000007ff12b7038 in mozilla::layers::CompositorBridgeParent::
ResumeCompositionAndResize (this=0x7fc4ba91a0, x=<optimized out>,
y=<optimized out>, width=<optimized out>, height=<optimized out>)
at gfx/layers/ipc/CompositorBridgeParent.cpp:794
#6 0x0000007ff12afbd4 in mozilla::detail::RunnableMethodArguments<int, int,
int, int>::applyImpl<mozilla::layers::CompositorBridgeParent, void
(mozilla::layers::CompositorBridgeParent::*)(int, int, int, int),
StoreCopyPassByConstLRef<int>, StoreCopyPassByConstLRef<int>,
StoreCopyPassByConstLRef<int>, StoreCopyPassByConstLRef<int>, 0ul, 1ul, 2ul,
3ul> (args=..., m=<optimized out>, o=<optimized out>)
at ${PROJECT}/obj-build-mer-qt-xr/dist/include/nsThreadUtils.h:1151
[...]
#18 0x0000007ff6a0489c in ?? () from /lib64/libc.so.6
(gdb) frame 1
#1 mozilla::gl::GLContext::OffscreenSize (this=this@entry=0x7ed419ee40)
at gfx/gl/GLContext.cpp:2141
2141 return mScreen->Size();
(gdb) p mScreen
$1 = {
mTuple = {<mozilla::detail::CompactPairHelper<mozilla::gl::GLScreenBuffer*,
mozilla::DefaultDelete<mozilla::gl::GLScreenBuffer>,
(mozilla::detail::StorageType)1, (mozilla::detail::StorageType)0>> =
{<mozilla::DefaultDelete<mozilla::gl::GLScreenBuffer>> = {<No data fields>},
mFirstA = 0x0}, <No data fields>}}
(gdb) p mScreen.mTuple.mFirstA
$2 = (mozilla::gl::GLScreenBuffer *) 0x0
(gdb)
So that's an immediate crash, the reason being that the code is calling the OffScreenSize() method of the mScreen member variable of type GLScreenBuffer, but mScreen is null. That is, it's not been initialised yet.Looking through the ESR 78 code there's only one place I can discern that sets the mScreen variable and that's this one:
bool GLContext::CreateScreenBufferImpl(const IntSize& size,
const SurfaceCaps& caps) {
UniquePtr<GLScreenBuffer> newScreen =
GLScreenBuffer::Create(this, size, caps);
[...]
mScreen = std::move(newScreen);
return true;
}
The only place this is called is here:
bool CreateScreenBuffer(const gfx::IntSize& size, const SurfaceCaps& caps) {
if (!IsOffscreenSizeAllowed(size)) return false;
return CreateScreenBufferImpl(size, caps);
}
But this is just some indirection. Clearly the method we're really interested in is CreateScreenBuffer(). This is also only called in one place:
bool GLContext::InitOffscreen(const gfx::IntSize& size,
const SurfaceCaps& caps) {
if (!CreateScreenBuffer(size, caps)) return false;
[...]
mCaps = mScreen->mCaps;
MOZ_ASSERT(!mCaps.any);
return true;
}
It's worth noticing here that soon after calling the CreateScreenBuffer() method and in the same call, the mCaps member of mScreen is being accessed. If mScreen were null at the time of this access, this would immediately trigger a segmentation fault. So clearly, by the end of the InitOffscreen() method, it's expected that mScreen should be a valid instance of GLScreenBuffer.Let's continue digging backwards and find out where InitOffscreen() gets called. It turns out it's called in quite a few places:
$ grep -rIn "InitOffscreen(" * --include="*.cpp"
gecko-dev/gfx/gl/GLContextProviderGLX.cpp:1035:
if (!gl->InitOffscreen(size, minCaps)) {
gecko-dev/gfx/gl/GLContextProviderWGL.cpp:532:
if (!gl->InitOffscreen(size, minCaps)) return nullptr;
gecko-dev/gfx/gl/GLContextProviderEGL.cpp:1443:
if (!gl->InitOffscreen(size, minOffscreenCaps)) {
gecko-dev/gfx/gl/GLContext.cpp:2576:
bool GLContext::InitOffscreen(const gfx::IntSize& size,
The only one of these context providers we care about, given it's the only one used by sailfish-browser, is GLContextProviderEGL. The instance in GLContext.cpp is the method definition so we can ignore that. So there's only one case to concern ourselves with. The call in GLContextProviderEGL occurs in the GLContextProviderEGL::CreateOffscreen() method, which is rather long so I won't list the entire contents here. Suffice it to say that this is the call we need to be finding some equivalent of in ESR 91. This itself is only called from CompositorOGL::CreateContext().We're building up a pretty clear path for how mScreen ends up initialised in ESR 78. The CreateContext() method is the first time we've reached something on this path which also exists in ESR 91. So this would seem to be a good place to switch back to ESR 91 and try to reconstruct the path in the opposite direction.
Just to make sure we're not being led in the wrong direction, it's also worth checking that CreateContext() is actually being called in ESR 91 and that this is happening before the segmentation fault causes the application to crash.
(gdb) b CompositorOGL::CreateContext
Breakpoint 1 at 0x7ff119a348: file gfx/layers/opengl/CompositorOGL.cpp, line 227.
(gdb) r
The program being debugged has been started already.
Start it from the beginning? (y or n) y
Starting program: /usr/bin/harbour-webview
[...]
Thread 38 "Compositor" hit Breakpoint 1, mozilla::layers::CompositorOGL::
CreateContext (this=this@entry=0x7ed8002f10)
at gfx/layers/opengl/CompositorOGL.cpp:227
227 already_AddRefed<mozilla::gl::GLContext> CompositorOGL::CreateContext() {
(gdb)
Yes, it looks to be the case. So now back to building the path. The call to CreateOffscreen() in ESR 78 has been replaced by a call to CreateHeadless() in ESR 91. This is code we've looked at before, but finally we're getting to unravel it a bit. Here's the ESR 78 version:
SurfaceCaps caps = SurfaceCaps::ForRGB();
caps.preserve = false;
caps.bpp16 = gfxVars::OffscreenFormat() == SurfaceFormat::R5G6B5_UINT16;
nsCString discardFailureId;
context = GLContextProvider::CreateOffscreen(
mSurfaceSize, caps, CreateContextFlags::REQUIRE_COMPAT_PROFILE,
&discardFailureId);
And here's the equivalent code, also executed from within CompositorOGL::CreateContext(), from ESR 91.
nsCString discardFailureId;
context = GLContextProvider::CreateHeadless(
{CreateContextFlags::REQUIRE_COMPAT_PROFILE}, &discardFailureId);
if (!context->CreateOffscreenDefaultFb(mSurfaceSize)) {
context = nullptr;
}
This gives us all the pieces we need — both mSurfaceSize and caps are available in ESR 91 — so we just need to reconstruct the call to reflect what's happening in ESR 78.So the next step is to add the CreateOffscreen() code to GLContextProviderEGL. There's code in ESR 78 to copy over, so that part's straightforward. However various interfaces it makes use of have been changed or are missing. I've had to make some quite heavy, but nevertheless justifiable, changes to the code. For example the GLLibraryEGL::EnsureInitialized() method has been replaced by GLLibraryEGL::Init(). That's more than just a name change: the former can be safely called multiple times, whereas the latter can only be called once (or so it appears). Consequently I've removed the call entirely, on the assumption that the Init() method is being called somewhere else. We'll find out whether that's true or not when we come to execute the program.
Nevertheless the partial builds now compile, so it's time to run the full build again, which will take more hours than there are left in the day. So we'll return to this again tomorrow.
If you'd like to read any of my other gecko diary entries, they're all available on my Gecko-dev Diary page.
6 Mar 2024 : Day 177 #
Yesterday I spent the day fixing linker errors. By the evening there was one last error that popped up at the end of the full build that looked like this:
One of the reasons I want to explain is that these vtable errors are a little cryptic. They also related to an interesting implementation detail of C++. They're telling us that there's something wrong with the SharedSurfaceTextureClient implementation, but not telling us exactly what. The line number the error refers to is in the SharedSurfaceTextureClient constructor, which is also not particularly helpful:
However, sometimes you want to change the behaviour — or at least some of it — from the parent class. That might be where you'd override some of that functionality.
Where am I going with this? Bear with me! The point is that there are also two ways that a method can be overridden. It can be statically overridden or dynamically overridden. The former case is useful when the compiler can always tell that the method to be used is the one from the child class. In particular, if you never cast a class to make it look like its parent. If you cast it to the parent, any statically overridden methods will use the parent class's implementation.
However, if you dynamically override a method, the child's implementation will be used even if you cast the class upwards. Let's take some simple example (this doesn't appear in the Gecko codebase!).
Now let's see what happens when we build and run this code.
However, there's also this peculiar vparent variable. This is the instance of Child that's been dynamically cast to look like a Parent. We can see that child and parent are actually the same object because they point to the same place (lines 11 and 12) compared to the parent object which has a different pointer (line 10).
Casing a Child to a Parent is perfectly safe because the former is inheriting from the latter. In other words, the code knows that everything a Parent has a Child will have as well. Safe.
But in the case of the dynamic cast, the calls to any overridden virtual methods are resolved at runtime rather than compile time. In particular, even though vparent is of type Parent, calling the goodbye() method on it calls the child's implementation of goodbye() (line 9).
The way this is achieved is with a vtable (this is where we're going!). This is a list of pointers to methods stored at runtime. Because goodbye() is marked as virtual in the Parent class, a pointer to this method is stored in the vtable. When the compiler calls the method it gets the address to call from the vtable, rather than from some fixed value stored at compile time.
Now when the Child dynamically overrides goodbye() it overwrites the value in the vtable. The result is that when the goodbye() class is called from vparent, the Child instance is referenced even though the class looks otherwise just like a Parent.
Finally we get to our error. The error is suggesting that there's some method that should be virtual, but no vtable has been created. This is most likely because there's a signature for a virtual method, but no implementation for any virtual method.
It's all a bit obscure, made more so because there are no virtual methods in the definition. However we do have ~SharedSurfaceTextureClient() in the class definition that doesn't have an implementation. Plus the class is inheriting from TextureData and this has a virtual destructor. As a result the ~SharedSurfaceTextureClient() destructor will also need to be added to the vtable.
But while ~SharedSurfaceTextureClient() appears in the class definition, there is no implementation of it. This is therefore likely what's causing our error.
The solution, after this very long explanation, is that we need to add in the implementation of the class destructor. Thankfully there's a destructor implementation in the ESR 78 code we can use:
The fix is to switch back from SwapChain to the previous GLScreenBuffer interface, like to:
If you'd like to read any of my other gecko diary entries, they're all available on my Gecko-dev Diary page.
Comment
TextureClientSharedSurface.cpp:108: undefined reference to `vtable for mozilla::layers::SharedSurfaceTextureClient'I promised to spend a bit of time today explaining what was going on and how I fixed it.
One of the reasons I want to explain is that these vtable errors are a little cryptic. They also related to an interesting implementation detail of C++. They're telling us that there's something wrong with the SharedSurfaceTextureClient implementation, but not telling us exactly what. The line number the error refers to is in the SharedSurfaceTextureClient constructor, which is also not particularly helpful:
SharedSurfaceTextureClient::SharedSurfaceTextureClient(
SharedSurfaceTextureData* aData, TextureFlags aFlags,
LayersIPCChannel* aAllocator)
: TextureClient(aData, aFlags, aAllocator) {
}
The vtable the error is referring to is the "virtual table" of methods that can be dynamically overridden. When you subclass a class in C++ you can override certain methods from the parent class. In other words, when the code calls the method in the subclass, you can make sure it uses a method written for the subclass, rather than using the inherited method from the parent class. Both overriding and not overriding are useful. The whole point of creating a subclass is that you re-use some functionality from the parent class, so if you don't override a method it's great that the implementation from the parent class can be used.However, sometimes you want to change the behaviour — or at least some of it — from the parent class. That might be where you'd override some of that functionality.
Where am I going with this? Bear with me! The point is that there are also two ways that a method can be overridden. It can be statically overridden or dynamically overridden. The former case is useful when the compiler can always tell that the method to be used is the one from the child class. In particular, if you never cast a class to make it look like its parent. If you cast it to the parent, any statically overridden methods will use the parent class's implementation.
However, if you dynamically override a method, the child's implementation will be used even if you cast the class upwards. Let's take some simple example (this doesn't appear in the Gecko codebase!).
#include <iostream>
using namespace std;
class Parent {
public:
string hello() { return string("Hello son"); }
string wave() { return string("Waves"); }
virtual string goodbye() { return string("Goodbye son"); }
};
class Child : public Parent {
public:
string hello() { return string("Hello Mum"); }
string goodbye() { return string("Goodbye Mum"); }
};
int main() {
Parent* parent = new Parent();
Child* child = new Child();
Parent* vparent = dynamic_cast<Parent*>(child);
cout << "1. " << parent->hello() << "\n";
cout << "2. " << child->hello() << "\n";
cout << "3. " << vparent->hello() << "\n";
cout << "4. " << parent->wave() << "\n";
cout << "5. " << child->wave() << "\n";
cout << "6. " << vparent->wave() << "\n";
cout << "7. " << parent->goodbye() << "\n";
cout << "8. " << child->goodbye() << "\n";
cout << "9. " << vparent->goodbye() << "\n";
cout << "10. " << parent << "\n";
cout << "11. " << child << "\n";
cout << "12. " << vparent << "\n";
delete child;
delete parent;
return 0;
}
Here we can see from the class definition that the Child class is inheriting from the Parent class. The Child class doesn't have any implementation of the wave() method because we're expecting it to be inherited from the Parent. The Child class statically overrides its parent's hello() implementation but dynamically overrides its parent's goodbye() method. We can see this because of the virtual keyword that's added before the name of the method. Note that it's actually specified on the parent's goodbye() method. It's parents that decide whether their children can inherit methods virtually or not.Now let's see what happens when we build and run this code.
$ g++ main.cpp $ ./a.out 1. Hello son 2. Hello Mum 3. Hello son 4. Waves 5. Waves 6. Waves 7. Goodbye son 8. Goodbye Mum 9. Goodbye Mum 10. 0x563a9f694eb0 11. 0x563a9f694ed0 12. 0x563a9f694ed0Notice how the Child class is still able to successfully call the wave() method (line 5). When the child class calls hello() and goodbye() it calls its own implementations of these methods.
However, there's also this peculiar vparent variable. This is the instance of Child that's been dynamically cast to look like a Parent. We can see that child and parent are actually the same object because they point to the same place (lines 11 and 12) compared to the parent object which has a different pointer (line 10).
Casing a Child to a Parent is perfectly safe because the former is inheriting from the latter. In other words, the code knows that everything a Parent has a Child will have as well. Safe.
But in the case of the dynamic cast, the calls to any overridden virtual methods are resolved at runtime rather than compile time. In particular, even though vparent is of type Parent, calling the goodbye() method on it calls the child's implementation of goodbye() (line 9).
The way this is achieved is with a vtable (this is where we're going!). This is a list of pointers to methods stored at runtime. Because goodbye() is marked as virtual in the Parent class, a pointer to this method is stored in the vtable. When the compiler calls the method it gets the address to call from the vtable, rather than from some fixed value stored at compile time.
Now when the Child dynamically overrides goodbye() it overwrites the value in the vtable. The result is that when the goodbye() class is called from vparent, the Child instance is referenced even though the class looks otherwise just like a Parent.
Finally we get to our error. The error is suggesting that there's some method that should be virtual, but no vtable has been created. This is most likely because there's a signature for a virtual method, but no implementation for any virtual method.
It's all a bit obscure, made more so because there are no virtual methods in the definition. However we do have ~SharedSurfaceTextureClient() in the class definition that doesn't have an implementation. Plus the class is inheriting from TextureData and this has a virtual destructor. As a result the ~SharedSurfaceTextureClient() destructor will also need to be added to the vtable.
But while ~SharedSurfaceTextureClient() appears in the class definition, there is no implementation of it. This is therefore likely what's causing our error.
The solution, after this very long explanation, is that we need to add in the implementation of the class destructor. Thankfully there's a destructor implementation in the ESR 78 code we can use:
SharedSurfaceTextureClient::~SharedSurfaceTextureClient() {
// XXX - Things break when using the proper destruction handshake with
// SharedSurfaceTextureData because the TextureData outlives its gl
// context. Having a strong reference to the gl context creates a cycle.
// This needs to be fixed in a better way, though, because deleting
// the TextureData here can race with the compositor and cause flashing.
TextureData* data = mData;
mData = nullptr;
Destroy();
if (data) {
// Destroy mData right away without doing the proper deallocation handshake,
// because SharedSurface depends on things that may not outlive the
// texture's destructor so we can't wait until we know the compositor isn't
// using the texture anymore. It goes without saying that this is really bad
// and we should fix the bugs that block doing the right thing such as bug
// 1224199 sooner rather than later.
delete data;
}
}
As I mentioned yesterday, the partial builds all passed. But last night I also set off the full build again. So what was the outcome of this? The good news is that the full build went through as well, as a consequence of which I now have five shiny new xulrunner-qt5 packages to test on my phone. I'm not expecting them to work first time, but testing them is an essential step in finding out how to progress. Let's give them a go...
$ gdb harbour-webview
GNU gdb (GDB) Mer (8.2.1+git9)
[...]
(gdb) r
Starting program: /usr/bin/harbour-webview
[...]
=============== Preparing offscreen rendering context ===============
[New LWP 29323]
Thread 36 "Compositor" received signal SIGSEGV, Segmentation fault.
[Switching to LWP 29318]
mozilla::gl::SwapChain::OffscreenSize (this=0x0)
at gfx/gl/GLScreenBuffer.cpp:141
141 return mPresenter->mBackBuffer->mFb->mSize;
(gdb) bt
#0 mozilla::gl::SwapChain::OffscreenSize (this=0x0)
at gfx/gl/GLScreenBuffer.cpp:141
#1 0x0000007ff3666884 in mozilla::embedlite::EmbedLiteCompositorBridgeParent::
CompositeToDefaultTarget (this=0x7fc4b7c500, aId=...)
at ${PROJECT}/obj-build-mer-qt-xr/dist/include/mozilla/UniquePtr.h:290
#2 0x0000007ff12b6fbc in mozilla::layers::CompositorVsyncScheduler::
ForceComposeToTarget (this=0x7fc4d23b20, aTarget=aTarget@entry=0x0,
aRect=aRect@entry=0x0)
at ${PROJECT}/obj-build-mer-qt-xr/dist/include/mozilla/layers/
LayersTypes.h:82
#3 0x0000007ff12b7018 in mozilla::layers::CompositorBridgeParent::
ResumeComposition (this=this@entry=0x7fc4b7c500)
at ${PROJECT}/obj-build-mer-qt-xr/dist/include/mozilla/RefPtr.h:313
#4 0x0000007ff12b70a4 in mozilla::layers::CompositorBridgeParent::
ResumeCompositionAndResize (this=0x7fc4b7c500, x=<optimized out>, y=<optimized out>,
width=<optimized out>, height=<optimized out>)
at gfx/layers/ipc/CompositorBridgeParent.cpp:794
#5 0x0000007ff12afc40 in mozilla::detail::RunnableMethodArguments<int, int,
int, int>::applyImpl<mozilla::layers::CompositorBridgeParent, void
(mozilla::layers::CompositorBridgeParent::*)(int, int, int, int),
StoreCopyPassByConstLRef<int>, StoreCopyPassByConstLRef<int>,
StoreCopyPassByConstLRef<int>, StoreCopyPassByConstLRef<int>, 0ul, 1ul,
2ul, 3ul> (args=..., m=<optimized out>, o=<optimized out>)
at ${PROJECT}/obj-build-mer-qt-xr/dist/include/nsThreadUtils.h:1151
[...]
#17 0x0000007ff6a0489c in ?? () from /lib64/libc.so.6
(gdb) p this
$1 = (const mozilla::gl::SwapChain * const) 0x0
(gdb)
Immediately there's a segmentation fault and it feels like we've been here before. Here's where the crash is triggered:
const gfx::IntSize& SwapChain::OffscreenSize() const {
return mPresenter->mBackBuffer->mFb->mSize;
}
It's being triggered because the instance of SwapChain this is being called from is null. But hang on; didn't we just spend days getting rid of the SwapChain code and swapping in GLScreenBuffer precisely to avoid this error? Well, yes, we did. Clearly after changing all that code I missed a case of SwapChain being used.The fix is to switch back from SwapChain to the previous GLScreenBuffer interface, like to:
@@ -151,8 +153,7 @@ EmbedLiteCompositorBridgeParent::
CompositeToDefaultTarget(VsyncId aId)
if (context->IsOffscreen()) {
MutexAutoLock lock(mRenderMutex);
- if (context->GetSwapChain()->OffscreenSize() != mEGLSurfaceSize
- && !context->GetSwapChain()->Resize(mEGLSurfaceSize)) {
+ if (context->OffscreenSize() != mEGLSurfaceSize &&
+ !context->ResizeOffscreen(mEGLSurfaceSize)) {
return;
}
}
I've also checked through the rest of the EmbedliteCompositionBridgeParent code to ensure there are no other SwapChain references in there. And, with that, we're done for the day. I've spent a long time explaining vtables today and very little time actually coding, but the change is an essential one and I can't test it without another build. So I've set it building again and with any luck I'll be able to test it again tomorrow.If you'd like to read any of my other gecko diary entries, they're all available on my Gecko-dev Diary page.
5 Mar 2024 : Day 176 #
Just as I was explaining in my diary entry yesterday, the first thing I like to do after I wake up following a night of hard work — all performed by my laptop building the latest Gecko changes of course — is to scan the output for red. Red indicates errors.
When I peeked in this morning there was no red showing on the console. But my excitement was short-lived. The exception to the "errors are red" rule is when they come from the linker rather than the compiler and that's what seems to have happened here.
I'm not sure why the linker doesn't bother highlighting errors in red, but on close inspection they definitely are errors.
The fact it compiled without error is nevertheless exciting in itself, just not as exciting as actually having a binary to test. So what are these errors? As is the way with the linker, they're all "undefined reference" or symbol-related errors. This happens when the code calls something that may, for example, have a method signature but no method definition. That can be common with pure virtual functions that aren't subsequently overridden, say, but there are other reasons too. For example I might have added a method signature simply without adding in the method body. Here's a sample of the errors that came out:
The partial builds all now pass, so it's time to do a full rebuild. Here's the updated tally of changes once again to highlight today's progress:
[...]
An early and unusually short build run (just 5 hours 12 minutes) meant that I've got a second bit of the cherry! The build finished before the end of the day. It's not a successful build unfortunately, but by discovering this now rather than in the morning I'm able to claim an entire day back. So I'm very happy about that.
Here are the linker errors. Well, actually, I think it's just one error that's spread over many lines:
With these latest changes the partial builds still all pass. So it's time to set the full build off again. But this also means it's the end of my gecko development for the day. More tomorrow when we'll see how things have gone.
If you'd like to read any of my other gecko diary entries, they're all available on my Gecko-dev Diary page.
Comment
When I peeked in this morning there was no red showing on the console. But my excitement was short-lived. The exception to the "errors are red" rule is when they come from the linker rather than the compiler and that's what seems to have happened here.
I'm not sure why the linker doesn't bother highlighting errors in red, but on close inspection they definitely are errors.
The fact it compiled without error is nevertheless exciting in itself, just not as exciting as actually having a binary to test. So what are these errors? As is the way with the linker, they're all "undefined reference" or symbol-related errors. This happens when the code calls something that may, for example, have a method signature but no method definition. That can be common with pure virtual functions that aren't subsequently overridden, say, but there are other reasons too. For example I might have added a method signature simply without adding in the method body. Here's a sample of the errors that came out:
403:37.88 toolkit/library/build/libxul.so
410:16.07 aarch64-meego-linux-gnu-ld: ../../../gfx/gl/GLScreenBuffer.o:
in function `mozilla::gl::GLScreenBuffer::~GLScreenBuffer()':
410:16.07 ${PROJECT}/gecko-dev/gfx/gl/GLScreenBuffer.cpp:296:
undefined reference to `mozilla::gl::SurfaceCaps::~SurfaceCaps()'
410:16.07 aarch64-meego-linux-gnu-ld: /jol403:37.88
toolkit/library/build/libxul.so
410:16.07 aarch64-meego-linux-gnu-ld: ../../../gfx/gl/GLScreenBuffer.o:
in function `mozilla::gl::GLScreenBuffer::~GLScreenBuffer()':
410:16.07 ${PROJECT}/gecko-dev/gfx/gl/GLScreenBuffer.cpp:296:
undefined reference to `mozilla::gl::SurfaceCaps::~SurfaceCaps()'
410:16.07 aarch64-meego-linux-gnu-ld: ${PROJECT}/gecko-dev/gfx/gl/
GLScreenBuffer.cpp:296: undefined reference to
`mozilla::gl::SurfaceCaps::~SurfaceCaps()'
410:16.07 aarch64-meego-linux-gnu-ld: ../../../gfx/gl/Unified_cpp_gfx_gl0.o:
in function `mozilla::gl::GLContext::GLContext(mozilla::gl::GLContextDesc
const&, mozilla::gl::GLContext*, bool)':
410:16.07 ${PROJECT}/gecko-dev/gfx/gl/GLContext.cpp:290: undefined reference to
`mozilla::gl::SurfaceCaps::SurfaceCaps()'
[...]
410:16.10 aarch64-meego-linux-gnu-ld: libxul.so: hidden symbol
`_ZNK7mozilla2gl9GLContext15ChooseGLFormatsERKNS0_11SurfaceCapsE'
isn't defined
410:16.10 aarch64-meego-linux-gnu-ld: final link failed: bad value
410:16.10 collect2: error: ld returned 1 exit status
Let me summarise all of the errors we have here and make things a bit clearer. The following are all the error locations followed by the names of the missing implementations.
GLScreenBuffer.cpp:296: SurfaceCaps::~SurfaceCaps()
GLContext.cpp:290: SurfaceCaps::SurfaceCaps()
SharedSurface.cpp:362: SurfaceCaps::SurfaceCaps(mozilla::gl::SurfaceCaps const&)
SharedSurface.cpp:361: GLContext::ChooseGLFormats(
mozilla::gl::SurfaceCaps const&) const
SharedSurface.cpp:362: SurfaceCaps::SurfaceCaps()
SharedSurface.cpp:338: SurfaceCaps::SurfaceCaps()
SurfaceTypes.h:38: SurfaceCaps::SurfaceCaps()
SurfaceTypes.h:38: SurfaceCaps::operator=(mozilla::gl::SurfaceCaps const&)
SurfaceTypes.h:38: SurfaceCaps::~SurfaceCaps()
SharedSurface.cpp:350: SurfaceCaps::operator=(mozilla::gl::SurfaceCaps const&)
SharedSurface.cpp:338: SurfaceCaps::~SurfaceCaps()
SharedSurface.cpp:367: SurfaceCaps::~SurfaceCaps()
GLContext.cpp:296: SurfaceCaps::~SurfaceCaps()
SharedSurfaceGL.cpp:39: SurfaceCaps::SurfaceCaps()
SharedSurfaceGL.cpp:39: SurfaceCaps::~SurfaceCaps()
RefPtr.h:590: SharedSurfaceTextureClient::SharedSurfaceTextureClient(
mozilla::layers::SharedSurfaceTextureData*, mozilla::layers::TextureFlags,
mozilla::layers::LayersIPCChannel*)
So, what's going on with these? Let's take a look. First up we have line 296 of GLScreenBuffer.cpp. This line, it turns out, is where the GLScreenBuffer destructor implementation starts in the code:
GLScreenBuffer::~GLScreenBuffer() {
mFactory = nullptr;
mRead = nullptr;
if (!mBack) return;
// Detach mBack cleanly.
mBack->Surf()->ProducerRelease();
}
Any instance of GLScreenBuffer will also hold an instance of SurfaceCaps as we can see in the header:
public: const SurfaceCaps mCaps;This is an actual instance of SurfaceCaps not just a pointer to it, so when the GLScreenBuffer instance is destroyed mCaps will be too, triggering a call to the SurfaceCaps destructor. If we look in the SurfaceTypes.h header file we can see that there is a destructor specified:
struct SurfaceCaps final {
[...]
SurfaceCaps();
SurfaceCaps(const SurfaceCaps& other);
~SurfaceCaps();
[...]
But nowhere is the body of the method defined. Compare that to the ESR 78 code where the SurfaceCaps class looks the same. The difference is that checking in the GLContect.cpp source we find these:
// These are defined out of line so that we don't need to include // ISurfaceAllocator.h in SurfaceTypes.h. SurfaceCaps::SurfaceCaps() = default; SurfaceCaps::SurfaceCaps(const SurfaceCaps& other) = default; SurfaceCaps& SurfaceCaps::operator=(const SurfaceCaps& other) = default; SurfaceCaps::~SurfaceCaps() = default;They're pretty much the simplest implementations you can get. But they are at least implementations. So with any luck adding these in to the ESR 91 code as well will solve quite a few of the linker errors. That's not everything though. After we take away the instances that these four methods deal with we're left with these two:
SharedSurface.cpp:361: GLContext::ChooseGLFormats(
mozilla::gl::SurfaceCaps const&) const
RefPtr.h:590: SharedSurfaceTextureClient::SharedSurfaceTextureClient(
mozilla::layers::SharedSurfaceTextureData*, mozilla::layers::TextureFlags,
mozilla::layers::LayersIPCChannel*)
Let's check SharedSurface.cpp line 361 next. The line looks like this:
mFormats(partialDesc.gl->ChooseGLFormats(caps)),
If we look in the GLContext class, sure enough we can see the method signature:
// Only varies based on bpp16 and alpha. GLFormats ChooseGLFormats(const SurfaceCaps& caps) const;
We can see the same signature in the ESR 78 code. Once again though, the body of the method is defined in GLContext.cpp of ESR 78, whereas it's nowhere to be found in ESR 91. So I've copied the missing code over:
GLFormats GLContext::ChooseGLFormats(const SurfaceCaps& caps) const { GLFormats formats; // If we're on ES2 hardware and we have an explicit request for 16 bits of // color or less OR we don't support full 8-bit color, return a 4444 or 565 // format. bool bpp16 = caps.bpp16; [...]
Finally we have a reference to SharedSurfaceTextureClient. The reference to line 590 of RefPtr.h is unhelpful; what we really want to know is where the RefPtr is being used. A quick search suggests it's inside GLScreenBuffer where there are a couple of cases that look like this:
bool GLScreenBuffer::Swap(const gfx::IntSize& size) {
RefPtr<layers::SharedSurfaceTextureClient> newBack =
mFactory->NewTexClient(size);
[...]
There's no definition of SharedSurfaceTextureClient::SharedSurfaceTextureClient() in the ESR 91 code, but there is in the ESR 78 code, in the TextureClientSharedSurface.cpp source:
SharedSurfaceTextureClient::SharedSurfaceTextureClient(
SharedSurfaceTextureData* aData, TextureFlags aFlags,
LayersIPCChannel* aAllocator)
: TextureClient(aData, aFlags, aAllocator) {
mWorkaroundAnnoyingSharedSurfaceLifetimeIssues = true;
}
I've copied that code over as well. But my reading that's all of them. So this may mean we're ready to kick off a full rebuild. Before doing so, it's worth spending a bit of extra time to check that the changes pass our three partial builds already.
$ make -j1 -C obj-build-mer-qt-xr/gfx/gl/ [...] $ make -j1 -C obj-build-mer-qt-xr/dom/canvas [...] $ make -j1 -C obj-build-mer-qt-xr/gfx/layers [...]The first two work fine, but the last generates a new error:
${PROJECT}/gecko-dev/gfx/layers/client/TextureClientSharedSurface.cpp:109:3:
error: ‘mWorkaroundAnnoyingSharedSurfaceLifetimeIssues’
was not declared in this scope
mWorkaroundAnnoyingSharedSurfaceLifetimeIssues = true;
^~~~~~~~~~~~~~~~~~~~~~~~~~~~~~~~~~~~~~~~~~~~~~
This mWorkaroundAnnoyingSharedSurfaceLifetimeIssues variable is present in ESR 78, used to decide whether or not to deallocate the TextureData when the TextureClient is destroyed. Here's the logic it's part of:
void TextureClient::Destroy() {
[...]
TextureData* data = mData;
if (!mWorkaroundAnnoyingSharedSurfaceLifetimeIssues) {
mData = nullptr;
}
if (data || actor) {
[...]
params.workAroundSharedSurfaceOwnershipIssue =
mWorkaroundAnnoyingSharedSurfaceOwnershipIssues;
if (mWorkaroundAnnoyingSharedSurfaceLifetimeIssues) {
params.data = nullptr;
} else {
params.data = data;
}
[...]
DeallocateTextureClient(params);
This logic has been removed in ESR 91 and, if I'm honest, I'm comfortable leaving it this way. Here's what the equivalent ERS 91 code looks like:
void TextureClient::Destroy() {
[...]
TextureData* data = mData;
mData = nullptr;
if (data || actor) {
[...]
DeallocateTextureClient(params);
}
}
As you can see, there are no references to mWorkaroundAnnoyingSharedSurfaceLifetimeIssues, or anything like it, there at all. Consequently I'm just going to remove the references to it from our new SharedSurfaceTextureClient constructor as well:
SharedSurfaceTextureClient::SharedSurfaceTextureClient(
SharedSurfaceTextureData* aData, TextureFlags aFlags,
LayersIPCChannel* aAllocator)
: TextureClient(aData, aFlags, aAllocator) {
}
Maybe this will cause problems later, but my guess is that if there are going to be problems, they'll be pretty straightforward to track down with the debugger, at which point we can refer back to the ESR 78 code to restore these checks.The partial builds all now pass, so it's time to do a full rebuild. Here's the updated tally of changes once again to highlight today's progress:
$ git diff --numstat 145 16 gfx/gl/GLContext.cpp 73 8 gfx/gl/GLContext.h 11 0 gfx/gl/GLContextTypes.h 590 0 gfx/gl/GLScreenBuffer.cpp 171 1 gfx/gl/GLScreenBuffer.h 305 5 gfx/gl/SharedSurface.cpp 132 4 gfx/gl/SharedSurface.h 16 10 gfx/gl/SharedSurfaceEGL.cpp 13 3 gfx/gl/SharedSurfaceEGL.h 81 2 gfx/gl/SharedSurfaceGL.cpp 61 0 gfx/gl/SharedSurfaceGL.h 60 0 gfx/gl/SurfaceTypes.h 27 0 gfx/layers/client/TextureClientSharedSurface.cpp 25 0 gfx/layers/client/TextureClientSharedSurface.h $ git diff --shortstat 14 files changed, 1710 insertions(+), 49 deletions(-)So off the build goes again:
$ sfdk build -d --with git_workaround
NOTICE: Appending changelog entries to the RPM SPEC file…
Setting version: 91.9.1+git1+sailfishos.esr91.20240302180401.
2f1f19ac7d73+gecko.dev.5292b747b036
Directory walk started
[...]
This will likely take until the morning, at which point I'll be eagerly checking for errors once again.[...]
An early and unusually short build run (just 5 hours 12 minutes) meant that I've got a second bit of the cherry! The build finished before the end of the day. It's not a successful build unfortunately, but by discovering this now rather than in the morning I'm able to claim an entire day back. So I'm very happy about that.
Here are the linker errors. Well, actually, I think it's just one error that's spread over many lines:
308:11.87 toolkit/library/build/libxul.so
311:51.74 aarch64-meego-linux-gnu-ld: ../../../gfx/layers/
Unified_cpp_gfx_layers6.o: in function `mozilla::layers::
SharedSurfaceTextureClient::SharedSurfaceTextureClient
(mozilla::layers::SharedSurfaceTextureData*, mozilla::layers::TextureFlags,
mozilla::layers::LayersIPCChannel*)':
311:51.74 ${PROJECT}/gecko-dev/gfx/layers/client/
TextureClientSharedSurface.cpp:108: undefined reference to
`vtable for mozilla::layers::SharedSurfaceTextureClient'
311:51.74 aarch64-meego-linux-gnu-ld: ${PROJECT}/gecko-dev/gfx/layers/client/
TextureClientSharedSurface.cpp:108: undefined reference to
`vtable for mozilla::layers::SharedSurfaceTextureClient'
311:51.74 aarch64-meego-linux-gnu-ld: libxul.so: hidden symbol
`_ZTVN7mozilla6layers26SharedSurfaceTextureClientE' isn't defined
311:51.74 aarch64-meego-linux-gnu-ld: final link failed: bad value
311:51.75 collect2: error: ld returned 1 exit status
The essence of error is the following:
TextureClientSharedSurface.cpp:108: undefined reference to
`vtable for mozilla::layers::SharedSurfaceTextureClient'
I'm going to hold of explaining what's going on here until tomorrow. This post is already rather long and I don't have the energy to go in to the details tonight. But I have added in a fix.With these latest changes the partial builds still all pass. So it's time to set the full build off again. But this also means it's the end of my gecko development for the day. More tomorrow when we'll see how things have gone.
If you'd like to read any of my other gecko diary entries, they're all available on my Gecko-dev Diary page.
4 Mar 2024 : Day 175 #
I've been really struggling to get the GLScreenBuffer code back compiling again over the last few days. This is partly because a whole raft of interfaces have changed and these changes have seeped through into many different places in the code. Often the changes are quite small, such as using a reference rather than a pointer. But other times they're more significant, such as the way member variables in SharedSurface have changed. To look into the latter in a little more detail, the previous version looked like this:
Besides all this I've also had what feels like several long days at work. The result is that when I come to work on Gecko of an evening the code swims around in front of my eyes and refuses to stay still as my mind drifts hither and thither.
Nevertheless I've been persevering with my "fix, compile, examine" routine and have continued to make some slight progress. Once again, I don't want to go into the full detail of the changes I've had to make, because it really is just reintroducing code that was removed upstream. So there's a lot of it, and I'm not even spending any time attempting to understand it.
But it has now got to the point where all three directories I've been making changes to are compiling when I do the partial builds:
Before I do that, here are the latest stats showing the changes I've made in relation to the offscreen rendering pipeline:
Alright, time to set the build off. Hopefully this will complete without errors, but I'm not betting on it.
If you'd like to read any of my other gecko diary entries, they're all available on my Gecko-dev Diary page.
Comment
class SharedSurface {
public:
[...]
const SharedSurfaceType mType;Th
const AttachmentType mAttachType;
const WeakPtr<GLContext> mGL;
const gfx::IntSize mSize;
const bool mHasAlpha;
const bool mCanRecycle;
But the new code bundles all this up into a structure so that it now looks more like this:
struct PartialSharedSurfaceDesc {
const WeakPtr<GLContext> gl;
const SharedSurfaceType type;
const layers::TextureType consumerType;
const bool canRecycle;
};
struct SharedSurfaceDesc : public PartialSharedSurfaceDesc {
gfx::IntSize size = {};
};
class SharedSurface {
public:
[...]
const SharedSurfaceDesc mDesc;
Even this might seem like a small change, but it can make it really hard to match up method signatures given the ESR 78 version takes a collection of individual parameters, whilst the ESR 91 version requires just a single SharedSurfaceDesc instance.Besides all this I've also had what feels like several long days at work. The result is that when I come to work on Gecko of an evening the code swims around in front of my eyes and refuses to stay still as my mind drifts hither and thither.
Nevertheless I've been persevering with my "fix, compile, examine" routine and have continued to make some slight progress. Once again, I don't want to go into the full detail of the changes I've had to make, because it really is just reintroducing code that was removed upstream. So there's a lot of it, and I'm not even spending any time attempting to understand it.
But it has now got to the point where all three directories I've been making changes to are compiling when I do the partial builds:
$ make -j1 -C obj-build-mer-qt-xr/gfx/gl/ [...] $ make -j1 -C obj-build-mer-qt-xr/dom/canvas [...] $ make -j1 -C obj-build-mer-qt-xr/gfx/layers [...]I've been here before of course. Just because the partial builds compile without errors doesn't mean the full build will pass. So the next step for me tonight is to set the full build running so we can come back to it and check its status in the morning.
Before I do that, here are the latest stats showing the changes I've made in relation to the offscreen rendering pipeline:
$ git diff --numstat 73 16 gfx/gl/GLContext.cpp 73 8 gfx/gl/GLContext.h 11 0 gfx/gl/GLContextTypes.h 590 0 gfx/gl/GLScreenBuffer.cpp 171 1 gfx/gl/GLScreenBuffer.h 305 5 gfx/gl/SharedSurface.cpp 132 4 gfx/gl/SharedSurface.h 16 10 gfx/gl/SharedSurfaceEGL.cpp 13 3 gfx/gl/SharedSurfaceEGL.h 81 2 gfx/gl/SharedSurfaceGL.cpp 61 0 gfx/gl/SharedSurfaceGL.h 60 0 gfx/gl/SurfaceTypes.h 21 0 gfx/layers/client/TextureClientSharedSurface.cpp 25 0 gfx/layers/client/TextureClientSharedSurface.h $ git diff --shortstat 14 files changed, 1632 insertions(+), 49 deletions(-)That's not a huge increase on yesterday, but is at least non-zero. This reflects the fact that as things have progressed the fixes have become smaller, but thornier. All of the main changes this time seem to have been to the GLContext code.
Alright, time to set the build off. Hopefully this will complete without errors, but I'm not betting on it.
If you'd like to read any of my other gecko diary entries, they're all available on my Gecko-dev Diary page.
3 Mar 2024 : Day 174 #
As I walk, half asleep, from bedroom to kitchen for breakfast each morning I have to go past the office space where I work on my laptop. Whenever I leave a build running overnight I can't resist the urge to peak in and see how things have gone as I go past.
This morning I peaked in and saw a barrage of errors, highlighted in red, spanning back into the history of the terminal buffer. That's not quite the morning wake-up I was hoping for!
Nevertheless, as I like to tell myself, it still represents progress. And so today I have the task of fixing these fresh errors. Compile-time errors are generally easier to fix than runtime errors, so I don't mind at all really.
That was earlier today though and as I write this I'm already on the train. I've made the smart move of connecting all my devices to the same Wifi hotspot on my phone, which means no wires today. It's all surprisingly well arranged, although that hasn't prevented me from knocking my phone under the seat in front of me already once this journey.
This calls for another one of thigg's amazing images. This one feels a lot less chaotic than the last, albeit with a stalker fox in the background adding an ominous air to proceedings!

So that's me today. Before I start, let's have some stats from git so we can compare what happens now with what we get at the end of the day.
[...]
I've managed to plough through quite a few issues, almost all related to the SharedSurfaceGL and EmbedliteCompositorBridgeParent classes. Unfortunately I've not managed to get to the point where the partial builds are going through without error. That means there's no point in setting the full build to run over night. Instead, I'll have to pick up the errors where I left off in the morning.
Just to demonstrate that some progress has been made, here are the new stats for this evening.
Comment
This morning I peaked in and saw a barrage of errors, highlighted in red, spanning back into the history of the terminal buffer. That's not quite the morning wake-up I was hoping for!
Nevertheless, as I like to tell myself, it still represents progress. And so today I have the task of fixing these fresh errors. Compile-time errors are generally easier to fix than runtime errors, so I don't mind at all really.
That was earlier today though and as I write this I'm already on the train. I've made the smart move of connecting all my devices to the same Wifi hotspot on my phone, which means no wires today. It's all surprisingly well arranged, although that hasn't prevented me from knocking my phone under the seat in front of me already once this journey.
This calls for another one of thigg's amazing images. This one feels a lot less chaotic than the last, albeit with a stalker fox in the background adding an ominous air to proceedings!

So that's me today. Before I start, let's have some stats from git so we can compare what happens now with what we get at the end of the day.
$ git diff --numstat 38 4 gfx/gl/GLContext.cpp 59 7 gfx/gl/GLContext.h 11 0 gfx/gl/GLContextTypes.h 590 0 gfx/gl/GLScreenBuffer.cpp 171 1 gfx/gl/GLScreenBuffer.h 305 5 gfx/gl/SharedSurface.cpp 130 3 gfx/gl/SharedSurface.h 16 10 gfx/gl/SharedSurfaceEGL.cpp 13 3 gfx/gl/SharedSurfaceEGL.h 8 2 gfx/gl/SharedSurfaceGL.cpp 3 0 gfx/gl/SharedSurfaceGL.h 60 0 gfx/gl/SurfaceTypes.h 21 0 gfx/layers/client/TextureClientSharedSurface.cpp 25 0 gfx/layers/client/TextureClientSharedSurface.h $ git diff --shortstat 14 files changed, 1450 insertions(+), 35 deletions(-)Now on to the bug fixing!
[...]
I've managed to plough through quite a few issues, almost all related to the SharedSurfaceGL and EmbedliteCompositorBridgeParent classes. Unfortunately I've not managed to get to the point where the partial builds are going through without error. That means there's no point in setting the full build to run over night. Instead, I'll have to pick up the errors where I left off in the morning.
Just to demonstrate that some progress has been made, here are the new stats for this evening.
$ git diff --numstat 58 4 gfx/gl/GLContext.cpp 70 7 gfx/gl/GLContext.h 11 0 gfx/gl/GLContextTypes.h 590 0 gfx/gl/GLScreenBuffer.cpp 171 1 gfx/gl/GLScreenBuffer.h 305 5 gfx/gl/SharedSurface.cpp 131 4 gfx/gl/SharedSurface.h 16 10 gfx/gl/SharedSurfaceEGL.cpp 13 3 gfx/gl/SharedSurfaceEGL.h 72 2 gfx/gl/SharedSurfaceGL.cpp 60 0 gfx/gl/SharedSurfaceGL.h 60 0 gfx/gl/SurfaceTypes.h 21 0 gfx/layers/client/TextureClientSharedSurface.cpp 25 0 gfx/layers/client/TextureClientSharedSurface.h $ git diff --shortstat 14 files changed, 1603 insertions(+), 36 deletions(-)If you'd like to read any of my other gecko diary entries, they're all available on my Gecko-dev Diary page.
2 Mar 2024 : Day 173 #
This morning I wake up to find the build has failed while attempting to compile dom/canvas/WebGLContext.cpp. This follows from all of the changes I've been making to try to bring back GLScreenBuffer. Yesterday I used partial builds, performed inside the scratchbox build target, to test my changes. Now that I've tried to build the whole of gecko it's failed with the following error:
It's not an ideal sign though as it suggests the changes I've made aren't self-contained. Ideally they would be. But let's run with it and focus on fixing the issue.
The good news is that I can trigger the same error back inside the scratchbox target by building the directory containing the file that's causing the error:
Performing a diff on the change we've made to SurfaceFactory_Basic() we can see how things are and how they were for comparison:
So, we need to look inside SurfaceFactory.cpp and specifically at the SurfaceFactory constructor. I fear this is going to get messy.
The mCaps, mAllocator and mFlags members only seem to get used directly in SurfaceFactory::NewTexClient(). They're public, so that doesn't mean they don't get used elsewhere, but I suspect the only other places they're used are in new code I've added for GLScreenBuffer. This won't be used by WebGLContext.
Similarly the NewTexClient() method is only called within GLScreenBuffer::Swap() and GLScreenBuffer::Resize(). The WebGLContext code doesn't have to worry or care about these as the WebGLContext code is entirely orthogonal.
In conclusion, it should be safe to set all the new parameters to some default or null values. So I've added in a new version of the SurfaceFactory_Basic constructor like this:
Okay, it's now time to set off a full build again. It's quite possible something else will fail, but running the build is the simplest way to find out. This will, of course, take a while. If it's done by the end of the day there may be time to test it this evening; let's see.
In the meantime, it's worth noting that ultimately the mCaps, mAllocator and mFlags parameters we've been discussing only seem to get used by the two different versions of GLScreenBuffer::CreateFactory(). However I can't find any code that actually calls either of these. So it's quite possible that eventually all of the code related to these parameters will be found to be redundant and can be removed. But we'll come back to that later.
[...]
Sadly this wasn't the last of the errors; the build failed again. The error is rather interesting:
So I'll need to add in the GetTextureFlags() to SharedSurface.h. It's a simple method because all of the functionality is supposed to come from it being overridden. So I've added this in to SharedSurface.h:
If you'd like to read any of my other gecko diary entries, they're all available on my Gecko-dev Diary page.
Comment
66:19.17 ${PROJECT}/obj-build-mer-qt-xr/dist/include/mozilla/UniquePtr.h:
In instantiation of ‘typename mozilla::detail::UniqueSelector<T>::
SingleObject mozilla::MakeUnique(Args&& ...) [with T = mozilla::gl::
SurfaceFactory_Basic; Args = {mozilla::gl::GLContext&};
typename mozilla::detail::UniqueSelector<T>::SingleObject = mozilla::
UniquePtr<mozilla::gl::SurfaceFactory_Basic, mozilla::DefaultDelete
<mozilla::gl::SurfaceFactory_Basic> >]’:
66:19.17 ${PROJECT}/gecko-dev/dom/canvas/WebGLContext.cpp:929:67:
required from here
66:19.17 ${PROJECT}/obj-build-mer-qt-xr/dist/include/mozilla/UniquePtr.h:609:23:
error: no matching function for call to ‘mozilla::gl::SurfaceFactory_Basic::
SurfaceFactory_Basic(mozilla::gl::GLContext&)’
66:19.17 return UniquePtr<T>(new T(std::forward<Args>(aArgs)...));
66:19.17 ^~~~~~~~~~~~~~~~~~~~~~~~~~~~~~~~~~~
66:19.17 In file included from ${PROJECT}/gecko-dev/dom/canvas/
WebGLContext.cpp:52,
66:19.17 from Unified_cpp_dom_canvas1.cpp:119:
66:19.18 ${PROJECT}/gecko-dev/gfx/gl/SharedSurfaceGL.h:31:12: note: candidate: ‘mozilla::gl::SurfaceFactory_Basic::SurfaceFactory_Basic(mozilla::gl::
GLContext*, const mozilla::gl::SurfaceCaps&, const
mozilla::layers::TextureFlags&)’
66:19.18 explicit SurfaceFactory_Basic(GLContext* gl,
66:19.18 ^~~~~~~~~~~~~~~~~~~~
66:19.18 ${PROJECT}/gecko-dev/gfx/gl/SharedSurfaceGL.h:31:12: note:
candidate expects 3 arguments, 1 provided
This can happen and, in fact, I was almost expecting it. A partial build will only builds the files inside a particular subdirectory and its children (depending on how the build scripts are structured). So if there's some other bit of code in a different branch of the directory hierarchy that uses something in this subdirectory, then it won't be compiled against the changes. If the interface changes and the a consumer of that interface is neither updated nor compiled against it, then we end up where we are now.It's not an ideal sign though as it suggests the changes I've made aren't self-contained. Ideally they would be. But let's run with it and focus on fixing the issue.
The good news is that I can trigger the same error back inside the scratchbox target by building the directory containing the file that's causing the error:
$ make -j1 -C obj-build-mer-qt-xr/dom/canvas
[...]
${PROJECT}/gecko-dev/dom/canvas/WebGLContext.cpp:929:67: required from here
${PROJECT}/obj-build-mer-qt-xr/dist/include/mozilla/UniquePtr.h:609:23: error:
no matching function
[...]
This makes it much easier to test my fixes. So with all this in place I can get down to fixing the error. Here's the code causing the problem:
if (!swapChain->mFactory) {
NS_WARNING("Failed to make an ideal SurfaceFactory.");
swapChain->mFactory = MakeUnique<gl::SurfaceFactory_Basic>(*gl);
}
These lines and all the code around it have changed quite considerably since ESR 78, but I'm still able to find a portion of code in the ESR 78 codebase that looks to be doing something similar:
if (!factory) {
// Absolutely must have a factory here, so create a basic one
factory = MakeUnique<gl::SurfaceFactory_Basic>(gl, gl->Caps(), flags);
mBackend = layers::LayersBackend::LAYERS_BASIC;
}
The error is caused by the fact I restored the previously removed SurfaceCaps and TextureFlags parameters to the SurfaceFactory_Basic() method. All of these end up being fed into the SurfaceFactory constructor.Performing a diff on the change we've made to SurfaceFactory_Basic() we can see how things are and how they were for comparison:
$ git diff gfx/gl/SharedSurfaceGL.cpp
[...]
-SurfaceFactory_Basic::SurfaceFactory_Basic(GLContext& gl)
- : SurfaceFactory({&gl, SharedSurfaceType::Basic,
- layers::TextureType::Unknown, true}) {}
+SurfaceFactory_Basic::SurfaceFactory_Basic(GLContext* gl,
+ const SurfaceCaps& caps,
+ const layers::TextureFlags& flags)
+ : SurfaceFactory({gl, SharedSurfaceType::Basic,
+ layers::TextureType::Unknown, true}, caps, nullptr, flags) {}
This doesn't really help us though: the caps and flags, which are the ones causing the problem, get passed straight through. The important change is further down. The reason I'm chasing these is because I need to find sensible default values to set them to. There may not be sensible defaults, but if there are then it will allow us to create a new method that doesn't require these additional parameters, which is what we need for the code to compile.So, we need to look inside SurfaceFactory.cpp and specifically at the SurfaceFactory constructor. I fear this is going to get messy.
$ git diff gfx/gl/SharedSurface.cpp
[...]
-SurfaceFactory::SurfaceFactory(const PartialSharedSurfaceDesc& partialDesc)
- : mDesc(partialDesc), mMutex("SurfaceFactor::mMutex") {}
[...]
+SurfaceFactory::SurfaceFactory(const PartialSharedSurfaceDesc& partialDesc,
+ const SurfaceCaps& caps,
+ const RefPtr<layers::LayersIPCChannel>& allocator,
+ const layers::TextureFlags& flags)
+ : mDesc(partialDesc),
+ mCaps(caps),
+ mAllocator(allocator),
+ mFlags(flags),
+ mFormats(partialDesc.gl->ChooseGLFormats(caps)),
+ mMutex("SurfaceFactor::mMutex")
+{
+ ChooseBufferBits(caps, &mDrawCaps, &mReadCaps);
+}
The constructor itself is just storing the values and calling ChooseBufferBits() with some of them in order to set the mDrawCaps and mReadCaps member variables. It's unlikely that mDrawCaps or mReadCaps are being used by the WebGLContext code because I added them in as part of these changes (it's possible they're used by a method that's called in WebGLContext, but I don't believe that's the case).The mCaps, mAllocator and mFlags members only seem to get used directly in SurfaceFactory::NewTexClient(). They're public, so that doesn't mean they don't get used elsewhere, but I suspect the only other places they're used are in new code I've added for GLScreenBuffer. This won't be used by WebGLContext.
Similarly the NewTexClient() method is only called within GLScreenBuffer::Swap() and GLScreenBuffer::Resize(). The WebGLContext code doesn't have to worry or care about these as the WebGLContext code is entirely orthogonal.
In conclusion, it should be safe to set all the new parameters to some default or null values. So I've added in a new version of the SurfaceFactory_Basic constructor like this:
SurfaceFactory_Basic::SurfaceFactory_Basic(GLContext& gl)
: SurfaceFactory({&gl, SharedSurfaceType::Basic,
layers::TextureType::Unknown, true}, SurfaceCaps(), nullptr, 0) {}
I've run partial builds on the original source directory that contains the changes we've been looking at, as well as the directory containing the code that failed during the full build, like this:
$ make -j1 -C obj-build-mer-qt-xr/gfx/gl/ [...] $ make -j1 -C obj-build-mer-qt-xr/dom/canvas [...]Both complete successfully without errors. Hooray!
Okay, it's now time to set off a full build again. It's quite possible something else will fail, but running the build is the simplest way to find out. This will, of course, take a while. If it's done by the end of the day there may be time to test it this evening; let's see.
In the meantime, it's worth noting that ultimately the mCaps, mAllocator and mFlags parameters we've been discussing only seem to get used by the two different versions of GLScreenBuffer::CreateFactory(). However I can't find any code that actually calls either of these. So it's quite possible that eventually all of the code related to these parameters will be found to be redundant and can be removed. But we'll come back to that later.
[...]
Sadly this wasn't the last of the errors; the build failed again. The error is rather interesting:
193:24.93 In file included from Unified_cpp_gfx_layers6.cpp:128:
193:24.93 ${PROJECT}/gecko-dev/gfx/layers/client/TextureClientSharedSurface.cpp:
In static member function ‘static already_AddRefed<mozilla::layers::
SharedSurfaceTextureClient> mozilla::layers::SharedSurfaceTextureClient::
Create(mozilla::UniquePtr<mozilla::gl::SharedSurface>,
mozilla::gl::SurfaceFactory*, mozilla::layers::LayersIPCChannel*,
mozilla::layers::TextureFlags)’:
193:24.94 ${PROJECT}/gecko-dev/gfx/layers/client/
TextureClientSharedSurface.cpp:102:63: error:
‘class mozilla::gl::SharedSurface’ has no member named ‘GetTextureFlags’
193:24.94 TextureFlags flags = aFlags | TextureFlags::RECYCLE | surf->GetTextureFlags();
193:24.94 ^~~~~~~~~~~~~~~
193:24.94 ${PROJECT}/gecko-dev/gfx/layers/client/
TextureClientSharedSurface.cpp:104:51: error: no matching function for call
to ‘mozilla::layers::SharedSurfaceTextureData::SharedSurfaceTextureData(
std::remove_reference<mozilla::UniquePtr<mozilla::gl::SharedSurface>&>::
type)’
193:24.94 new SharedSurfaceTextureData(std::move(surf));
193:24.94 ^
193:24.94 ${PROJECT}/gecko-dev/gfx/layers/client/
TextureClientSharedSurface.cpp:34:1: note: candidate:
‘mozilla::layers::SharedSurfaceTextureData::SharedSurfaceTextureData(
const mozilla::layers::SurfaceDescriptor&, mozilla::gfx::SurfaceFormat,
mozilla::gfx::IntSize)’
193:24.94 SharedSurfaceTextureData::SharedSurfaceTextureData(
193:24.94 ^~~~~~~~~~~~~~~~~~~~~~~~
193:24.94 ${PROJECT}/gecko-dev/gfx/layers/client/
TextureClientSharedSurface.cpp:34:1: note: candidate expects 3 arguments,
1 provided
Interesting because this is in part of the code that I made changes to in order to get the partial build to complete, but it turns out I wasn't actually building this code at all, it was just using the header.So I'll need to add in the GetTextureFlags() to SharedSurface.h. It's a simple method because all of the functionality is supposed to come from it being overridden. So I've added this in to SharedSurface.h:
// Specifies to the TextureClient any flags which // are required by the SharedSurface backend. virtual layers::TextureFlags GetTextureFlags() const;In addition to this I've inserted a simple implementation for it to SharedSurface.cpp:
layers::TextureFlags SharedSurface::GetTextureFlags() const {
return layers::TextureFlags::NO_FLAGS;
}
But to actually match the functionality of ESR 78 I've also added this override, directly into SharedSurfaceEGL.h:
virtual layers::TextureFlags GetTextureFlags() const override {
return layers::TextureFlags::DEALLOCATE_CLIENT;
}
They're all super-simple methods and with any luck shouldn't trigger any additional errors. I now have to do a partial build of the now three the directories that I've touched with changes:
$ make -j1 -C obj-build-mer-qt-xr/gfx/gl/ [...] $ make -j1 -C obj-build-mer-qt-xr/dom/canvas [...] $ make -j1 -C obj-build-mer-qt-xr/gfx/layers [...]Happily these all compile successfully and without errors. So it's time to kick off another full build again. I don't expect this to be done before I go to bed this evening, so I'll have to pick this up again tomorrow. In the morning we'll find out what new gruesome errors there are to deal with!
If you'd like to read any of my other gecko diary entries, they're all available on my Gecko-dev Diary page.
1 Mar 2024 : Day 172 #
Having failed to fix the offscreen (WebView) rendering pipeline using a scalpel, over the last few days I've resorted to using a sledgehammer. What I'm now doing is essentially reverting the changes made upstream that stripped out all of the GLScreenBuffer goodness that the Sailfish WebView relied on. Unfortunately the changes aren't included in a single neat commit, so I'm having to do this by hand, copying and pasting over the changes from ESR 78 back into ESR 91.
Ever present and willing, git is happy to give me a summary of how many changes I've made so far:
The changes to the other files are all intended to accommodate the reintroduction of GLScreenBuffer.
I could live with some big changes being made to a single file, but having to make a large number of changes to many files is really not ideal for the project. It'll contribute to the burden of maintenance and future upgrades. But my suspicion is that not all of the code in GLScreenBuffer is actually used. Rather than try to trim out the fat as I go along, my plan is to introduce everything and get the renderer to a state where it's working, then work on trimming out the unnecessary code afterwards.
Once that's done, I'll then move on to re-architecting the code to try to minimise the changes to the Gecko library itself. It may be that we can move some of the changes into the EmbedLite code, say, in a similar way to what we did with the printing changes. If that can be done, it'll make future maintenance that much easier.
That's the summary of where things are at. Now I'm heading back into the code to perform my bug fix cycle:
[...]
After several hours of going around the bug fix cycle I've finally reached the point where the partial build completes without any compiler errors. I've added in a lot of code, not always fully understanding the purpose, but nevertheless with the intention of matching the structure and purpose of the GLScreenBuffer code from ESR 78.
Here are the final stats — for comparison — after these changes.
So far I've only been running quick partial builds. To find out if things are really working correctly I'll have to do a full rebuild, which will need to run overnight. So this seems like a good time to stop for the day, ready to start again in the morning.
If you'd like to read any of my other gecko diary entries, they're all available on my Gecko-dev Diary page.
Comment
Ever present and willing, git is happy to give me a summary of how many changes I've made so far:
$ git diff --shortstat 11 files changed, 1012 insertions(+), 22 deletions(-)So that's over a thousand new lines added to ESR 91. Let's break that down further to find out what's been changed:
$ git diff --numstat 38 4 gfx/gl/GLContext.cpp 59 7 gfx/gl/GLContext.h 11 0 gfx/gl/GLContextTypes.h 592 0 gfx/gl/GLScreenBuffer.cpp 171 1 gfx/gl/GLScreenBuffer.h 26 0 gfx/gl/SharedSurface.cpp 14 0 gfx/gl/SharedSurface.h 15 9 gfx/gl/SharedSurfaceEGL.cpp 4 1 gfx/gl/SharedSurfaceEGL.h 60 0 gfx/gl/SurfaceTypes.h 22 0 gfx/layers/client/TextureClientSharedSurface.hAs we can see, all of the changes are to the rendering code. That's encouraging. And the majority, as expected, are re-introducing code to the GLScreenBuffer class. In fact, not just adding code into the class, but reintroducing the class in its entirety. It's this GLScreenBuffer class that was completely removed and replaced with a class called SwapChain in the upstream transition from ESR 78 to ESR 91.
The changes to the other files are all intended to accommodate the reintroduction of GLScreenBuffer.
I could live with some big changes being made to a single file, but having to make a large number of changes to many files is really not ideal for the project. It'll contribute to the burden of maintenance and future upgrades. But my suspicion is that not all of the code in GLScreenBuffer is actually used. Rather than try to trim out the fat as I go along, my plan is to introduce everything and get the renderer to a state where it's working, then work on trimming out the unnecessary code afterwards.
Once that's done, I'll then move on to re-architecting the code to try to minimise the changes to the Gecko library itself. It may be that we can move some of the changes into the EmbedLite code, say, in a similar way to what we did with the printing changes. If that can be done, it'll make future maintenance that much easier.
That's the summary of where things are at. Now I'm heading back into the code to perform my bug fix cycle:
- Build code.
- Examine compile-time errors.
- Fix the first one or two erros shown.
- Go to step 1.
[...]
After several hours of going around the bug fix cycle I've finally reached the point where the partial build completes without any compiler errors. I've added in a lot of code, not always fully understanding the purpose, but nevertheless with the intention of matching the structure and purpose of the GLScreenBuffer code from ESR 78.
Here are the final stats — for comparison — after these changes.
$ git diff --numstat 38 4 gfx/gl/GLContext.cpp 59 7 gfx/gl/GLContext.h 11 0 gfx/gl/GLContextTypes.h 590 0 gfx/gl/GLScreenBuffer.cpp 171 1 gfx/gl/GLScreenBuffer.h 301 5 gfx/gl/SharedSurface.cpp 126 3 gfx/gl/SharedSurface.h 16 10 gfx/gl/SharedSurfaceEGL.cpp 9 3 gfx/gl/SharedSurfaceEGL.h 6 4 gfx/gl/SharedSurfaceGL.cpp 3 1 gfx/gl/SharedSurfaceGL.h 60 0 gfx/gl/SurfaceTypes.h 12 0 gfx/layers/client/TextureClientSharedSurface.cpp 22 0 gfx/layers/client/TextureClientSharedSurface.h $ git diff --shortstat 14 files changed, 1424 insertions(+), 38 deletions(-)Most of the changes I've made this evening seem to have been to SharedSurface.cpp. That makes sense as it seems there were many GL/EGL related calls that had been removed.
So far I've only been running quick partial builds. To find out if things are really working correctly I'll have to do a full rebuild, which will need to run overnight. So this seems like a good time to stop for the day, ready to start again in the morning.
If you'd like to read any of my other gecko diary entries, they're all available on my Gecko-dev Diary page.
29 Feb 2024 : Day 171 #
After some considerably thought about the various options and after trying to fix the rendering pipeline with minimal changes, I've decided to change tack today. There's so much code that's been removed from the GLScreenBuffer.h and GLSCreenBuffer.cpp files that I don't see any way to resurrect the functionality without moving large parts of the removed code back in again.
Now, ideally it would be possible to add this to the EmbedLite code, rather than the gecko code. But as a first step I'm going to try to add it back in just as it was before. Following that I can then look at re-architecting it to minimise the changes needed to the gecko code itself. It would be a shame to end up with a patch that essentially just reverts a whole load of changes from upstream, but if that's where we end up, but with a working offscreen renderer, then maybe that's what we'll have to have.
Over the last few days I've already made a few changes to the code, but ironically they've only so far been to the EmbedLite portion of the code. But they're all also aimed at getting the SwapChain object working correctly. If I'm now going to reverse the upstream changes to this particular pipeline, then the SwapChain will be lost (it might get restored later; let's see). So I don't need the changes I made any more.
I've made some changes, I'm going to set it to compile and see what errors come out. It's also time for my work day, so I'll return to this — and all of the errors that come out of it — later on this evening.
[...]
I'm back to looking at this again and it's time consider the errors that came out of the most recent partial build. They look a bit like this.
My guess is that it'll be a few days at least before I've got all of these errors resolved. I'll continue charting my progress with these diary entries of course, but they may be a little shorter than usual, since the last thing anyone wants to read about is this iterative build-check-fix churn.
At least it's quite fulfilling for me, gradually watching the errors seep away. It's mundane but fulfilling work, just a little laborious. Let's see how far I've got by the end of tomorrow.
If you'd like to read any of my other gecko diary entries, they're all available on my Gecko-dev Diary page.
Comment
Now, ideally it would be possible to add this to the EmbedLite code, rather than the gecko code. But as a first step I'm going to try to add it back in just as it was before. Following that I can then look at re-architecting it to minimise the changes needed to the gecko code itself. It would be a shame to end up with a patch that essentially just reverts a whole load of changes from upstream, but if that's where we end up, but with a working offscreen renderer, then maybe that's what we'll have to have.
Over the last few days I've already made a few changes to the code, but ironically they've only so far been to the EmbedLite portion of the code. But they're all also aimed at getting the SwapChain object working correctly. If I'm now going to reverse the upstream changes to this particular pipeline, then the SwapChain will be lost (it might get restored later; let's see). So I don't need the changes I made any more.
$ git diff
diff --git a/embedding/embedlite/embedthread/EmbedLiteCompositorBridgeParent.cpp
b/embedding/embedlite/embedthread/EmbedLiteCompositorBridgeParent.cpp
index 34cff71f6e07..82cdf357f926 100644
--- a/embedding/embedlite/embedthread/EmbedLiteCompositorBridgeParent.cpp
+++ b/embedding/embedlite/embedthread/EmbedLiteCompositorBridgeParent.cpp
@@ -109,6 +109,7 @@ EmbedLiteCompositorBridgeParent::PrepareOffscreen()
GLContext* context = static_cast<CompositorOGL*>(state->mLayerManager->GetCompositor())->gl();
NS_ENSURE_TRUE(context, );
+ bool initSwapChain = false;
// TODO: The switch from GLSCreenBuffer to SwapChain needs completing
// See: https://phabricator.services.mozilla.com/D75055
@@ -125,6 +126,7 @@ EmbedLiteCompositorBridgeParent::PrepareOffscreen()
SwapChain* swapChain = context->GetSwapChain();
if (swapChain == nullptr) {
+ initSwapChain = true;
swapChain = new SwapChain();
new SwapChainPresenter(*swapChain);
context->mSwapChain.reset(swapChain);
@@ -133,6 +135,13 @@ EmbedLiteCompositorBridgeParent::PrepareOffscreen()
if (factory) {
swapChain->Morph(std::move(factory));
}
+
+ if (initSwapChain) {
+ bool success = context->ResizeScreenBuffer(mEGLSurfaceSize);
+ if (!success) {
+ NS_WARNING("Failed to create SwapChain back buffer");
+ }
+ }
}
}
$ git status
On branch sailfishos-esr91
Your branch is up-to-date with 'origin/sailfishos-esr91'.
Changes not staged for commit:
(use "git add <file>..." to update what will be committed)
(use "git restore <file>..." to discard changes in working directory)
(commit or discard the untracked or modified content in submodules)
modified: embedding/embedlite/embedthread/EmbedLiteCompositorBridgeParent.cpp
modified: gecko-dev (untracked content)
no changes added to commit (use "git add" and/or "git commit -a")
$ git checkout embedding/embedlite/embedthread/EmbedLiteCompositorBridgeParent.cpp
Updated 1 path from the index
As you can see, the changes weren't very major anyway. So I've started reconstructing the GlScreenBuffer code. It's actually quite extensive and there are a lot of edge cases related to the EGL code. It's going to take quite a few rounds of changes, failed compilations, following up on missing or changed code and then recompilations. Each of these takes quite a while, so I'm bracing myself for quite a long haul here.I've made some changes, I'm going to set it to compile and see what errors come out. It's also time for my work day, so I'll return to this — and all of the errors that come out of it — later on this evening.
[...]
I'm back to looking at this again and it's time consider the errors that came out of the most recent partial build. They look a bit like this.
64:31.86 ${PROJECT}/gecko-dev/gfx/gl/GLScreenBuffer.h:98:60: error:
‘SurfaceCaps’ does not name a type; did you mean ‘SurfaceFactory’?
64:31.86 static UniquePtr<ReadBuffer> Create(GLContext* gl, const SurfaceCaps& caps,
64:31.86 ^~~~~~~~~~~
64:31.86 SurfaceFactory
64:31.88 ${PROJECT}/gecko-dev/gfx/gl/GLScreenBuffer.h:99:45:
error: ‘GLFormats’ does not name a type; did you mean ‘eFormData’?
64:31.88 const GLFormats& formats,
64:31.88 ^~~~~~~~~
64:31.88 eFormData
[...]
64:32.20 ${PROJECT}/gecko-dev/gfx/gl/GLContext.h:3537:54:
error: ‘SurfaceCaps’ does not name a type; did you mean ‘SurfaceFormat’?
64:32.20 bool InitOffscreen(const gfx::IntSize& size, const SurfaceCaps& caps);
64:32.20 ^~~~~~~~~~~
64:32.20 SurfaceFormat
64:32.23 ${PROJECT}/gecko-dev/gfx/gl/GLContext.h:3546:59:
error: ‘SurfaceCaps’ does not name a type; did you mean ‘SurfaceFormat’?
64:32.24 bool CreateScreenBuffer(const gfx::IntSize& size, const SurfaceCaps& caps) {
64:32.24 ^~~~~~~~~~~
64:32.24 SurfaceFormat
[...]
There are, as you can see, many, many, many errors. For the rest of this evening my recipe will be this:
- Build code.
- Examine compile-time errors.
- Fix the first one or two erros shown.
- Go to step 1.
$ sfdk engine exec $ sb2 -t SailfishOS-devel-aarch64.default $ source `pwd`/obj-build-mer-qt-xr/rpm-shared.env $ make -j1 -C obj-build-mer-qt-xr/gfx/gl/Initially these partial builds were taking less than a second, with errors being hit almost immediately. Now after a couple of hours of fixing compile-time errors the builds are taking longer, maybe nearing ten seconds or so. That's how I'm judging success right now.
My guess is that it'll be a few days at least before I've got all of these errors resolved. I'll continue charting my progress with these diary entries of course, but they may be a little shorter than usual, since the last thing anyone wants to read about is this iterative build-check-fix churn.
At least it's quite fulfilling for me, gradually watching the errors seep away. It's mundane but fulfilling work, just a little laborious. Let's see how far I've got by the end of tomorrow.
If you'd like to read any of my other gecko diary entries, they're all available on my Gecko-dev Diary page.
28 Feb 2024 : Day 170 #
Today I woke up to discover a bad result. The build I started yesterday stalled about half way through. This does happen very occasionally, but honestly since I dropped down to just using a single process, it's barely happened at all. So that's more than a little annoying. Nevertheless I've woken up early today and it does at least mean that my first task of the day is an easy one: kick off the build once again.
So here goes... Once it's done, I'll give the changes I made yesterday a go to see whether they've fixed the segfault.
[...]
Finally the build completed, second time lucky it seems. So now SwapChain, SurfaceFactory and the SharedSurface back buffer should all be created respectively in this order. And this should also be the correct order. Let's find out.
Now there's still a crash, but it does at least get further than last time:
Checking the ESR 78 code, there is no mFrontBuffer variable, but there is an mFront which appears to be doing ostensibly the same thing. The mFront is only every used to switch the back buffer in to it, or to be accessed by EmbedLiteCompositorBridgeParent::GetPlatformImage(). In the latter case it's used, but not set.
So the arrangement isn't so dissimilar. Perhaps the main difference is that in ESR 78 there's no call to get the size of the front buffer as there is in ESR 91. Just as a reminder again: it's this size request that's causing the crash.
In ESR 78 the Swap() method is called from PublishFrame(), which is called from EmbedLiteCompositorBridgeParent::PresentOffscreenSurface(). It would be good to try to find out whether there's anything tying these together, to understand the sequencing, but the code is too convoluted for me to figure that out by hand.
So, instead, I'm going to look at the call to SwapChain::Size(). This is a call I added myself on top of the changes since ESR 91 and which doesn't have an immediately obvious equivalent call in ESR 78, so there must have been some reason why I added it.
Looking at the code in ESR 78 I can see that this is the reason I added this call:
After thinking long and hard about this I don't think it's going to be possible to fit everything that's needed into the current SwapChain structure. So tomorrow I'm going to start putting back in all of the pieces from ESR 78 that were ripped out of ESR 91. This should be a much more tractable exercise than trying to reconstruct the functionality from scratch. Once I've got a working renderer I can then take the diff and try to fit as much of what's needed as possible into the swap chain structure.
But I'm not going to be able to do that today as it's time for me to head to bed. I'll pick this up in the morning.
If you'd like to read any of my other gecko diary entries, they're all available on my Gecko-dev Diary page.
Comment
So here goes... Once it's done, I'll give the changes I made yesterday a go to see whether they've fixed the segfault.
[...]
Finally the build completed, second time lucky it seems. So now SwapChain, SurfaceFactory and the SharedSurface back buffer should all be created respectively in this order. And this should also be the correct order. Let's find out.
Now there's still a crash, but it does at least get further than last time:
$ harbour-webview
[D] unknown:0 - QML debugging is enabled. Only use this in a safe environment.
[D] main:30 - WebView Example
[D] main:44 - Using default start URL: "https://www.flypig.co.uk/search/"
[D] main:47 - Opening webview
[D] unknown:0 - Using Wayland-EGL
library "libutils.so" not found
[...]
Created LOG for EmbedLiteLayerManager
=============== Preparing offscreen rendering context ===============
CONSOLE message:
OpenGL compositor Initialized Succesfully.
Version: OpenGL ES 3.2 V@0502.0 (GIT@704ecd9a2b, Ib3f3e69395, 1609240670)
(Date:12/29/20)
Vendor: Qualcomm
Renderer: Adreno (TM) 619
FBO Texture Target: TEXTURE_2D
JSScript: ContextMenuHandler.js loaded
JSScript: SelectionPrototype.js loaded
JSScript: SelectionHandler.js loaded
JSScript: SelectAsyncHelper.js loaded
JSScript: FormAssistant.js loaded
JSScript: InputMethodHandler.js loaded
EmbedHelper init called
Available locales: en-US, fi, ru
Frame script: embedhelper.js loaded
Segmentation fault
That's without the debugger. To find out where precisely it's crashing we can execute it again, but this time with the debugger attached:
$ gdb harbour-webview
GNU gdb (GDB) Mer (8.2.1+git9)
[...]
(gdb) r
Starting program: /usr/bin/harbour-webview
[...]
Thread 36 "Compositor" received signal SIGSEGV, Segmentation fault.
[Switching to LWP 13568]
0x0000007ff110a378 in mozilla::gl::SwapChain::Size
(this=this@entry=0x7ed81ce090)
at ${PROJECT}/obj-build-mer-qt-xr/dist/include/mozilla/UniquePtr.h:290
290 ${PROJECT}/obj-build-mer-qt-xr/dist/include/mozilla/UniquePtr.h:
No such file or directory.
(gdb) bt
#0 0x0000007ff110a378 in mozilla::gl::SwapChain::Size
(this=this@entry=0x7ed81ce090)
at ${PROJECT}/obj-build-mer-qt-xr/dist/include/mozilla/UniquePtr.h:290
#1 0x0000007ff3667cc8 in mozilla::embedlite::EmbedLiteCompositorBridgeParent::
PresentOffscreenSurface (this=0x7fc4b41c20)
at mobile/sailfishos/embedthread/EmbedLiteCompositorBridgeParent.cpp:199
#2 0x0000007ff3680fe0 in mozilla::embedlite::nsWindow::PostRender
(this=0x7fc4c331e0, aContext=<optimized out>)
at mobile/sailfishos/embedshared/nsWindow.cpp:248
#3 0x0000007ff2a664fc in mozilla::widget::InProcessCompositorWidget::PostRender
(this=0x7fc4658990, aContext=0x7f17ae4848)
at widget/InProcessCompositorWidget.cpp:60
#4 0x0000007ff1291074 in mozilla::layers::LayerManagerComposite::Render
(this=this@entry=0x7ed81afa80, aInvalidRegion=..., aOpaqueRegion=...)
at ${PROJECT}/obj-build-mer-qt-xr/dist/include/mozilla/layers/
Compositor.h:575
#5 0x0000007ff12914f0 in mozilla::layers::LayerManagerComposite::
UpdateAndRender (this=this@entry=0x7ed81afa80)
at gfx/layers/composite/LayerManagerComposite.cpp:657
#6 0x0000007ff12918a0 in mozilla::layers::LayerManagerComposite::
EndTransaction (this=this@entry=0x7ed81afa80, aTimeStamp=...,
aFlags=aFlags@entry=mozilla::layers::LayerManager::END_DEFAULT)
at gfx/layers/composite/LayerManagerComposite.cpp:572
#7 0x0000007ff12d303c in mozilla::layers::CompositorBridgeParent::
CompositeToTarget (this=0x7fc4b41c20, aId=..., aTarget=0x0,
aRect=<optimized out>)
at ${PROJECT}/obj-build-mer-qt-xr/dist/include/mozilla/RefPtr.h:313
#8 0x0000007ff12b8784 in mozilla::layers::CompositorVsyncScheduler::Composite
(this=0x7fc4d01e30, aVsyncEvent=...)
at gfx/layers/ipc/CompositorVsyncScheduler.cpp:256
#9 0x0000007ff12b0bfc in mozilla::detail::RunnableMethodArguments
<mozilla::VsyncEvent>::applyImpl<mozilla::layers::CompositorVsyncScheduler,
void (mozilla::layers::CompositorVsyncScheduler::*)(mozilla::VsyncEvent
const&), StoreCopyPassByConstLRef<mozilla::VsyncEvent>, 0ul> (args=...,
m=<optimized out>, o=<optimized out>)
at ${PROJECT}/obj-build-mer-qt-xr/dist/include/nsThreadUtils.h:887
[...]
#21 0x0000007ff6a0489c in ?? () from /lib64/libc.so.6
(gdb) p mFrontBuffer
$1 = std::shared_ptr<mozilla::gl::SharedSurface> (empty) = {get() = 0x0}
(gdb)
Looking at the above, it seems that the back buffer isn't causing a crash any more. The problem now seems to be the front buffer. That's okay: that's progress! There are only two situations in which the front buffer gets set. First it happens if the SwapChainPresenter destructor is called. In this case the back buffer held by the presenter is moved into the front buffer, then the presenter's back buffer is set to null. Second it happens when the SwapChain::Swap() method is called. In this case the back buffer held by the presenter and the front buffer held by the swap chain are switched. In some sense, the Swap() method isn't really going to help us because if the front buffer is null beforehand, afterwards the back buffer will be null, which is also no good.Checking the ESR 78 code, there is no mFrontBuffer variable, but there is an mFront which appears to be doing ostensibly the same thing. The mFront is only every used to switch the back buffer in to it, or to be accessed by EmbedLiteCompositorBridgeParent::GetPlatformImage(). In the latter case it's used, but not set.
So the arrangement isn't so dissimilar. Perhaps the main difference is that in ESR 78 there's no call to get the size of the front buffer as there is in ESR 91. Just as a reminder again: it's this size request that's causing the crash.
In ESR 78 the Swap() method is called from PublishFrame(), which is called from EmbedLiteCompositorBridgeParent::PresentOffscreenSurface(). It would be good to try to find out whether there's anything tying these together, to understand the sequencing, but the code is too convoluted for me to figure that out by hand.
So, instead, I'm going to look at the call to SwapChain::Size(). This is a call I added myself on top of the changes since ESR 91 and which doesn't have an immediately obvious equivalent call in ESR 78, so there must have been some reason why I added it.
Looking at the code in ESR 78 I can see that this is the reason I added this call:
GLScreenBuffer* screen = context->Screen();
MOZ_ASSERT(screen);
if (screen->Size().IsEmpty() || !screen->PublishFrame(screen->Size())) {
NS_ERROR("Failed to publish context frame");
}
Compare that to the attempt I made to replicate the functionality in ESR 91:
// TODO: The switch from GLSCreenBuffer to SwapChain needs completing
// See: https://phabricator.services.mozilla.com/D75055
SwapChain* swapChain = context->GetSwapChain();
MOZ_ASSERT(swapChain);
const gfx::IntSize& size = swapChain->Size();
if (size.IsEmpty() || !swapChain->PublishFrame(size)) {
NS_ERROR("Failed to publish context frame");
}
The obvious question is, what is context->Screen() returning in ESR 78 and where is it created. Unfortunately the answer is complex. It's returning the following member of GLContext:
UniquePtr<GLScreenBuffer> mScreen;
[...]
GLScreenBuffer* Screen() const { return mScreen.get(); }
This gets created from a call to GLContext::InitOffscreen(), like this:
Delete all breakpoints? (y or n) y
(gdb) b CreateScreenBufferImpl
Breakpoint 7 at 0x7fb8e837d8: file gfx/gl/GLContext.cpp, line 2120.
(gdb) r
The program being debugged has been started already.
Start it from the beginning? (y or n) y
Starting program: /usr/bin/harbour-webview
[...]
Thread 36 "Compositor" hit Breakpoint 7, mozilla::gl::GLContext::
CreateScreenBufferImpl (this=this@entry=0x7eac109140, size=..., caps=...)
at gfx/gl/GLContext.cpp:2120
2120 const SurfaceCaps& caps) {
(gdb) bt
#0 mozilla::gl::GLContext::CreateScreenBufferImpl
(this=this@entry=0x7eac109140, size=..., caps=...)
at gfx/gl/GLContext.cpp:2120
#1 0x0000007fb8e838ec in mozilla::gl::GLContext::CreateScreenBuffer
(caps=..., size=..., this=0x7eac109140)
at gfx/gl/GLContext.h:3517
#2 mozilla::gl::GLContext::InitOffscreen (this=0x7eac109140, size=...,
caps=...)
at gfx/gl/GLContext.cpp:2578
#3 0x0000007fb8e83ac8 in mozilla::gl::GLContextProviderEGL::CreateOffscreen
(size=..., minCaps=..., flags=flags@entry=mozilla::gl::CreateContextFlags::
REQUIRE_COMPAT_PROFILE, out_failureId=out_failureId@entry=0x7fa50ed378)
at gfx/gl/GLContextProviderEGL.cpp:1443
#4 0x0000007fb8ee475c in mozilla::layers::CompositorOGL::CreateContext
(this=0x7eac003420)
at gfx/layers/opengl/CompositorOGL.cpp:250
#5 mozilla::layers::CompositorOGL::CreateContext (this=0x7eac003420)
at gfx/layers/opengl/CompositorOGL.cpp:223
#6 0x0000007fb8f053bc in mozilla::layers::CompositorOGL::Initialize
(this=0x7eac003420, out_failureReason=0x7fa50ed730)
at gfx/layers/opengl/CompositorOGL.cpp:374
#7 0x0000007fb8fdcf7c in mozilla::layers::CompositorBridgeParent::NewCompositor
(this=this@entry=0x7f8c99d3f0, aBackendHints=...)
at gfx/layers/ipc/CompositorBridgeParent.cpp:1534
#8 0x0000007fb8fe65e8 in mozilla::layers::CompositorBridgeParent::
InitializeLayerManager (this=this@entry=0x7f8c99d3f0, aBackendHints=...)
at gfx/layers/ipc/CompositorBridgeParent.cpp:1491
#9 0x0000007fb8fe6730 in mozilla::layers::CompositorBridgeParent::
AllocPLayerTransactionParent (this=this@entry=0x7f8c99d3f0,
aBackendHints=..., aId=...)
at gfx/layers/ipc/CompositorBridgeParent.cpp:1587
#10 0x0000007fbb2e31b4 in mozilla::embedlite::EmbedLiteCompositorBridgeParent::
AllocPLayerTransactionParent (this=0x7f8c99d3f0, aBackendHints=...,
aId=...)
at mobile/sailfishos/embedthread/EmbedLiteCompositorBridgeParent.cpp:77
#11 0x0000007fb88c13d0 in mozilla::layers::PCompositorBridgeParent::
OnMessageReceived (this=0x7f8c99d3f0, msg__=...)
at PCompositorBridgeParent.cpp:1391
[...]
#27 0x0000007fbe70d89c in ?? () from /lib64/libc.so.6
(gdb)
Recall that the call to CreateOffscreen() at frame 3 is now a call to CreateHeadless(). And it looks like that's where things really start to diverge.After thinking long and hard about this I don't think it's going to be possible to fit everything that's needed into the current SwapChain structure. So tomorrow I'm going to start putting back in all of the pieces from ESR 78 that were ripped out of ESR 91. This should be a much more tractable exercise than trying to reconstruct the functionality from scratch. Once I've got a working renderer I can then take the diff and try to fit as much of what's needed as possible into the swap chain structure.
But I'm not going to be able to do that today as it's time for me to head to bed. I'll pick this up in the morning.
If you'd like to read any of my other gecko diary entries, they're all available on my Gecko-dev Diary page.
27 Feb 2024 : Day 169 #
I've been trying to get the swap chain to initialise correctly over the last few days. This is part of the code that I made large changes to early on in this process, before the build would fully compile. I'm now having to simultaneously unravel the changes I made, while at the same time finally figuring out what they're supposed to be doing. It's quite a relief to finally get the chance to fix the mistakes I made in the past.
But the task right now is a little more prosaic. I'm just trying to get the thing to run without crashing. Getting the actual rendering working will be stage two of this process.
So I'm still trying to get the back buffer to be initialised before it's accessed. Sounds simple, but the code is a bit of web. We have a call to Resize() which is crashing and a call to PrepareOffscreen() which creates the swap chain. We need to create the swap chain and initialise the back buffer before the Resize() happens.
If we follow the backtraces back, the ordering problem seems to end up here:
One thing that seems worth trying is configuring the back buffer immediately after creating the swap chain. So I've given it a go by adding the call to ResizeScreenBuffer() in directly after the SwapChain constructor is called, like this:
As always the build is taking a very long, so we'll have to wait until the morning to find out how this has gone.
If you'd like to read any of my other gecko diary entries, they're all available on my Gecko-dev Diary page.
Comment
But the task right now is a little more prosaic. I'm just trying to get the thing to run without crashing. Getting the actual rendering working will be stage two of this process.
So I'm still trying to get the back buffer to be initialised before it's accessed. Sounds simple, but the code is a bit of web. We have a call to Resize() which is crashing and a call to PrepareOffscreen() which creates the swap chain. We need to create the swap chain and initialise the back buffer before the Resize() happens.
If we follow the backtraces back, the ordering problem seems to end up here:
PLayerTransactionParent*
EmbedLiteCompositorBridgeParent::AllocPLayerTransactionParent
(const nsTArray<LayersBackend>& aBackendHints, const LayersId& aId)
{
PLayerTransactionParent* p =
CompositorBridgeParent::AllocPLayerTransactionParent(aBackendHints, aId);
EmbedLiteWindowParent *parentWindow = EmbedLiteWindowParent::From(mWindowId);
if (parentWindow) {
parentWindow->GetListener()->CompositorCreated();
}
if (!StaticPrefs::embedlite_compositor_external_gl_context()) {
// Prepare Offscreen rendering context
PrepareOffscreen();
}
return p;
}
That's because the call stack for CreateContext(), which is where the SwapChain::Resize() gets called, includes CompositorBridgeParent::AllocPLayerTransactionParent(), whereas the SwapChain object is created in PrepareOffscreen(). As we can see, these happen in the wrong order.One thing that seems worth trying is configuring the back buffer immediately after creating the swap chain. So I've given it a go by adding the call to ResizeScreenBuffer() in directly after the SwapChain constructor is called, like this:
SwapChain* swapChain = context->GetSwapChain();
if (swapChain == nullptr) {
swapChain = new SwapChain();
new SwapChainPresenter(*swapChain);
context->mSwapChain.reset(swapChain);
bool success = context->ResizeScreenBuffer(mEGLSurfaceSize);
if (!success) {
NS_WARNING("Failed to create SwapChain back buffer");
}
}
When I execute the updated code, this call to resize the screen buffer now triggers a crash.
$ gdb harbour-webview
GNU gdb (GDB) Mer (8.2.1+git9)
[...]
=============== Preparing offscreen rendering context ===============
Thread 36 "Compositor" received signal SIGSEGV, Segmentation fault.
[Switching to LWP 16991]
mozilla::gl::SwapChain::Resize (this=0x7ed81ce090, size=...)
at gfx/gl/GLScreenBuffer.cpp:134
134 mFactory->CreateShared(size);
(gdb) bt
#0 mozilla::gl::SwapChain::Resize (this=0x7ed81ce090, size=...)
at gfx/gl/GLScreenBuffer.cpp:134
#1 0x0000007ff110dc14 in mozilla::gl::GLContext::ResizeScreenBuffer
(this=this@entry=0x7ed819ee40, size=...)
at ${PROJECT}/obj-build-mer-qt-xr/dist/include/mozilla/UniquePtr.h:290
#2 0x0000007ff366824c in mozilla::embedlite::EmbedLiteCompositorBridgeParent::
PrepareOffscreen (this=this@entry=0x7fc4bef570)
at mobile/sailfishos/embedthread/EmbedLiteCompositorBridgeParent.cpp:132
#3 0x0000007ff36682b8 in mozilla::embedlite::EmbedLiteCompositorBridgeParent::
AllocPLayerTransactionParent (this=0x7fc4bef570, aBackendHints=..., aId=...)
at mobile/sailfishos/embedthread/EmbedLiteCompositorBridgeParent.cpp:90
#4 0x0000007ff0c65ad0 in mozilla::layers::PCompositorBridgeParent::
OnMessageReceived (this=0x7fc4bef570, msg__=...)
at PCompositorBridgeParent.cpp:1285
[...]
#19 0x0000007ff6a0489c in ?? () from /lib64/libc.so.6
(gdb) p size.width
$2 = 1080
(gdb) p size.height
$3 = 2520
(gdb) p mFactory.mTuple.mFirstA
$5 = (mozilla::gl::SurfaceFactory *) 0x0
(gdb)
As we can see from the above value of mFactory.mTuple.mFirstA and the code below, the reason for the crash is that the SurfaceFactory needed to generate the surface hasn't yet been initialised. As before, it's all about the sequencing.
bool SwapChain::Resize(const gfx::IntSize& size) {
UniquePtr<SharedSurface> newBack =
mFactory->CreateShared(size);
if (!newBack) return false;
if (mPresenter->mBackBuffer) mPresenter->mBackBuffer->ProducerRelease();
mPresenter->mBackBuffer.reset(newBack.release());
mPresenter->mBackBuffer->ProducerAcquire();
return true;
}
It turns out, the factory is created before, but isn't set until afterwards:
if (context->IsOffscreen()) {
UniquePtr<SurfaceFactory> factory;
if (context->GetContextType() == GLContextType::EGL) {
// [Basic/OGL Layers, OMTC] WebGL layer init.
factory = SurfaceFactory_EGLImage::Create(*context);
} else {
// [Basic Layers, OMTC] WebGL layer init.
// Well, this *should* work...
factory = MakeUnique<SurfaceFactory_Basic>(*context);
}
SwapChain* swapChain = context->GetSwapChain();
if (swapChain == nullptr) {
swapChain = new SwapChain();
new SwapChainPresenter(*swapChain);
context->mSwapChain.reset(swapChain);
}
if (factory) {
swapChain->Morph(std::move(factory));
}
}
So I've rejigged things. Crucially though, although the factory should be reset independently of whether we're creating a new swap chain or not, we don't want the resize to happen except when it's a new swap chain. I've therefore had to create a new initSwapChain Boolean to capture whether this is a new swap chain or not. If it is, we can then perform the resize after the factory code has executed.
bool initSwapChain = false;
// TODO: The switch from GLSCreenBuffer to SwapChain needs completing
// See: https://phabricator.services.mozilla.com/D75055
if (context->IsOffscreen()) {
[...]
SwapChain* swapChain = context->GetSwapChain();
if (swapChain == nullptr) {
initSwapChain = true;
swapChain = new SwapChain();
new SwapChainPresenter(*swapChain);
context->mSwapChain.reset(swapChain);
}
if (factory) {
swapChain->Morph(std::move(factory));
}
if (initSwapChain) {
bool success = context->ResizeScreenBuffer(mEGLSurfaceSize);
if (!success) {
NS_WARNING("Failed to create SwapChain back buffer");
}
}
}
This seems worth a try, so I've set the build off running again and we'll see how it pans out when it's done.As always the build is taking a very long, so we'll have to wait until the morning to find out how this has gone.
If you'd like to read any of my other gecko diary entries, they're all available on my Gecko-dev Diary page.
26 Feb 2024 : Day 168 #
Overnight the build I started yesterday successfully finished. That, in itself, is a bit of a surprise (no stupid syntax errors in my code!). This morning I've copied over the packages and installed them, and now I'm on the train ready to debug.
I optimistically run the app without the debugger. The window appears again. There's no rendering, just a white screen, but there's also no immediate crash and no obvious errors in the debug output.
After running for around twenty seconds or so, the app then crashes.
That was without the debugger; I'd better try it with the debugger to find out why it's crashing.
As usual I'm attempting this debugging on the train. But my development phone has no Internet connectivity here. So perhaps it's waiting for a connection before creating the compositor? Maybe the connection fails after twenty seconds at which point the compositor is created and the library segfaults.
This seems plausible, even if it doesn't quite explain the peculiar nature of the debugging that followed, where I couldn't access any of the variables.
Let's assume this is the case, back up a bit, and try to capture some state before the crash happens. If the crash is causing memory corruption, that might explain the lack of accessible variables. And if that's the case, then catching execution before the memory gets messed up should allow us to get a clearer picture.
[...]
You'll be pleased to hear I made it off the train safely and with all my belongings. It was touch-and-go for a few seconds there though. I'm now travelling in the opposite direction on (I hope) the adjacent tracks. Time to return to that debugging.
I'm happy to discover, despite having literally pulled the plug on my phone mid-debug, that on reattaching the cable and restoring my gnu screen session, the debugger is still in exactly the same state that I left it. Linux is great!
And now we have a bit more luck again from the captured backtrace:
The train is now coming in to Cambridge. I'm not taking any chances this time and will be packing up with plenty of time to spare! Sadly that's going to have to be it for today, but I'll pick this up again tomorrow.
If you'd like to read any of my other gecko diary entries, they're all available on my Gecko-dev Diary page.
Comment
I optimistically run the app without the debugger. The window appears again. There's no rendering, just a white screen, but there's also no immediate crash and no obvious errors in the debug output.
After running for around twenty seconds or so, the app then crashes.
$ time harbour-webview
[D] unknown:0 - QML debugging is enabled. Only use this in a safe environment.
[D] main:30 - WebView Example
[D] main:44 - Using default start URL: "https://www.flypig.co.uk/search/"
[D] main:47 - Opening webview
[D] unknown:0 - Using Wayland-EGL
library "libutils.so" not found
[...]
JSComp: UserAgentOverrideHelper.js loaded
UserAgentOverrideHelper app-startup
CONSOLE message:
[JavaScript Error: "Unexpected event profile-after-change"
{file: "resource://gre/modules/URLQueryStrippingListService.jsm" line: 228}]
observe@resource://gre/modules/URLQueryStrippingListService.jsm:228:12
Created LOG for EmbedPrefs
Created LOG for EmbedLiteLayerManager
Command terminated by signal 11
real 0m 20.82s
user 0m 0.87s
sys 0m 0.23s
This is quite unexpected behaviour if I'm honest. Something is causing it to crash after a prolonged period ("prolonged" meaning from the perspective of computation, rather than from the perspective of the user).That was without the debugger; I'd better try it with the debugger to find out why it's crashing.
$ gdb harbour-webview
GNU gdb (GDB) Mer (8.2.1+git9)
[...]
(gdb) r
Starting program: /usr/bin/harbour-webview
[...]
Thread 37 "Compositor" received signal SIGSEGV, Segmentation fault.
[Switching to LWP 18684]
mozilla::gl::SwapChain::Resize (this=0x0, size=...)
at gfx/gl/GLScreenBuffer.cpp:134
134 mFactory->CreateShared(size);
(gdb) bt
#0 mozilla::gl::SwapChain::Resize (this=0x0, size=...)
at gfx/gl/GLScreenBuffer.cpp:134
#1 0x0000007ff110dc14 in mozilla::gl::GLContext::ResizeScreenBuffer
(this=this@entry=0x7edc19ee40, size=...)
at ${PROJECT}/obj-build-mer-qt-xr/dist/include/mozilla/UniquePtr.h:290
#2 0x0000007ff119b8d4 in mozilla::layers::CompositorOGL::CreateContext
(this=this@entry=0x7edc002f10)
at gfx/layers/opengl/CompositorOGL.cpp:264
#3 0x0000007ff11b0ea8 in mozilla::layers::CompositorOGL::Initialize
(this=0x7edc002f10, out_failureReason=0x7f17aac520)
at gfx/layers/opengl/CompositorOGL.cpp:394
#4 0x0000007ff12c68e8 in mozilla::layers::CompositorBridgeParent::NewCompositor
(this=this@entry=0x7fc4b7b450, aBackendHints=...)
at gfx/layers/ipc/CompositorBridgeParent.cpp:1493
#5 0x0000007ff12d1964 in mozilla::layers::CompositorBridgeParent::
InitializeLayerManager (this=this@entry=0x7fc4b7b450, aBackendHints=...)
at gfx/layers/ipc/CompositorBridgeParent.cpp:1436
#6 0x0000007ff12d1a94 in mozilla::layers::CompositorBridgeParent::
AllocPLayerTransactionParent (this=this@entry=0x7fc4b7b450,
aBackendHints=..., aId=...)
at gfx/layers/ipc/CompositorBridgeParent.cpp:1546
#7 0x0000007ff36682b8 in mozilla::embedlite::EmbedLiteCompositorBridgeParent::
AllocPLayerTransactionParent (this=0x7fc4b7b450, aBackendHints=...,
aId=...)
at mobile/sailfishos/embedthread/EmbedLiteCompositorBridgeParent.cpp:80
#8 0x0000007ff0c65ad0 in mozilla::layers::PCompositorBridgeParent::
OnMessageReceived (this=0x7fc4b7b450, msg__=...)
at PCompositorBridgeParent.cpp:1285
#9 0x0000007ff0ca9fe4 in mozilla::layers::PCompositorManagerParent::
OnMessageReceived (this=<optimized out>, msg__=...)
at ${PROJECT}/obj-build-mer-qt-xr/dist/include/mozilla/ipc/
ProtocolUtils.h:675
#10 0x0000007ff0bc985c in mozilla::ipc::MessageChannel::DispatchAsyncMessage
(this=this@entry=0x7fc4d82fb8, aProxy=aProxy@entry=0x7edc002aa0, aMsg=...)
at ${PROJECT}/obj-build-mer-qt-xr/dist/include/mozilla/ipc/
ProtocolUtils.h:675
[...]
#23 0x0000007ff6a0489c in ?? () from /lib64/libc.so.6
(gdb)
As before, it runs for around twenty seconds, then crashes. The line that's causing the crash is this one:
bool SwapChain::Resize(const gfx::IntSize& size) {
UniquePtr<SharedSurface> newBack =
mFactory->CreateShared(size);
[...]
}
And the reason isn't because mFactory is null, it's because this (meaning the SwapChain instance) is null. But when I try to access the memory to show that it's null using the debugger I start getting strange errors:
(gdb) p mFactory
Cannot access memory at address 0x8
(gdb) frame 1
#1 0x0000007ff110dc14 in mozilla::gl::GLContext::ResizeScreenBuffer
(this=this@entry=0x7edc19ee40, size=...)
at ${PROJECT}/obj-build-mer-qt-xr/dist/include/mozilla/UniquePtr.h:290
290 ${PROJECT}/obj-build-mer-qt-xr/dist/include/mozilla/UniquePtr.h:
No such file or directory.
(gdb) p mSwapChain
Cannot access memory at address 0x7edc19f838
(gdb) p this
$1 = (mozilla::gl::GLContext * const) 0x7edc19ee40
(gdb) frame 2
#2 0x0000007ff119b8d4 in mozilla::layers::CompositorOGL::CreateContext
(this=this@entry=0x7edc002f10)
at gfx/layers/opengl/CompositorOGL.cpp:264
264 bool success = context->ResizeScreenBuffer(mSurfaceSize);
(gdb) p context
$2 = {mRawPtr = 0x7edc19ee40}
(gdb) p context->mRawPtr
Attempt to take address of value not located in memory.
(gdb) p context->mRawPtr->mSwapChain
Attempt to take address of value not located in memory.
I wonder if this is being caused by a memory leak that quickly gets out of hand? Placing a breakpoint on GLContext::ResizeScreenBuffer()K shows that it's not due to repeated calls to this method: this gets called only once, at which point there's an immediate segfault.
(gdb) b GLContext::ResizeScreenBuffer
Breakpoint 1 at 0x7ff110dbdc: file gf
x/gl/GLContext.cpp, line 1885.
(gdb) r
The program being debugged has been started already.
Start it from the beginning? (y or n) y
Starting program: /usr/bin/harbour-webview
[...]
Thread 37 "Compositor" hit Breakpoint 1, mozilla::gl::GLContext::
ResizeScreenBuffer (this=this@entry=0x7ed419ee40, size=...)
at gfx/gl/GLContext.cpp:1885
1885 bool GLContext::ResizeScreenBuffer(const gfx::IntSize& size) {
(gdb) c
Continuing.
Thread 37 "Compositor" received signal SIGSEGV, Segmentation fault.
mozilla::gl::SwapChain::Resize (this=0x0, size=...)
at gfx/gl/GLScreenBuffer.cpp:134
134 mFactory->CreateShared(size);
(gdb)
I'm curious to know what's happening after twenty seconds that would cause this. Looking more carefully at the backtrace for the crash above, it's strange that an attempt is being made to create the compositor. Shouldn't that have already been created? I wonder if this delay is related to network connectivity.As usual I'm attempting this debugging on the train. But my development phone has no Internet connectivity here. So perhaps it's waiting for a connection before creating the compositor? Maybe the connection fails after twenty seconds at which point the compositor is created and the library segfaults.
This seems plausible, even if it doesn't quite explain the peculiar nature of the debugging that followed, where I couldn't access any of the variables.
Let's assume this is the case, back up a bit, and try to capture some state before the crash happens. If the crash is causing memory corruption, that might explain the lack of accessible variables. And if that's the case, then catching execution before the memory gets messed up should allow us to get a clearer picture.
(gdb) b CompositorOGL::CreateContext
Breakpoint 2 at 0x7ff119b764: file gfx/layers/opengl/CompositorOGL.cpp,
line 227.
(gdb) r
The program being debugged has been started already.
Start it from the beginning? (y or n) y
Starting program: /usr/bin/harbour-webview
[...]
We're coming in to London now, so time to pause and rapidly pack up my stuff before we pull in to the station![...]
You'll be pleased to hear I made it off the train safely and with all my belongings. It was touch-and-go for a few seconds there though. I'm now travelling in the opposite direction on (I hope) the adjacent tracks. Time to return to that debugging.
I'm happy to discover, despite having literally pulled the plug on my phone mid-debug, that on reattaching the cable and restoring my gnu screen session, the debugger is still in exactly the same state that I left it. Linux is great!
And now we have a bit more luck again from the captured backtrace:
Thread 37 "Compositor" hit Breakpoint 2, mozilla::layers::CompositorOGL::
CreateContext (this=this@entry=0x7edc002ed0)
at gfx/layers/opengl/CompositorOG
L.cpp:227
227 already_AddRefed<mozilla::gl::GLContext> CompositorOGL::CreateContext() {
(gdb) p context
$3 = <optimized out>
(gdb) p mSwapChain
No symbol "mSwapChain" in current context.
(gdb) p context
$4 = <optimized out>
(gdb) bt
#0 mozilla::layers::CompositorOGL::CreateContext (this=this@entry=0x7edc002ed0)
at gfx/layers/opengl/CompositorOG
L.cpp:227
#1 0x0000007ff11b0ea8 in mozilla::layers::CompositorOGL::Initialize
(this=0x7edc002ed0, out_failureReason=0x7f17a6b520)
at gfx/layers/opengl/CompositorOGL.cpp:394
#2 0x0000007ff12c68e8 in mozilla::layers::CompositorBridgeParent::NewCompositor
(this=this@entry=0x7fc4beb0e0, aBackendHints=...)
at gfx/layers/ipc/CompositorBridgeParent.cpp:1493
#3 0x0000007ff12d1964 in mozilla::layers::CompositorBridgeParent::
InitializeLayerManager (this=this@entry=0x7fc4beb0e0, aBackendHints=...)
at gfx/layers/ipc/CompositorBridgeParent.cpp:1436
#4 0x0000007ff12d1a94 in mozilla::layers::CompositorBridgeParent::
AllocPLayerTransactionParent (this=this@entry=0x7fc4beb0e0,
aBackendHints=..., aId=...)
at gfx/layers/ipc/CompositorBridgeParent.cpp:1546
#5 0x0000007ff36682b8 in mozilla::embedlite::EmbedLiteCompositorBridgeParent::
AllocPLayerTransactionParent (this=0x7fc4beb0e0, aBackendHints=..., aId=...)
at mobile/sailfishos/embedthread/EmbedLiteCompositorBridgeParent.cpp:80
#6 0x0000007ff0c65ad0 in mozilla::layers::PCompositorBridgeParent::
OnMessageReceived (this=0x7fc4beb0e0, msg__=...)
at PCompositorBridgeParent.cpp:1285
[...]
#21 0x0000007ff6a0489c in ?? () from /lib64/libc.so.6
(gdb) n
[New LWP 32378]
231 nsIWidget* widget = mWidget->RealWidget();
(gdb) n
[New LWP 32389]
[LWP 7850 exited]
232 void* widgetOpenGLContext =
(gdb) n
[New LWP 32476]
[LWP 32389 exited]
234 if (widgetOpenGLContext) {
(gdb) n
248 if (!context && gfxEnv::LayersPreferOffscreen()) {
(gdb) n
249 nsCString discardFailureId;
(gdb) n
250 context = GLContextProvider::CreateHeadless(
(gdb) n
252 if (!context->CreateOffscreenDefaultFb(mSurfaceSize)) {
(gdb) n
249 nsCString discardFailureId;
(gdb) n
257 if (!context) {
(gdb) n
264 bool success = context->ResizeScreenBuffer(mSurfaceSize);
(gdb) p context
$7 = {mRawPtr = 0x7edc19ee40}
(gdb) p context.mRawPtr
$8 = (mozilla::gl::GLContext *) 0x7edc19ee40
(gdb) p context.mRawPtr.mSwapChain
$9 = {
mTuple = {<mozilla::detail::CompactPairHelper<mozilla::gl::SwapChain*, mozilla::DefaultDelete<mozilla::gl::SwapChain>, (mozilla::detail::StorageType)1, (mozilla::detail::StorageType)0>> = {<mozilla::DefaultDelete<mozilla::gl::SwapChain>> = {<No data fields>}, mFirstA = 0x0}, <No data fields>}}
(gdb) p context.mRawPtr.mSwapChain.mTuple.mFirstA
$10 = (mozilla::gl::SwapChain *) 0x0
(gdb)
We can conclude that the SwapChain hasn't been created yet. Which means this new bit of code I added, which is the code that's crashing, is being called too early. That's not quite what I was expecting. Just to check I've added a breakpoint to EmbedLiteCompositorBridgeParent::PrepareOffscreen(), which is where the SwapChain is created. This is just to double-check the ordering.
(gdb) b EmbedLiteCompositorBridgeParent::PrepareOffscreen
Breakpoint 3 at 0x7ff366810c: file mobile/sailfishos/embedthread/EmbedLiteCompositorBridgeParent.cpp, line 104.
(gdb) r
The program being debugged has been started already.
Start it from the beginning? (y or n) y
Starting program: /usr/bin/harbour-webview
[...]
Thread 36 "Compositor" hit Breakpoint 2, mozilla::layers::CompositorOGL::
CreateContext (this=this@entry=0x7ed8002da0)
at gfx/layers/opengl/CompositorOGL.cpp:227
227 already_AddRefed<mozilla::gl::GLContext> CompositorOGL::
CreateContext() {
(gdb)
This confirms it: the CreateContext() call is happening before the PrepareOffscreen() call. I'll need to think about this again then.The train is now coming in to Cambridge. I'm not taking any chances this time and will be packing up with plenty of time to spare! Sadly that's going to have to be it for today, but I'll pick this up again tomorrow.
If you'd like to read any of my other gecko diary entries, they're all available on my Gecko-dev Diary page.
25 Feb 2024 : Day 167 #
It felt like I had to stop halfway through a thought yesterday. But sometimes tiredness gets the better of me, I can feel myself spiralling into incoherence and the only sensible thing to do is head to bed. Sometimes it's a slow descent while relaxing or reading a book; other times I reach the incoherent end of the spectrum before my mind has even caught up with the fact I'm heading there.
So let me try to regroup. What we learnt yesterday was that OffscreenSize() previously returned mScreen->Size() and mScreen was created in InitOffscreen(). This InitOffscreen() method no longer exists — it was removed in D75055 — but was originally called in GLContextProviderEGL::CreateOffscreen().
The GLContextProviderEGL::CreateOffscreen() method also no longer exists in the codebase, replaced as it was in D79390:
Looking at the difference between the previous code that was called in CreateOffscreen() and the new code being called in CreateHeadless() my heart sinks a bit. There's so much that's been removed. It's true that CreateOffscreen() did go on to call CreateHeadless() in ESR 78, but there's so much other initialisation code in ESR 78, I just can't believe we can safely throw it all away.
But I'm going to persevere down this road I've started on, gradually building things back up only where they're needed to get things working. Right now that still means fixing the crash when OffscreenSize() is called.
I've not quite reached the point where the two sides of this circle meet up and the correct position to create the mBackBuffer emerges, but I feel like this exploration is getting us closer.
It's time for work now, I'll pick this up later on today.
[...]
After thinking on this some more, I've come to the conclusion that the right place to set up the mBackBuffer variable is in, or near, the call to GLContextProviderEGL::CreateHeadless(). It's there that the mScreen object would have been created in ESR 78 and checking with the debugger shows that the ordering is appropriate: CreateHeadless() gets called before CompositeToDefaultTarget(), which is what we need.
So, after the calls in CompositorOGL::CreateContext() I've inserted the following code:
If you'd like to read any of my other gecko diary entries, they're all available on my Gecko-dev Diary page.
Comment
So let me try to regroup. What we learnt yesterday was that OffscreenSize() previously returned mScreen->Size() and mScreen was created in InitOffscreen(). This InitOffscreen() method no longer exists — it was removed in D75055 — but was originally called in GLContextProviderEGL::CreateOffscreen().
The GLContextProviderEGL::CreateOffscreen() method also no longer exists in the codebase, replaced as it was in D79390:
$ git log -1 -S "GLContextProviderEGL::CreateOffscreen" \
gecko-dev/gfx/gl/GLContextProviderEGL.cpp
commit 4232c2c466220d42223443bd5bd2f3c849123380
Author: Jeff Gilbert <jgilbert@mozilla.com>
Date: Mon Jun 15 18:26:12 2020 +0000
Bug 1632249 - Replace GLContextProvider::CreateOffscreen with
GLContext::CreateOffscreenDefaultFb. r=lsalzman
Differential Revision: https://phabricator.services.mozilla.com/D79390
Looking at the ESR 91 code and the diffs applied to them it's not immediately obvious to me where this was getting called from and what's replacing it now, but we can get a callstack for how that was being called using the debugger on ESR 78. Here's the (abridged) backtrace:
(gdb) delete break
Delete all breakpoints? (y or n) y
(gdb) b GLContextProviderEGL::CreateOffscreen Breakpoint 6 at 0x7fb8e839f0:
file gfx/gl/GLContextProviderEGL.cpp, line 1400.
(gdb) r
The program being debugged has been started already.
Start it from the beginning? (y or n) y
Starting program: /usr/bin/harbour-webview
[...]
Thread 36 "Compositor" hit Breakpoint 6, mozilla::gl::GLContextProviderEGL::
CreateOffscreen (size=..., minCaps=...,
flags=flags@entry=mozilla::gl::CreateContextFlags::REQUIRE_COMPAT_PROFILE,
out_failureId=out_failureId@entry=0x7fa516f378)
at gfx/gl/GLContextProviderEGL.cpp:1400
1400 CreateContextFlags flags, nsACString* const out_failureId) {
(gdb) bt
#0 mozilla::gl::GLContextProviderEGL::CreateOffscreen (size=..., minCaps=..., flags=flags@entry=mozilla::gl::CreateContextFlags::REQUIRE_COMPAT_PROFILE,
out_failureId=out_failureId@entry=0x7fa516f378)
at gfx/gl/GLContextProviderEGL.cpp:1400
#1 0x0000007fb8ee475c in mozilla::layers::CompositorOGL::CreateContext
(this=0x7eac003420)
at gfx/layers/opengl/CompositorOGL.cpp:250
#2 mozilla::layers::CompositorOGL::CreateContext (this=0x7eac003420)
at gfx/layers/opengl/CompositorOGL.cpp:223
#3 0x0000007fb8f053bc in mozilla::layers::CompositorOGL::Initialize
(this=0x7eac003420, out_failureReason=0x7fa516f730)
at gfx/layers/opengl/CompositorOGL.cpp:374
#4 0x0000007fb8fdcf7c in mozilla::layers::CompositorBridgeParent::NewCompositor
(this=this@entry=0x7f8c99dc60, aBackendHints=...)
at gfx/layers/ipc/CompositorBridgeParent.cpp:1534
#5 0x0000007fb8fe65e8 in mozilla::layers::CompositorBridgeParent::
InitializeLayerManager (this=this@entry=0x7f8c99dc60, aBackendHints=...)
at gfx/layers/ipc/CompositorBridgeParent.cpp:1491
#6 0x0000007fb8fe6730 in mozilla::layers::CompositorBridgeParent::
AllocPLayerTransactionParent (this=this@entry=0x7f8c99dc60,
aBackendHints=..., aId=...)
at gfx/layers/ipc/CompositorBridgeParent.cpp:1587
#7 0x0000007fbb2e31b4 in mozilla::embedlite::EmbedLiteCompositorBridgeParent::
AllocPLayerTransactionParent (this=0x7f8c99dc60, aBackendHints=...,
aId=...) at mobile/sailfishos/embedthread/EmbedLiteCompositorBridgeParent.cpp:77
#8 0x0000007fb88c13d0 in mozilla::layers::PCompositorBridgeParent::
OnMessageReceived (this=0x7f8c99dc60, msg__=...)
at PCompositorBridgeParent.cpp:1391
#9 0x0000007fb88f86ac in mozilla::layers::PCompositorManagerParent::
OnMessageReceived (this=<optimized out>, msg__=...)
at obj-build-mer-qt-xr/dist/include/mozilla/ipc/ProtocolUtils.h:866
[...]
#24 0x0000007fbe70d89c in ?? () from /lib64/libc.so.6
(gdb)
So examining the code at frame 1, we see that what was a call to CreateOffscreen():
// Allow to create offscreen GL context for main Layer Manager
if (!context && gfxEnv::LayersPreferOffscreen()) {
SurfaceCaps caps = SurfaceCaps::ForRGB();
caps.preserve = false;
caps.bpp16 = gfxVars::OffscreenFormat() == SurfaceFormat::R5G6B5_UINT16;
nsCString discardFailureId;
context = GLContextProvider::CreateOffscreen(
mSurfaceSize, caps, CreateContextFlags::REQUIRE_COMPAT_PROFILE,
&discardFailureId);
}
Is now a call to CreateHeadless():
// Allow to create offscreen GL context for main Layer Manager
if (!context && gfxEnv::LayersPreferOffscreen()) {
nsCString discardFailureId;
context = GLContextProvider::CreateHeadless(
{CreateContextFlags::REQUIRE_COMPAT_PROFILE}, &discardFailureId);
if (!context->CreateOffscreenDefaultFb(mSurfaceSize)) {
context = nullptr;
}
}
Whether we're on ESR 78 or ESR 91, this is all happening inside CompositorOGL::CreateContext().Looking at the difference between the previous code that was called in CreateOffscreen() and the new code being called in CreateHeadless() my heart sinks a bit. There's so much that's been removed. It's true that CreateOffscreen() did go on to call CreateHeadless() in ESR 78, but there's so much other initialisation code in ESR 78, I just can't believe we can safely throw it all away.
But I'm going to persevere down this road I've started on, gradually building things back up only where they're needed to get things working. Right now that still means fixing the crash when OffscreenSize() is called.
I've not quite reached the point where the two sides of this circle meet up and the correct position to create the mBackBuffer emerges, but I feel like this exploration is getting us closer.
It's time for work now, I'll pick this up later on today.
[...]
After thinking on this some more, I've come to the conclusion that the right place to set up the mBackBuffer variable is in, or near, the call to GLContextProviderEGL::CreateHeadless(). It's there that the mScreen object would have been created in ESR 78 and checking with the debugger shows that the ordering is appropriate: CreateHeadless() gets called before CompositeToDefaultTarget(), which is what we need.
(gdb) delete break
(gdb) b EmbedLiteCompositorBridgeParent::CompositeToDefaultTarget
Breakpoint 3 at 0x7ff3667880: EmbedLiteCompositorBridgeParent::
CompositeToDefaultTarget. (2 locations)
(gdb) b GLContextProviderEGL::CreateHeadless
Breakpoint 4 at 0x7ff1133740: file gfx/gl/GLContextProviderEGL.cpp, line 1245.
(gdb) r
The program being debugged has been started already.
Start it from the beginning? (y or n) y
Starting program: /usr/bin/harbour-webview
[...]
Thread 36 "Compositor" hit Breakpoint 4, mozilla::gl::GLContextProviderEGL::
CreateHeadless (desc=..., out_failureId=out_failureId@entry=0x7f1faad1c8)
at gfx/gl/GLContextProviderEGL.cpp:1245
1245 const GLContextCreateDesc& desc, nsACString* const out_failureId) {
(gdb) bt
#0 mozilla::gl::GLContextProviderEGL::CreateHeadless (desc=...,
out_failureId=out_failureId@entry=0x7f1faad1c8)
at gfx/gl/GLContextProviderEGL.cpp:1245
#1 0x0000007ff119b81c in mozilla::layers::CompositorOGL::CreateContext
(this=this@entry=0x7ee0002f50)
at gfx/layers/opengl/CompositorOGL.cpp:250
#2 0x0000007ff11b0e24 in mozilla::layers::CompositorOGL::Initialize
(this=0x7ee0002f50, out_failureReason=0x7f1faad520)
at gfx/layers/opengl/CompositorOGL.cpp:389
#3 0x0000007ff12c6864 in mozilla::layers::CompositorBridgeParent::
NewCompositor (this=this@entry=0x7fc4b3d260, aBackendHints=...)
at gfx/layers/ipc/CompositorBridgeParent.cpp:1493
#4 0x0000007ff12d18e0 in mozilla::layers::CompositorBridgeParent::
InitializeLayerManager (this=this@entry=0x7fc4b3d260, aBackendHints=...)
at gfx/layers/ipc/CompositorBridgeParent.cpp:1436
#5 0x0000007ff12d1a10 in mozilla::layers::CompositorBridgeParent::
AllocPLayerTransactionParent (this=this@entry=0x7fc4b3d260,
aBackendHints=..., aId=...)
at gfx/layers/ipc/CompositorBridgeParent.cpp:1546
#6 0x0000007ff3668238 in mozilla::embedlite::EmbedLiteCompositorBridgeParent::
AllocPLayerTransactionParent (this=0x7fc4b3d260, aBackendHints=..., aId=...)
at mobile/sailfishos/embedthread/EmbedLiteCompositorBridgeParent.cpp:80
#7 0x0000007ff0c65ad0 in mozilla::layers::PCompositorBridgeParent::
OnMessageReceived (this=0x7fc4b3d260, msg__=...)
at PCompositorBridgeParent.cpp:1285
#8 0x0000007ff0ca9fe4 in mozilla::layers::PCompositorManagerParent::
OnMessageReceived (this=<optimized out>, msg__=...)
at ${PROJECT}/obj-build-mer-qt-xr/dist/include/mozilla/ipc/
ProtocolUtils.h:675
[...]
#22 0x0000007ff6a0489c in ?? () from /lib64/libc.so.6
(gdb) c
Continuing.
[New LWP 2694]
=============== Preparing offscreen rendering context ===============
[New LWP 2695]
Thread 36 "Compositor" hit Breakpoint 3, non-virtual thunk to mozilla::embedlite::EmbedLiteCompositorBridgeParent::CompositeToDefaultTarget
(mozilla::layers::BaseTransactionId<mozilla::VsyncIdType>) ()
at mobile/sailfishos/embedthread/EmbedLiteCompositorBridgeParent.h:58
58 virtual void CompositeToDefaultTarget(VsyncId aId) override;
(gdb) bt
#0 non-virtual thunk to mozilla::embedlite::EmbedLiteCompositorBridgeParent::
CompositeToDefaultTarget(mozilla::layers::BaseTransactionId
<mozilla::VsyncIdType>) ()
at mobile/sailfishos/embedthread/EmbedLiteCompositorBridgeParent.h:58
#1 0x0000007ff12b808c in mozilla::layers::CompositorVsyncScheduler::
ForceComposeToTarget (this=0x7fc4d0df60, aTarget=aTarget@entry=0x0,
aRect=aRect@entry=0x0)
at ${PROJECT}/obj-build-mer-qt-xr/dist/include/mozilla/layers/
LayersTypes.h:82
#2 0x0000007ff12b80e8 in mozilla::layers::CompositorBridgeParent::
ResumeComposition (this=this@entry=0x7fc4b3d260)
at ${PROJECT}/obj-build-mer-qt-xr/dist/include/mozilla/RefPtr.h:313
#3 0x0000007ff12b8174 in mozilla::layers::CompositorBridgeParent::
ResumeCompositionAndResize (this=0x7fc4b3d260, x=<optimized out>,
y=<optimized out>, width=<optimized out>, height=<optimized out>)
at gfx/layers/ipc/CompositorBridgeParent.cpp:794
#4 0x0000007ff12b0d10 in mozilla::detail::RunnableMethodArguments<int,
int, int, int>::applyImpl<mozilla::layers::CompositorBridgeParent, void
(mozilla::layers::CompositorBridgeParent::*)(int, int, int, int),
StoreCopyPassByConstLRef<int>, StoreCopyPassByConstLRef<int>,
StoreCopyPassByConstLRef<int>, StoreCopyPassByConstLRef<int>, 0ul, 1ul, 2ul,
3ul> (args=..., m=<optimized out>, o=<optimized out>)
at ${PROJECT}/obj-build-mer-qt-xr/dist/include/nsThreadUtils.h:1151
[...]
#16 0x0000007ff6a0489c in ?? () from /lib64/libc.so.6
(gdb)
The only problem is that the SwapChain object is held by GLContext whereas CreateHeadless() is part of GLContextProviderEGL(), which has access to very little, let alone the SwapChain. The good news is GLContextProviderEGL does have access to GLContext. The structure is something like this:
class GLContext
public:
UniquePtr<SwapChain> mSwapChain;
}
class GLContextEGL final : public GLContext {
}
void EmbedLiteCompositorBridgeParent::PrepareOffscreen() {
const CompositorBridgeParent::LayerTreeState* state =
CompositorBridgeParent::GetIndirectShadowTree(RootLayerTreeId());
GLContext* context = static_cast<CompositorOGL*>(state->mLayerManager->
GetCompositor())->gl();
swapChain = new SwapChain();
new SwapChainPresenter(*swapChain);
context->mSwapChain.reset(swapChain);
}
already_AddRefed<mozilla::gl::GLContext> CompositorOGL::CreateContext() {
context = GLContextProvider::CreateHeadless({CreateContextFlags::
REQUIRE_COMPAT_PROFILE}, &discardFailureId);
// Here we have access to context->mSwapChain;
}
Based on this, it looks like adding code in to CompositorOGL::CreateContext(), after the call to GLContextProvider::CreateHeadless() (which is actually a call to GLContextProviderEGL::CreateHeadless() might be the right place to put the code to create mBackBuffer.So, after the calls in CompositorOGL::CreateContext() I've inserted the following code:
bool success = context->ResizeScreenBuffer(mSurfaceSize);
if (!success) {
NS_WARNING("Failed to create SwapChain back buffer");
}
This will make for my first attempt to fix this. I've set the build running and we'll have to find out for sure whether that's improved the situation tomorrow.If you'd like to read any of my other gecko diary entries, they're all available on my Gecko-dev Diary page.
24 Feb 2024 : Day 166 #
We're back on to looking at the SwapChain code, part of the offscreen rendering pipeline, today. This is all for the purpose of getting the WebView working. Currently opening a WebView will cause the parent app to crash; it's clearly something that needs fixing before ESR 91 will be acceptable for daily use.
We managed to persuade the SwapChain object to be created by force-disabling the embedlite.compositor.external_gl_context static preference. Now we've found that the mBackBuffer is null which also results in a segfault. The mBackBuffer variable is a member of SwapChainPresenter *mPresenter, which is itself contained within the SwapChain class.
Looking through the code in GLScreenBuffer.cpp there are currently only two ways for the mBackBuffer variable to be initialised. Either it gets swapped in as a result of a call to SwapBackBuffer() like this:
It's now time for my work day, so answers to these questions will have to wait until tonight. Still, this is progress.
[...]
To try to get a handle on where this mBackBuffer ought to be created, I thought it might help to figure out some sequencing. Here's how things seem to be happening:
Having re-reviewed the original D75055 changeset that introduced the SwapChain, along with the history of the related files that aren't part of the changeset, I'm beginning to get a better picture.
For example, the code that makes the failing call to OffscreenSize() was added by me earlier on in this process:
Prior to all these changes the OffscreenSize() implementation looked like this:
If you'd like to read any of my other gecko diary entries, they're all available on my Gecko-dev Diary page.
Comment
We managed to persuade the SwapChain object to be created by force-disabling the embedlite.compositor.external_gl_context static preference. Now we've found that the mBackBuffer is null which also results in a segfault. The mBackBuffer variable is a member of SwapChainPresenter *mPresenter, which is itself contained within the SwapChain class.
Looking through the code in GLScreenBuffer.cpp there are currently only two ways for the mBackBuffer variable to be initialised. Either it gets swapped in as a result of a call to SwapBackBuffer() like this:
std::shared_ptr<SharedSurface> SwapChainPresenter::SwapBackBuffer(
std::shared_ptr<SharedSurface> back) {
[...]
auto old = mBackBuffer;
mBackBuffer = back;
if (mBackBuffer) {
mBackBuffer->WaitForBufferOwnership();
mBackBuffer->ProducerAcquire();
mBackBuffer->LockProd();
}
return old;
}
Or it gets created as a result of a call to the Resize() method like this:
bool SwapChain::Resize(const gfx::IntSize& size) {
UniquePtr<SharedSurface> newBack =
mFactory->CreateShared(size);
if (!newBack) return false;
if (mPresenter->mBackBuffer) mPresenter->mBackBuffer->ProducerRelease();
mPresenter->mBackBuffer.reset(newBack.release());
mPresenter->mBackBuffer->ProducerAcquire();
return true;
}
We should check whether either of these are being called. It is possible that SwapBackBuffer() is being called but with an empty back parameter, or that the CreateShared() call in Resize() is failing. Either of these would leave us in our current situation. However just as likely is that neither of these are being called and there's not even an attempt being made to initialise mBackBuffer. We need to know!
(gdb) delete break
(gdb) b SwapChainPresenter::SwapBackBuffer
Breakpoint 1 at 0x7ff1109c14: file gfx/gl/GLScreenBuffer.cpp, line 82.
(gdb) b SwapChain::Resize
Breakpoint 2 at 0x7ff110a398: file gfx/gl/GLScreenBuffer.cpp, line 132.
(gdb) r
The program being debugged has been started already.
Start it from the beginning? (y or n) y
Starting program: /usr/bin/harbour-webview
[...]
Thread 37 "Compositor" received signal SIGSEGV, Segmentation fault.
[Switching to LWP 4362]
0x0000007ff110a38c in mozilla::gl::SwapChain::OffscreenSize
(this=<optimized out>)
at ${PROJECT}/obj-build-mer-qt-xr/dist/include/mozilla/UniquePtr.h:290
290 ${PROJECT}/obj-build-mer-qt-xr/dist/include/mozilla/UniquePtr.h:
No such file or directory.
(gdb) frame 1
#1 0x0000007ff3667930 in mozilla::embedlite::EmbedLiteCompositorBridgeParent::
CompositeToDefaultTarget (this=0x7fc4b3f070, aId=...)
at ${PROJECT}/obj-build-mer-qt-xr/dist/include/mozilla/UniquePtr.h:290
290 ${PROJECT}/obj-build-mer-qt-xr/dist/include/mozilla/UniquePtr.h:
No such file or directory.
(gdb) p context->mSwapChain.mTuple.mFirstA->mPresenter->mBackBuffer
$1 = std::shared_ptr<mozilla::gl::SharedSurface> (empty) = {get() = 0x0}
(gdb)
No breakpoint hits before the segfault, so neither of those methods are being called. Armed with this knowledge we must now turn our thoughts to solutions, and there are multiple potential solutions we could choose: guard against a null access in SwapChain::OffscreenSize(); ensure mBackBuffer is created at the same time as the mPresenter that contains it; find out if the process flow should be calling one of the swap or resize methods prior to this call.It's now time for my work day, so answers to these questions will have to wait until tonight. Still, this is progress.
[...]
To try to get a handle on where this mBackBuffer ought to be created, I thought it might help to figure out some sequencing. Here's how things seem to be happening:
- The SwapChain is created in EmbedLiteCompositorBridgeParent::PrepareOffscreen().
- The SwapChainPresenter() is created immediately afterwards.
- In EmbedLiteCompositorBridgeParent::CompositeToDefaultTarget() the SwapChain::OffscreenSize() method is called, causing the crash.
- Immediately after this SwapChain::Resize() is called, which if done earlier, would prevent the crash.
if (context->GetSwapChain()->OffscreenSize() != mEGLSurfaceSize
&& !context->GetSwapChain()->Resize(mEGLSurfaceSize)) {
return;
}
It's also worth noting, I think, that SwapChain::Acquire() calls SwapBackBuffer() with a non-null back buffer parameter, which if called early enough would also prevent the code from crashing subsequently when OffscreenSize() is read.Having re-reviewed the original D75055 changeset that introduced the SwapChain, along with the history of the related files that aren't part of the changeset, I'm beginning to get a better picture.
For example, the code that makes the failing call to OffscreenSize() was added by me earlier on in this process:
$ git blame \
embedding/embedlite/embedthread/EmbedLiteCompositorBridgeParent.cpp \
-L 153,156
^01b1a0352034 embedthread/EmbedLiteCompositorBridgeParent.cpp
(Raine Makelainen 2020-07-24 16:25:17 +0300 153)
MutexAutoLock lock(mRenderMutex);
d59d44a5bccaf embedding/embedlite/embedthread/EmbedLiteCompositorBridgeParent.cpp
(David Llewellyn-Jones 2023-09-04 09:03:49 +0100 154)
if (context->GetSwapChain()->OffscreenSize() != mEGLSurfaceSize
d59d44a5bccaf embedding/embedlite/embedthread/EmbedLiteCompositorBridgeParent.cpp
(David Llewellyn-Jones 2023-09-04 09:03:49 +0100 155)
&& !context->GetSwapChain()->Resize(mEGLSurfaceSize)) {
^01b1a0352034 embedthread/EmbedLiteCompositorBridgeParent.cpp
(Raine Makelainen 2020-07-24 16:25:17 +0300 156)
return;
Prior to this the logic was somewhat different:
$ git diff d59d44a5bccaf~ d59d44a5bccaf
@@ -153,7 +157,8 @@ EmbedLiteCompositorBridgeParent::CompositeToDefaultTarget
(VsyncId aId)
[...]
if (context->IsOffscreen()) {
MutexAutoLock lock(mRenderMutex);
- if (context->OffscreenSize() != mEGLSurfaceSize && !context->
ResizeOffscreen(mEGLSurfaceSize)) {
+ if (context->GetSwapChain()->OffscreenSize() != mEGLSurfaceSize
+ && !context->GetSwapChain()->Resize(mEGLSurfaceSize)) {
return;
}
}
The code for returning the offscreen size was also added by me slightly earlier on the same day:
$ git blame gfx/gl/GLScreenBuffer.cpp -L 128,130
f536dbf9f6f8a (David Llewellyn-Jones 2023-09-04 08:52:00 +0100 128)
const gfx::IntSize& SwapChain::OffscreenSize() const {
f536dbf9f6f8a (David Llewellyn-Jones 2023-09-04 08:52:00 +0100 129)
return mPresenter->mBackBuffer->mFb->mSize;
f536dbf9f6f8a (David Llewellyn-Jones 2023-09-04 08:52:00 +0100 130)
}
And as you can see, a lot of code was changed in this commit, especially this code:
diff --git a/gfx/gl/GLScreenBuffer.cpp b/gfx/gl/GLScreenBuffer.cpp
index 0398dd7dc6a2..e71263068777 100644
--- a/gfx/gl/GLScreenBuffer.cpp
+++ b/gfx/gl/GLScreenBuffer.cpp
@@ -116,4 +116,38 @@ SwapChain::~SwapChain() {
}
}
[...]
+
+const gfx::IntSize& SwapChain::OffscreenSize() const {
+ return mPresenter->mBackBuffer->mFb->mSize;
+}
+
[...]
So much — if not all — of this faulty code is down to me. Back then I was coding without being able to test, so this isn't a huge surprise. But it does also mean I have more scope to control the situation and make changes to the implementation.Prior to all these changes the OffscreenSize() implementation looked like this:
const gfx::IntSize& GLContext::OffscreenSize() const {
MOZ_ASSERT(IsOffscreen());
return mScreen->Size();
}
The mScreen being used here is analogous to the mBackBuffer and is created in this method:
bool GLContext::CreateScreenBufferImpl(const IntSize& size,
const SurfaceCaps& caps) {
UniquePtr<GLScreenBuffer> newScreen =
GLScreenBuffer::Create(this, size, caps);
if (!newScreen) return false;
if (!newScreen->Resize(size)) {
return false;
}
// This will rebind to 0 (Screen) if needed when
// it falls out of scope.
ScopedBindFramebuffer autoFB(this);
mScreen = std::move(newScreen);
return true;
}
And the mScreen is created in a method called InitOffscreen().
bool GLContext::InitOffscreen(const gfx::IntSize& size,
const SurfaceCaps& caps) {
if (!CreateScreenBuffer(size, caps)) return false;
[...]
Finally InitOffScreen() is being called in GLContextProviderCGL::CreateOffscreen():
already_AddRefed<GLContext> GLContextProviderCGL::CreateOffscreen(
const IntSize& size,
const SurfaceCaps& minCaps,
CreateContextFlags flags,
nsACString* const out_failureId) {
RefPtr<GLContext> gl = CreateHeadless(flags, out_failureId);
if (!gl) {
return nullptr;
}
if (!gl->InitOffscreen(size, minCaps)) {
*out_failureId = NS_LITERAL_CSTRING("FEATURE_FAILURE_CGL_INIT");
return nullptr;
}
return gl.forget();
}
It feels like we've nearly come full circle, which would be good because then that would be enough to make a clear decision about how to address this. But it's already late here now and time for me to call it a night, so that decision will have to wait for tomorrow.If you'd like to read any of my other gecko diary entries, they're all available on my Gecko-dev Diary page.
23 Feb 2024 : Day 165 #
Today I'm following up the tasks I set out for myself yesterday:
As you may recall the WebView is crashing because the SwapChain returned from the context is null. It should be created somewhere, but it's not yet clear where. So the first question is whether there's some code to create it that isn't being called, or whether there's nowhere in the code currently set to create it.
A quick grep of the code throws up a few potential places where it could be being created:
This preference isn't being set for the WebView, although it is set for the browser:
So as well as trying out this change I'm also going to ask for some expert advice from the Jolla team about this, just in case it's actually important that I don't set this to false and that the real issue is somewhere else.
But, it's the start of my work day, so that will all have to wait until later.
[...]
I've added in the change to set the embedlite.compositor.external_gl_context static preference to false:
It's clear what the next step is: find out why the mBackBuffer value isn't being set and, if necessary, set it. But that's a task that'll have to wait until tomorrow.
If you'd like to read any of my other gecko diary entries, they're all available on my Gecko-dev Diary page.
Comment
Tomorrow I'll do a sweep of the other code to check whether any attempt is being made to initialise it somewhere else. If not I'll add in some initialisation code to see what happens.
As you may recall the WebView is crashing because the SwapChain returned from the context is null. It should be created somewhere, but it's not yet clear where. So the first question is whether there's some code to create it that isn't being called, or whether there's nowhere in the code currently set to create it.
A quick grep of the code throws up a few potential places where it could be being created:
$ grep -rIn "new SwapChain(" *
embedding/embedlite/embedthread/EmbedLiteCompositorBridgeParent.cpp:128:
swapChain = new SwapChain();
gecko-dev/dom/webgpu/CanvasContext.cpp:95:
mSwapChain = new SwapChain(aDesc, extent, mExternalImageId, format);
gecko-dev/dom/webgpu/CanvasContext.cpp:139:
mSwapChain = new SwapChain(desc, extent, mExternalImageId, gfxFormat);
The most promising of these is going to be the code in EmbedLiteCompositorBridgeParent.cpp since that's EmbedLite-specific code. In fact, probably something I added myself during the ESR 91 changes (since SwapChain is new to ESR 91):
$ git blame \
embedding/embedlite/embedthread/EmbedLiteCompositorBridgeParent.cpp \
-L 128,128
d59d44a5bccaf (David Llewellyn-Jones 2023-09-04 09:03:49 +0100 128)
swapChain = new SwapChain();
Confirmed. I even added a note to myself at the time to explain that this might need fixing:
$ git blame \\
embedding/embedlite/embedthread/EmbedLiteCompositorBridgeParent.cpp \\
-L 113,114
d59d44a5bccaf (David Llewellyn-Jones 2023-09-04 09:03:49 +0100 113)
// TODO: The switch from GLSCreenBuffer to SwapChain needs completing
d59d44a5bccaf (David Llewellyn-Jones 2023-09-04 09:03:49 +0100 114)
// See: https://phabricator.services.mozilla.com/D75055
Here's the relevant bit of code:
void
EmbedLiteCompositorBridgeParent::PrepareOffscreen()
{
fprintf(stderr,
"=============== Preparing offscreen rendering context ===============\n");
const CompositorBridgeParent::LayerTreeState* state =
CompositorBridgeParent::GetIndirectShadowTree(RootLayerTreeId());
NS_ENSURE_TRUE(state && state->mLayerManager, );
GLContext* context = static_cast<CompositorOGL*>(state->mLayerManager->
GetCompositor())->gl();
NS_ENSURE_TRUE(context, );
// TODO: The switch from GLSCreenBuffer to SwapChain needs completing
// See: https://phabricator.services.mozilla.com/D75055
if (context->IsOffscreen()) {
UniquePtr<SurfaceFactory> factory;
if (context->GetContextType() == GLContextType::EGL) {
// [Basic/OGL Layers, OMTC] WebGL layer init.
factory = SurfaceFactory_EGLImage::Create(*context);
} else {
// [Basic Layers, OMTC] WebGL layer init.
// Well, this *should* work...
factory = MakeUnique<SurfaceFactory_Basic>(*context);
}
SwapChain* swapChain = context->GetSwapChain();
if (swapChain == nullptr) {
swapChain = new SwapChain();
new SwapChainPresenter(*swapChain);
context->mSwapChain.reset(swapChain);
}
if (factory) {
swapChain->Morph(std::move(factory));
}
}
}
So either this method isn't being run, or context->IsOffscreen() must be set to false. Let's find out. Conveniently I can once again continue with my debugging session from yesterday:
(gdb) delete break
Delete all breakpoints? (y or n) y
(gdb) b EmbedLiteCompositorBridgeParent::PrepareOffscreen
Breakpoint 10 at 0x7ff366808c: file mobile/sailfishos/embedthread/
EmbedLiteCompositorBridgeParent.cpp, line 104.
(gdb) r
The program being debugged has been started already.
Start it from the beginning? (y or n) y
Starting program: /usr/bin/harbour-webview
[...]
Thread 36 "Compositor" received signal SIGSEGV, Segmentation fault.
[Switching to LWP 14342]
mozilla::gl::SwapChain::OffscreenSize (this=0x0)
at gfx/gl/GLScreenBuffer.cpp:129
129 return mPresenter->mBackBuffer->mFb->mSize;
(gdb) bt
#0 mozilla::gl::SwapChain::OffscreenSize (this=0x0)
at gfx/gl/GLScreenBuffer.cpp:129
#1 0x0000007ff3667930 in mozilla::embedlite::EmbedLiteCompositorBridgeParent::
CompositeToDefaultTarget (this=0x7fc4aebc90, aId=...)
at ${PROJECT}/obj-build-mer-qt-xr/dist/include/mozilla/UniquePtr.h:290
#2 0x0000007ff12b808c in mozilla::layers::CompositorVsyncScheduler::
ForceComposeToTarget (this=0x7fc4d0b230, aTarget=aTarget@entry=0x0,
aRect=aRect@entry=0x0)
at ${PROJECT}/obj-build-mer-qt-xr/dist/include/mozilla/layers/LayersTypes.h:82
#3 0x0000007ff12b80e8 in mozilla::layers::CompositorBridgeParent::
ResumeComposition (this=this@entry=0x7fc4aebc90)
at ${PROJECT}/obj-build-mer-qt-xr/dist/include/mozilla/RefPtr.h:313
#4 0x0000007ff12b8174 in mozilla::layers::CompositorBridgeParent::
ResumeCompositionAndResize (this=0x7fc4aebc90, x=<optimized out>,
y=<optimized out>, width=<optimized out>, height=<optimized out>)
at gfx/layers/ipc/CompositorBridgeParent.cpp:794
#5 0x0000007ff12b0d10 in mozilla::detail::RunnableMethodArguments<int, int,
int, int>::applyImpl<mozilla::layers::CompositorBridgeParent, void
(mozilla::layers::CompositorBridgeParent::*)(int, int, int, int),
StoreCopyPassByConstLRef<int>, StoreCopyPassByConstLRef<int>,
StoreCopyPassByConstLRef<int>, StoreCopyPassByConstLRef<int>, 0ul, 1ul,
2ul, 3ul> (args=..., m=<optimized out>, o=<optimized out>)
at ${PROJECT}/obj-build-mer-qt-xr/dist/include/nsThreadUtils.h:1151
#6 mozilla::detail::RunnableMethodArguments<int, int, int, int>::apply
<mozilla::layers::CompositorBridgeParent, void (mozilla::layers::
CompositorBridgeParent::*)(int, int, int, int)> (m=<optimized out>,
o=<optimized out>, this=<optimized out>)
at ${PROJECT}/obj-build-mer-qt-xr/dist/include/nsThreadUtils.h:1154
[...]
#17 0x0000007ff6a0489c in ?? () from /lib64/libc.so.6
(gdb)
So the crash is happening before PrepareOffscreen() is called. Looking through the code there's actually only one place it is called and that's inside EmbedLiteCompositorBridgeParent::AllocPLayerTransactionParent(). There it's wrapped in a condition:
if (!StaticPrefs::embedlite_compositor_external_gl_context()) {
// Prepare Offscreen rendering context
PrepareOffscreen();
}
So I should check whether the problem is that this isn't being called, or the condition is false. A quick debug confirms that it's the latter: the method is entered but the value of the static preference means the PrepareOffScreen() call is never being made:
Thread 36 "Compositor" hit Breakpoint 11, mozilla::embedlite::
EmbedLiteCompositorBridgeParent::AllocPLayerTransactionParent
(this=0x7fc4bc68c0, aBackendHints=..., aId=...)
at mobile/sailfishos/embedthread/EmbedLiteCompositorBridgeParent.cpp:79
79 {
(gdb) n
80 PLayerTransactionParent* p =
(gdb) n
83 EmbedLiteWindowParent *parentWindow = EmbedLiteWindowParent::From(mWindowId);
(gdb) n
84 if (parentWindow) {
(gdb) n
85 parentWindow->GetListener()->CompositorCreated();
(gdb) n
88 if (!StaticPrefs::embedlite_compositor_external_gl_context()) {
(gdb) n
mozilla::layers::PCompositorBridgeParent::OnMessageReceived
(this=0x7fc4bc68c0, msg__=...) at PCompositorBridgeParent.cpp:1286
1286 PCompositorBridgeParent.cpp: No such file or directory.
(gdb)
As we can see, it comes down to this embedlite.compositor.external_gl_context static preference, which needs to be set to false for the condition to be entered.This preference isn't being set for the WebView, although it is set for the browser:
$ pushd ../sailfish-browser/
$ grep -rIn "embedlite.compositor.external_gl_context" *
apps/core/declarativewebutils.cpp:239:
webEngineSettings->setPreference(QString(
"embedlite.compositor.external_gl_context"), QVariant(true));
data/prefs.js:5:
user_pref("embedlite.compositor.external_gl_context", true);
tests/auto/mocks/declarativewebutils/declarativewebutils.cpp:62:
webEngineSettings->setPreference(QString(
"embedlite.compositor.external_gl_context"), QVariant(true));
$ popd
I'm going to set it to false explicitly for the WebView. But this immediately makes me feel nervous: this setting isn't new and there's a reason it's not being touched in the WebView code. It makes me think that I'm travelling down a rendering pipeline path that I shouldn't be.So as well as trying out this change I'm also going to ask for some expert advice from the Jolla team about this, just in case it's actually important that I don't set this to false and that the real issue is somewhere else.
But, it's the start of my work day, so that will all have to wait until later.
[...]
I've added in the change to set the embedlite.compositor.external_gl_context static preference to false:
diff --git a/lib/webenginesettings.cpp b/lib/webenginesettings.cpp
index de9e4b86..780f6555 100644
--- a/lib/webenginesettings.cpp
+++ b/lib/webenginesettings.cpp
@@ -110,6 +110,12 @@ void SailfishOS::WebEngineSettings::initialize()
engineSettings->setPreference(QStringLiteral("intl.accept_languages"),
QVariant::fromValue<QString>(langs));
+ // Ensure the renderer is configured correctly
+ engineSettings->setPreference(QStringLiteral("gfx.webrender.force-disabled"),
+ QVariant(true));
+ engineSettings->setPreference(QStringLiteral("embedlite.compositor.external_gl_context"),
+ QVariant(false));
+
Silica::Theme *silicaTheme = Silica::Theme::instance();
// Notify gecko when the ambience switches between light and dark
The code has successfully built; now it's time to test it. On a dry run of the new code it crashes seemingly somewhere close to where it was crashing before. But crucially the debug print from inside the PrepareOffscreen() method is now being output. So we've definitely moved a step forwards.
$ harbour-webview
[D] unknown:0 - QML debugging is enabled. Only use this in a safe environment.
[D] main:30 - WebView Example
[D] main:44 - Using default start URL: "https://www.flypig.co.uk/search/"
[D] main:47 - Opening webview
[D] unknown:0 - Using Wayland-EGL
library "libutils.so" not found
[...]
JSComp: UserAgentOverrideHelper.js loaded
UserAgentOverrideHelper app-startup
CONSOLE message:
[JavaScript Error: "Unexpected event profile-after-change" {file:
"resource://gre/modules/URLQueryStrippingListService.jsm" line: 228}]
observe@resource://gre/modules/URLQueryStrippingListService.jsm:228:12
Created LOG for EmbedPrefs
Created LOG for EmbedLiteLayerManager
=============== Preparing offscreen rendering context ===============
Segmentation fault
To find out what's going on we can step through. And after the new install it's finally time to start a new debugging session.
$ gdb harbour-webview
GNU gdb (GDB) Mer (8.2.1+git9)
[...]
(gdb) b EmbedLiteCompositorBridgeParent::PrepareOffscreen
Function "EmbedLiteCompositorBridgeParent::PrepareOffscreen" not defined.
Make breakpoint pending on future shared library load? (y or [n]) y
Breakpoint 1 (EmbedLiteCompositorBridgeParent::PrepareOffscreen) pending.
(gdb) r
[...]
Thread 36 "Compositor" hit Breakpoint 1, mozilla::embedlite::
EmbedLiteCompositorBridgeParent::PrepareOffscreen
(this=this@entry=0x7fc4be7560)
at mobile/sailfishos/embedthread/EmbedLiteCompositorBridgeParent.cpp:104
104 {
(gdb) n
[LWP 18280 exited]
105 fprintf(stderr,
"=============== Preparing offscreen rendering context ===============\n");
(gdb)
=============== Preparing offscreen rendering context ===============
107 const CompositorBridgeParent::LayerTreeState* state =
CompositorBridgeParent::GetIndirectShadowTree(RootLayerTreeId());
(gdb)
108 NS_ENSURE_TRUE(state && state->mLayerManager, );
(gdb)
110 GLContext* context = static_cast<CompositorOGL*>
(state->mLayerManager->GetCompositor())->gl();
(gdb) p context
$1 = <optimized out>
(gdb) n
111 NS_ENSURE_TRUE(context, );
(gdb) n
3540 ${PROJECT}/obj-build-mer-qt-xr/dist/include/GLContext.h:
No such file or directory.
(gdb) n
117 if (context->GetContextType() == GLContextType::EGL) {
(gdb) n
119 factory = SurfaceFactory_EGLImage::Create(*context);
(gdb) n
126 SwapChain* swapChain = context->GetSwapChain();
(gdb) n
127 if (swapChain == nullptr) {
(gdb) n
128 swapChain = new SwapChain();
(gdb) n
129 new SwapChainPresenter(*swapChain);
(gdb) n
130 context->mSwapChain.reset(swapChain);
(gdb) n
133 if (factory) {
(gdb) n
134 swapChain->Morph(std::move(factory));
(gdb) n
mozilla::embedlite::EmbedLiteCompositorBridgeParent::
AllocPLayerTransactionParent (this=0x7fc4be7560, aBackendHints=..., aId=...)
at mobile/sailfishos/embedthread/EmbedLiteCompositorBridgeParent.cpp:92
92 return p;
(gdb) c
Continuing.
Thread 36 "Compositor" received signal SIGSEGV, Segmentation fault.
0x0000007ff110a38c in mozilla::gl::SwapChain::OffscreenSize
(this=<optimized out>)
at ${PROJECT}/obj-build-mer-qt-xr/dist/include/mozilla/UniquePtr.h:290
290 ${PROJECT}/obj-build-mer-qt-xr/dist/include/mozilla/UniquePtr.h:
No such file or directory.
(gdb) bt
#0 0x0000007ff110a38c in mozilla::gl::SwapChain::OffscreenSize
(this=<optimized out>)
at ${PROJECT}/obj-build-mer-qt-xr/dist/include/mozilla/UniquePtr.h:290
#1 0x0000007ff3667930 in mozilla::embedlite::EmbedLiteCompositorBridgeParent::
CompositeToDefaultTarget (this=0x7fc4be7560, aId=...)
at ${PROJECT}/obj-build-mer-qt-xr/dist/include/mozilla/UniquePtr.h:290
#2 0x0000007ff12b808c in mozilla::layers::CompositorVsyncScheduler::
ForceComposeToTarget (this=0x7fc4d0b1a0, aTarget=aTarget@entry=0x0,
aRect=aRect@entry=0x0)
at ${PROJECT}/obj-build-mer-qt-xr/dist/include/mozilla/layers/
LayersTypes.h:82
#3 0x0000007ff12b80e8 in mozilla::layers::CompositorBridgeParent::
ResumeComposition (this=this@entry=0x7fc4be7560)
at ${PROJECT}/obj-build-mer-qt-xr/dist/include/mozilla/RefPtr.h:313
#4 0x0000007ff12b8174 in mozilla::layers::CompositorBridgeParent::
ResumeCompositionAndResize (this=0x7fc4be7560, x=<optimized out>,
y=<optimized out>, width=<optimized out>, height=<optimized out>)
at gfx/layers/ipc/CompositorBridgeParent.cpp:794
#5 0x0000007ff12b0d10 in mozilla::detail::RunnableMethodArguments<int, int,
int, int>::applyImpl<mozilla::layers::CompositorBridgeParent, void
(mozilla::layers::CompositorBridgeParent::*)(int, int, int, int),
StoreCopyPassByConstLRef<int>, StoreCopyPassByConstLRef<int>,
StoreCopyPassByConstLRef<int>, StoreCopyPassByConstLRef<int>, 0ul, 1ul,
2ul, 3ul> (args=..., m=<optimized out>, o=<optimized out>)
at ${PROJECT}/obj-build-mer-qt-xr/dist/include/nsThreadUtils.h:1151
[...]
#17 0x0000007ff6a0489c in ?? () from /lib64/libc.so.6
(gdb)
Here's the code that's causing the crash:
const gfx::IntSize& SwapChain::OffscreenSize() const {
return mPresenter->mBackBuffer->mFb->mSize;
}
It would be helpful to know which of these values is null, but unhelpfully the values have been optimised out.
(gdb) p mPresenter value has been optimized out (gdb) p this $2 = <optimized out>However if we go up a stack frame we can have better luck, applying the trick we used on Day 164 to extract the SwapChain object from the context via the UniquePtr class:
(gdb) frame 1
#1 0x0000007ff3667930 in mozilla::embedlite::EmbedLiteCompositorBridgeParent::
CompositeToDefaultTarget (this=0x7fc4be7560, aId=...)
at ${PROJECT}/obj-build-mer-qt-xr/dist/include/mozilla/UniquePtr.h:290
290 ${PROJECT}/obj-build-mer-qt-xr/dist/include/mozilla/UniquePtr.h:
No such file or directory.
(gdb) p context
$3 = (mozilla::gl::GLContext *) 0x7ee019ee40
(gdb) p context->mSwapChain.mTuple.mFirstA
$5 = (mozilla::gl::SwapChain *) 0x7ee01ce090
(gdb) p context->mSwapChain.mTuple.mFirstA->mPresenter
$6 = (mozilla::gl::SwapChainPresenter *) 0x7ee01a1380
(gdb) p context->mSwapChain.mTuple.mFirstA->mPresenter->mBackBuffer
$7 = std::shared_ptr<mozilla::gl::SharedSurface> (empty) = {get() = 0x0}
(gdb) p context->mSwapChain.mTuple.mFirstA->mPresenter->mBackBuffer->mFb
Cannot access memory at address 0x20
(gdb)
As we can see from this, the missing value is the mBackBuffer value inside the SwapChainPresenter object of the SwapChain class.It's clear what the next step is: find out why the mBackBuffer value isn't being set and, if necessary, set it. But that's a task that'll have to wait until tomorrow.
If you'd like to read any of my other gecko diary entries, they're all available on my Gecko-dev Diary page.
22 Feb 2024 : Day 164 #
Working on the WebView implementation, yesterday we reached the point where the WebView component no longer crashed the app hosting it. We did this by ensuring the correct layer manager was used for rendering.
But now we're left with a bunch of errors. The ones that need fixing immediately are the following:
It seems a bit odd that a text selector component should be requiring an entire separate phone library in order to work. Let's take a look at why.
The ofono code comes at the end of the file. There are two OfonoNetworkRegistration components called cellular1Status and cellular2Status. These represent the state of the two SIM card slots in the device. You might ask why there are only two; can't you have more than two SIM card slots? Well, yes, but I guess this is a problem for future developers to deal with.
These two components feed into the following Boolean value at the top of the code:
You might wonder how it knows it's a phone number at all. The answer to this question isn't in the sailfish-components-webview code. The answer is in embedlite-components, in the SelectionPrototype.js file where we find this code:
But that's a bit of a diversion. We only care about this new libqofono. Why is this newer version needed and why don't I have it on my system? Let's find out when and why it was changed. $ git blame import/controls/TextSelectionController.qml -L 14,14 16ef5cdf4 (Pekka Vuorela 2023-01-05 12:09:27 +0200 14) import QOfono 0.2 $ git log -1 16ef5cdf4 commit 16ef5cdf44c2eafd7d93e17a41927ef5da700c2b Author: Pekka Vuorela <pekka.vuorela@jolla.com> Date: Thu Jan 5 12:09:27 2023 +0200 [components-webview] Migrate to new qofono import. JB#59690 Also dependency was missing. The actual change here was pretty small.
None of this seems essential for ESR 91. My guess is that this change has gone into the development code but hasn't yet made it into a release. So I'm going to hack around it for now (being careful not to commit my hacked changes into the repository).
I've already amended the version number in the spec file, so to get things to work I should just have to reverse this change:
[...]
It's the evening and time to put the harbour-webview example through the debugger.
At the time I struggled with how to rearrange the code so that it compiled. I made changes that I couldn't test. And while I did get it to compile, these changes are now coming back to haunt me. Now I need to actually fix this rendering pipeline properly.
There's a bit of me that is glad I'm finally having to do this. I really want to know how it's actually supposed to work.
Clearly the first task will be to figure out why the mSwapChain member of GLContext is never being set. With any luck this will be at the easier end of the difficulty spectrum.
I'm going to try to find where mSwapChain is being — or should be being — set. To do that I'll need to find out where the context is coming from. The context is being passed by CompositorOGL so that would seem to be a good place to start.
Looking through the CompositoryOGL.cpp file we can see that the mGLContext member is being initialised from a value passed in to CompositorOGL::Initialize(). The debugger can help us work back from there.
But my head is full and this feels like a good place to leave things. Inside this method might be the right place to initialise mSwapChain, but it's definitely not happening here.
Tomorrow I'll do a sweep of the other code to check whether any attempt is being made to initialise it somewhere else. If not I'll add in some initialisation code to see what happens.
If you'd like to read any of my other gecko diary entries, they're all available on my Gecko-dev Diary page.
Comment
But now we're left with a bunch of errors. The ones that need fixing immediately are the following:
[W] unknown:7 - file:///usr/share/harbour-webview/qml/harbour-webview.qml:7:30:
Type WebViewPage unavailable
initialPage: Component { WebViewPage { } }
^
[W] unknown:13 - file:///usr/share/harbour-webview/qml/pages/
WebViewPage.qml:13:5: Type WebView unavailable
WebView {
^
[W] unknown:141 - file:///usr/lib64/qt5/qml/Sailfish/WebView/
WebView.qml:141:9: Type TextSelectionController unavailable
TextSelectionController {
^
[W] unknown:14 - file:///usr/lib64/qt5/qml/Sailfish/WebView/Controls/
TextSelectionController.qml:14:1: module "QOfono" is not installed
import QOfono 0.2
^
This cascade of errors all reduces to the last:
[W] unknown:14 - file:///usr/lib64/qt5/qml/Sailfish/WebView/Controls/
TextSelectionController.qml:14:1: module "QOfono" is not installed
import QOfono 0.2
^
The reason for this is also clear. The spec file for sailfish-components-webview makes clear that libqofono 0.117 or above is needed. I don't have this on my system for whatever reason (I'll need to investigate), but to work around this I hacked the spec file so that it wouldn't refuse to install on a system with a lower version, like this:
diff --git a/rpm/sailfish-components-webview.spec
b/rpm/sailfish-components-webview.spec
index 766933ba..c311ebcf 100644
--- a/rpm/sailfish-components-webview.spec
+++ b/rpm/sailfish-components-webview.spec
@@ -18,7 +18,7 @@ Requires: sailfishsilica-qt5 >= 1.1.123
Requires: sailfish-components-media-qt5
Requires: sailfish-components-pickers-qt5
Requires: embedlite-components-qt5 >= 1.21.2
-Requires: libqofono-qt5-declarative >= 0.117
+Requires: libqofono-qt5-declarative >= 0.115
%description
%{summary}.
There's no build-time requirement, so I thought I might get away with it. But clearly not.It seems a bit odd that a text selector component should be requiring an entire separate phone library in order to work. Let's take a look at why.
The ofono code comes at the end of the file. There are two OfonoNetworkRegistration components called cellular1Status and cellular2Status. These represent the state of the two SIM card slots in the device. You might ask why there are only two; can't you have more than two SIM card slots? Well, yes, but I guess this is a problem for future developers to deal with.
These two components feed into the following Boolean value at the top of the code:
readonly property bool _canCall: cellular1Status.registered
|| cellular2Status.registered
Later on in the code we see this being used, like this:
isPhoneNumber = _canCall && _phoneNumberSelected
So what's this all for? When you select some text the browser will present you with some options for what to do with it. Copy to clipboard? Open a link? If it thinks it's a phone number it will offer to make a call to it for you. Unless you don't have a SIM card installed. So that's why libqofono is needed here.You might wonder how it knows it's a phone number at all. The answer to this question isn't in the sailfish-components-webview code. The answer is in embedlite-components, in the SelectionPrototype.js file where we find this code:
_phoneRegex: /^\+?[0-9\s,-.\(\)*#pw]{1,30}$/,
_getSelectedPhoneNumber: function sh_getSelectedPhoneNumber() {
return this._isPhoneNumber(this._getSelectedText().trim());
},
_isPhoneNumber: function sh_isPhoneNumber(selectedText) {
return (this._phoneRegex.test(selectedText) ? selectedText : null);
},
So the decision about whether something is a phone number or not comes down to whether it satisfies the regex /^\+?[0-9\s,-.\(\)*#pw]{1,30}$/ and whether you have a SIM card installed.But that's a bit of a diversion. We only care about this new libqofono. Why is this newer version needed and why don't I have it on my system? Let's find out when and why it was changed.
$ git diff 16ef5cdf44c2eafd7d93e17a41927ef5da700c2b~ \
16ef5cdf44c2eafd7d93e17a41927ef5da700c2b
diff --git a/import/controls/TextSelectionController.qml
b/import/controls/TextSelectionController.qml
index 5c8f2845..71bd83cc 100644
--- a/import/controls/TextSelectionController.qml
+++ b/import/controls/TextSelectionController.qml
@@ -11,7 +11,7 @@
import QtQuick 2.1
import Sailfish.Silica 1.0
-import MeeGo.QOfono 0.2
+import QOfono 0.2
MouseArea {
id: root
diff --git a/rpm/sailfish-components-webview.spec
b/rpm/sailfish-components-webview.spec
index 9a2a3154..5729a8d9 100644
--- a/rpm/sailfish-components-webview.spec
+++ b/rpm/sailfish-components-webview.spec
@@ -18,6 +18,7 @@ Requires: sailfishsilica-qt5 >= 1.1.123
Requires: sailfish-components-media-qt5
Requires: sailfish-components-pickers-qt5
Requires: embedlite-components-qt5 >= 1.21.2
+Requires: libqofono-qt5-declarative >= 0.117
%description
%{summary}.
The import has been updated as have the requirements. But there's been no change to the code, so the libqofono version requirement is probably only needed to deal with the name change of the import.None of this seems essential for ESR 91. My guess is that this change has gone into the development code but hasn't yet made it into a release. So I'm going to hack around it for now (being careful not to commit my hacked changes into the repository).
I've already amended the version number in the spec file, so to get things to work I should just have to reverse this change:
-import MeeGo.QOfono 0.2 +import QOfono 0.2I can do that on-device. This should do it:
sed -i -e 's/QOfono/MeeGo.QOfono/g' \
/usr/lib64/qt5/qml/Sailfish/WebView/Controls/TextSelectionController.qml
Great! That's removed the QML error. But now the app is back to crashing again before it gets to even try to render something on-screen:
$ harbour-webview
[D] unknown:0 - QML debugging is enabled. Only use this in a safe environment.
[...]
UserAgentOverrideHelper app-startup
CONSOLE message:
[JavaScript Error: "Unexpected event profile-after-change" {file:
"resource://gre/modules/URLQueryStrippingListService.jsm" line: 228}]
observe@resource://gre/modules/URLQueryStrippingListService.jsm:228:12
Created LOG for EmbedPrefs
Created LOG for EmbedLiteLayerManager
Segmentation fault
So it's back to the debugger again. But this will have to wait until this evening.[...]
It's the evening and time to put the harbour-webview example through the debugger.
$ gdb harbour-webview
GNU gdb (GDB) Mer (8.2.1+git9)
[...]
Thread 36 "Compositor" received signal SIGSEGV, Segmentation fault.
[Switching to LWP 24061]
mozilla::gl::SwapChain::OffscreenSize (this=0x0)
at gfx/gl/GLScreenBuffer.cpp:129
129 return mPresenter->mBackBuffer->mFb->mSize;
(gdb) bt
#0 mozilla::gl::SwapChain::OffscreenSize (this=0x0)
at gfx/gl/GLScreenBuffer.cpp:129
#1 0x0000007ff3667930 in mozilla::embedlite::EmbedLiteCompositorBridgeParent::
CompositeToDefaultTarget (this=0x7fc4be8da0, aId=...)
at ${PROJECT}/obj-build-mer-qt-xr/dist/include/mozilla/UniquePtr.h:290
#2 0x0000007ff12b808c in mozilla::layers::CompositorVsyncScheduler::
ForceComposeToTarget (this=0x7fc4d0c0b0, aTarget=aTarget@entry=0x0,
aRect=aRect@entry=0x0)
at ${PROJECT}/obj-build-mer-qt-xr/dist/include/mozilla/layers/
LayersTypes.h:82
#3 0x0000007ff12b80e8 in mozilla::layers::CompositorBridgeParent::
ResumeComposition (this=this@entry=0x7fc4be8da0)
at ${PROJECT}/obj-build-mer-qt-xr/dist/include/mozilla/RefPtr.h:313
#4 0x0000007ff12b8174 in mozilla::layers::CompositorBridgeParent::
ResumeCompositionAndResize (this=0x7fc4be8da0, x=<optimized out>,
y=<optimized out>, width=<optimized out>, height=<optimized out>)
at gfx/layers/ipc/CompositorBridgeParent.cpp:794
#5 0x0000007ff12b0d10 in mozilla::detail::RunnableMethodArguments<int, int,
int, int>::applyImpl<mozilla::layers::CompositorBridgeParent, void
(mozilla::layers::CompositorBridgeParent::*)(int, int, int, int),
StoreCopyPassByConstLRef<int>, StoreCopyPassByConstLRef<int>,
StoreCopyPassByConstLRef<int>, StoreCopyPassByConstLRef<int>, 0ul, 1ul,
2ul, 3ul> (args=..., m=<optimized out>, o=<optimized out>)
at ${PROJECT}/obj-build-mer-qt-xr/dist/include/nsThreadUtils.h:1151
[...]
#17 0x0000007ff6a0489c in ?? () from /lib64/libc.so.6
(gdb)
This is now a proper crash, not something induced intentionally by the code. Here's the actual code causing the crash taken from GLSCreenBuffer.cpp:
const gfx::IntSize& SwapChain::OffscreenSize() const {
return mPresenter->mBackBuffer->mFb->mSize;
}
The problem here being that the SwapChain object itself is null. So we should look in the calling method to find out what's going on there. Here's the relevant code this time from EmbedLiteCompositorBridgeParent.cpp:
void
EmbedLiteCompositorBridgeParent::CompositeToDefaultTarget(VsyncId aId)
{
GLContext* context = static_cast<CompositorOGL*>(state->mLayerManager->
GetCompositor())->gl();
[...]
if (context->IsOffscreen()) {
MutexAutoLock lock(mRenderMutex);
if (context->GetSwapChain()->OffscreenSize() != mEGLSurfaceSize
&& !context->GetSwapChain()->Resize(mEGLSurfaceSize)) {
return;
}
}
With a bit of digging we can see that the value being returned by context->GetSwapChain() is null:
(gdb) frame 1
#1 0x0000007ff3667930 in mozilla::embedlite::EmbedLiteCompositorBridgeParent::
CompositeToDefaultTarget (this=0x7fc4be8da0, aId=...)
at ${PROJECT}/obj-build-mer-qt-xr/dist/include/mozilla/UniquePtr.h:290
290 ${PROJECT}/obj-build-mer-qt-xr/dist/include/mozilla/UniquePtr.h:
No such file or directory.
(gdb) p context
$2 = (mozilla::gl::GLContext *) 0x7ed819ee00
(gdb) p context->GetSwapChain()
Cannot evaluate function -- may be inlined
(gdb) p context.mSwapChain
$3 = {
mTuple = {<mozilla::detail::CompactPairHelper<mozilla::gl::SwapChain*,
mozilla::DefaultDelete<mozilla::gl::SwapChain>,
(mozilla::detail::StorageType)1, (mozilla::detail::StorageType)0>> =
{<mozilla::DefaultDelete<mozilla::gl::SwapChain>> = {<No data fields>},
mFirstA = 0x0}, <No data fields>}}
(gdb) p context.mSwapChain.mTuple
$4 = {<mozilla::detail::CompactPairHelper<mozilla::gl::SwapChain*,
mozilla::DefaultDelete<mozilla::gl::SwapChain>,
(mozilla::detail::StorageType)1, (mozilla::detail::StorageType)0>> =
{<mozilla::DefaultDelete<mozilla::gl::SwapChain>> = {<No data fields>},
mFirstA = 0x0}, <No data fields>}
(gdb) p context.mSwapChain.mTuple.mFirstA
$5 = (mozilla::gl::SwapChain *) 0x0
(gdb)
You may recall that way back in the first three weeks of working on Gecko I hit a problem with the rendering pipeline. The GLScreenBuffer structure that the WebView has been using for a long time had been completely removed and replaced with this SwapChain class.At the time I struggled with how to rearrange the code so that it compiled. I made changes that I couldn't test. And while I did get it to compile, these changes are now coming back to haunt me. Now I need to actually fix this rendering pipeline properly.
There's a bit of me that is glad I'm finally having to do this. I really want to know how it's actually supposed to work.
Clearly the first task will be to figure out why the mSwapChain member of GLContext is never being set. With any luck this will be at the easier end of the difficulty spectrum.
I'm going to try to find where mSwapChain is being — or should be being — set. To do that I'll need to find out where the context is coming from. The context is being passed by CompositorOGL so that would seem to be a good place to start.
Looking through the CompositoryOGL.cpp file we can see that the mGLContext member is being initialised from a value passed in to CompositorOGL::Initialize(). The debugger can help us work back from there.
(gdb) break CompositorOGL::Initialize
Breakpoint 1 at 0x7ff11b0c3c: file gfx/layers/opengl/CompositorOGL.cpp,
line 380.
(gdb) r
The program being debugged has been started already.
Start it from the beginning? (y or n) y
Starting program: /usr/bin/harbour-webview
[...]
Thread 36 "Compositor" hit Breakpoint 1, mozilla::layers::CompositorOGL::
Initialize (this=0x7ee0002f50, out_failureReason=0x7f1faac520)
at gfx/layers/opengl/CompositorOGL.cpp:380
380 bool CompositorOGL::Initialize(nsCString* const out_failureReason) {
(gdb)
Ah! This is interesting. It's not being passed in because there are two different overloads of the CompositorOGL::Initialize() method and the code is using the other one. In this other piece of code the context is created directly:
bool CompositorOGL::Initialize(nsCString* const out_failureReason) {
ScopedGfxFeatureReporter reporter("GL Layers");
// Do not allow double initialization
MOZ_ASSERT(mGLContext == nullptr || !mOwnsGLContext,
"Don't reinitialize CompositorOGL");
if (!mGLContext) {
MOZ_ASSERT(mOwnsGLContext);
mGLContext = CreateContext();
}
[...]
Let's see what happens with the context creation.
Thread 36 "Compositor" hit Breakpoint 5, mozilla::layers::CompositorOGL::
CreateContext (this=this@entry=0x7ee0002f50)
at gfx/layers/opengl/CompositorOGL.cpp:227
227 already_AddRefed<mozilla::gl::GLContext> CompositorOGL::CreateContext() {
(gdb) n
231 nsIWidget* widget = mWidget->RealWidget();
(gdb)
232 void* widgetOpenGLContext =
(gdb)
234 if (widgetOpenGLContext) {
(gdb)
248 if (!context && gfxEnv::LayersPreferOffscreen()) {
(gdb) b GLContextProviderEGL::CreateHeadless
Breakpoint 6 at 0x7ff1133740: file gfx/gl/GLContextProviderEGL.cpp, line 1245.
(gdb) c
Continuing.
Thread 36 "Compositor" hit Breakpoint 6, mozilla::gl::GLContextProviderEGL::
CreateHeadless (desc=..., out_failureId=out_failureId@entry=0x7f1faed1c8)
at gfx/gl/GLContextProviderEGL.cpp:1245
1245 const GLContextCreateDesc& desc, nsACString* const out_failureId) {
(gdb) n
1246 const auto display = DefaultEglDisplay(out_failureId);
(gdb)
1247 if (!display) {
(gdb) p display
$8 = std::shared_ptr<mozilla::gl::EglDisplay> (use count 1, weak count 2)
= {get() = 0x7ee0004cb0}
(gdb) n
1250 mozilla::gfx::IntSize dummySize = mozilla::gfx::IntSize(16, 16);
(gdb) b GLContextEGL::CreateEGLPBufferOffscreenContext
Breakpoint 7 at 0x7ff11335b8: file gfx/gl/GLContextProviderEGL.cpp, line 1233.
(gdb) c
Continuing.
Thread 36 "Compositor" hit Breakpoint 7, mozilla::gl::GLContextEGL::
CreateEGLPBufferOffscreenContext (
display=std::shared_ptr<mozilla::gl::EglDisplay> (use count 2, weak count 2)
= {...}, desc=..., size=...,
out_failureId=out_failureId@entry=0x7f1faed1c8)
at gfx/gl/GLContextProviderEGL.cpp:1233
1233 const mozilla::gfx::IntSize& size, nsACString* const
out_failureId) {
(gdb) b GLContextEGL::CreateEGLPBufferOffscreenContextImpl
Breakpoint 8 at 0x7ff1133160: file gfx/gl/GLContextProviderEGL.cpp, line 1185.
(gdb) c
Continuing.
Thread 36 "Compositor" hit Breakpoint 8, mozilla::gl::GLContextEGL::
CreateEGLPBufferOffscreenContextImpl (
egl=std::shared_ptr<mozilla::gl::EglDisplay> (use count 3, weak count 2) =
{...}, desc=..., size=..., useGles=useGles@entry=false,
out_failureId=out_failureId@entry=0x7f1faed1c8)
at gfx/gl/GLContextProviderEGL.cpp:1185
1185 nsACString* const out_failureId) {
(gdb) n
1186 const EGLConfig config = ChooseConfig(*egl, desc, useGles);
(gdb)
1187 if (config == EGL_NO_CONFIG) {
(gdb)
1193 if (GLContext::ShouldSpew()) {
(gdb)
1197 mozilla::gfx::IntSize pbSize(size);
(gdb)
1307 include/c++/8.3.0/bits/shared_ptr_base.h: No such file or directory.
(gdb)
1208 if (!surface) {
(gdb)
1214 auto fullDesc = GLContextDesc{desc};
(gdb)
1215 fullDesc.isOffscreen = true;
(gdb)
1217 egl, fullDesc, config, surface, useGles, out_failureId);
(gdb) b GLContextEGL::CreateGLContext
Breakpoint 9 at 0x7ff1132548: file gfx/gl/GLContextProviderEGL.cpp, line 618.
(gdb) c
Continuing.
Thread 36 "Compositor" hit Breakpoint 9, mozilla::gl::GLContextEGL::
CreateGLContext (egl=std::shared_ptr<mozilla::gl::EglDisplay>
(use count 4, weak count 2) = {...}, desc=...,
config=config@entry=0x55558fc450, surface=surface@entry=0x7ee0008f40,
useGles=useGles@entry=false, out_failureId=out_failureId@entry=0x7f1faed1c8)
at gfx/gl/GLContextProviderEGL.cpp:618
618 nsACString* const out_failureId) {
(gdb) n
621 std::vector<EGLint> required_attribs;
(gdb)
We're getting down into the depths now. It's surprisingly thrilling to be seeing this code again. I recall that this GLContextEGL::CreateGLContext() method is where a lot of the action happens.But my head is full and this feels like a good place to leave things. Inside this method might be the right place to initialise mSwapChain, but it's definitely not happening here.
Tomorrow I'll do a sweep of the other code to check whether any attempt is being made to initialise it somewhere else. If not I'll add in some initialisation code to see what happens.
If you'd like to read any of my other gecko diary entries, they're all available on my Gecko-dev Diary page.
21 Feb 2024 : Day 163 #
We're making good progress with the WebView rendering pipeline. The first issue to fix, which we've been looking at for the last couple of days, has been ensuring the layer manger is of the Client type, rather than the WebRender type. There's a new WEBRENDER_SOFTWARE feature that was introduced between ESR 78 and ESR 91 which is causing the trouble. In previous builds we disabled the WEBRENDER feature, but now with the new feature it's being enabled again. we need to ensure it's not enabled.
So the key questions to answer today are: how was WEBRENDER being disabled on ESR 78; and can we do something equivalent for WEBRENDER_SOFTWARE on ESR 91.
In the gfxConfigureManager.cpp file there are a couple of encouraging looking methods called gfxConfigManager::ConfigureWebRender() and gfxConfigManager::ConfigureWebRenderSoftware(). These enable and disable the web renderer and software web renderer features respectively. Unsurprisingly, the latter is a new method for ESR 91, but the former is available in both ESR 78 and ESR 91, so I'll concentrate on that one first.
When looking at the code in these we also need to refer back to the initialisation method, because that's where some key variables are being created:
In ESR 78 the logic for whether mFeatureWr should be enabled or not is serpentine. I'm not going to try to work through by hand, rather I'll set the debugger on it and see which way it slithers.
Happily my debug session is still running from yesterday (I think it's been running for three days now), so I can continue straight with that. I'll include the full step-through, but there's a lot of it so don't feel you have to follow along, I'll summarise the important parts afterwards.
We can see that it's set to disabled from the following sequence, copied from the full debugging session above:
The layers are the following:
So, to summarise and bring all this together, the mFeatureWr feature is enabled if all of the following hold:
Now we need to compare this to the process for ESR 91. Before we get into it it's worth noting that the WEBRENDER feature in ESR 91 is also (correctly) disabled, so we may not see any big differences here with this. Let's see.
Again, I can continue with the debugging session I've been running for the last few days:
Both of these are set in the initialisation method, like this:
For the software web render layer manager we could set the MOZ_WEBRENDER environment variable to 0 to force it to be disabled and this will be handy for testing. But in the longer term we should probably put some code into sailfish-browser to explicitly set the gfx.webrender.force-disabled static preference to true.
As I look in to this I discover something surprising. Even though web render is disabled by default, doing some grepping around the code threw the following up in the sailfish-browser code:
I'll look into the rendering more tomorrow.
If you'd like to read any of my other gecko diary entries, they're all available on my Gecko-dev Diary page.
Comment
So the key questions to answer today are: how was WEBRENDER being disabled on ESR 78; and can we do something equivalent for WEBRENDER_SOFTWARE on ESR 91.
In the gfxConfigureManager.cpp file there are a couple of encouraging looking methods called gfxConfigManager::ConfigureWebRender() and gfxConfigManager::ConfigureWebRenderSoftware(). These enable and disable the web renderer and software web renderer features respectively. Unsurprisingly, the latter is a new method for ESR 91, but the former is available in both ESR 78 and ESR 91, so I'll concentrate on that one first.
When looking at the code in these we also need to refer back to the initialisation method, because that's where some key variables are being created:
void gfxConfigManager::Init() {
[...]
mFeatureWr = &gfxConfig::GetFeature(Feature::WEBRENDER);
[...]
mFeatureWrSoftware = &gfxConfig::GetFeature(Feature::WEBRENDER_SOFTWARE);
[...]
So these two variables — mFeatureWr and mFeatureWrSoftware are feature objects which we can then use to enable and disable various features.In ESR 78 the logic for whether mFeatureWr should be enabled or not is serpentine. I'm not going to try to work through by hand, rather I'll set the debugger on it and see which way it slithers.
Happily my debug session is still running from yesterday (I think it's been running for three days now), so I can continue straight with that. I'll include the full step-through, but there's a lot of it so don't feel you have to follow along, I'll summarise the important parts afterwards.
(gdb) delete break
Delete all breakpoints? (y or n) y
(gdb) b gfxConfigManager::ConfigureWebRender
Breakpoint 5 at 0x7fb90a8d88: file gfx/config/gfxConfigManager.cpp, line 194.
(gdb) r
The program being debugged has been started already.
Start it from the beginning? (y or n) y
Starting program: /usr/bin/harbour-webview
[...]
Thread 7 "GeckoWorkerThre" hit Breakpoint 5, mozilla::gfx::gfxConfigManager::
ConfigureWebRender (this=this@entry=0x7fa7972598)
at gfx/config/gfxConfigManager.cpp:194
194 void gfxConfigManager::ConfigureWebRender() {
(gdb) n
206 mFeatureWrCompositor->SetDefaultFromPref("gfx.webrender.compositor",
true,
(gdb) n
209 if (mWrCompositorForceEnabled) {
(gdb) n
213 ConfigureFromBlocklist(nsIGfxInfo::FEATURE_WEBRENDER_COMPOSITOR,
(gdb) n
219 if (!mHwStretchingSupport && mScaledResolution) {
(gdb) n
225 bool guardedByQualifiedPref = ConfigureWebRenderQualified();
(gdb) n
300 obj-build-mer-qt-xr/dist/include/nsTStringRepr.h: No such file or directory.
(gdb) p *mFeatureWr
$15 = {mDefault = {mMessage = '\000' <repeats 63 times>, mStatus =
mozilla::gfx::FeatureStatus::Unused}, mUser = {mMessage = '\000'
<repeats 63 times>, mStatus = mozilla::gfx::FeatureStatus::Unused},
mEnvironment = {mMessage = '\000' <repeats 63 times>,
mStatus = mozilla::gfx::FeatureStatus::Unused}, mRuntime = {mMessage =
'\000' <repeats 63 times>, mStatus = mozilla::gfx::FeatureStatus::Unused},
mFailureId = {<nsTSubstring<char>> = {<mozilla::detail::nsTStringRepr<char>> =
{mData = 0x7fbc7d4f42 <gNullChar> "", mLength = 0, mDataFlags =
mozilla::detail::StringDataFlags::TERMINATED, mClassFlags =
mozilla::detail::StringClassFlags::NULL_TERMINATED},
static kMaxCapacity = 2147483637}, <No data fields>}}
(gdb) p mFeatureWr->GetValue()
$16 = mozilla::gfx::FeatureStatus::Unused
(gdb) p mFeatureWr->IsEnabled()
$17 = false
(gdb) p mFeatureWr->mDefault.mStatus
$30 = mozilla::gfx::FeatureStatus::Unused
(gdb) p mFeatureWr->mRuntime.mStatus
$31 = mozilla::gfx::FeatureStatus::Unused
(gdb) n
235 if (mWrEnvForceEnabled) {
(gdb) p mWrEnvForceEnabled
$18 = false
(gdb) n
237 } else if (mWrForceEnabled) {
(gdb) p mWrForceEnabled
$19 = false
(gdb) n
239 } else if (mFeatureWrQualified->IsEnabled()) {
(gdb) p mFeatureWrQualified->IsEnabled()
$20 = false
(gdb) n
253 if (mWrForceDisabled ||
(gdb) p mWrForceDisabled
$21 = false
(gdb) p mWrEnvForceDisabled
$22 = false
(gdb) p mWrQualifiedOverride.isNothing()
Cannot evaluate function -- may be inlined
(gdb) n
261 if (!mFeatureHwCompositing->IsEnabled()) {
(gdb) n
268 if (mSafeMode) {
(gdb) n
276 if (mIsWindows && !mIsWin10OrLater && !mDwmCompositionEnabled) {
(gdb) p mIsWindows
$23 = false
(gdb) p mIsWin10OrLater
$24 = false
(gdb) p mDwmCompositionEnabled
$25 = true
(gdb) n
283 NS_LITERAL_CSTRING("FEATURE_FAILURE_DEFAULT_OFF"));
(gdb) n
285 if (mFeatureD3D11HwAngle && mWrForceAngle) {
(gdb) n
301 if (!mFeatureWr->IsEnabled() && mDisableHwCompositingNoWr) {
(gdb) p mFeatureWr->IsEnabled()
$26 = false
(gdb) p mDisableHwCompositingNoWr
$27 = false
(gdb) n
324 NS_LITERAL_CSTRING("FEATURE_FAILURE_DEFAULT_OFF"));
(gdb) n
326 if (mWrDCompWinEnabled) {
(gdb) n
334 if (!mWrPictureCaching) {
(gdb) n
340 if (!mFeatureWrDComp->IsEnabled() && mWrCompositorDCompRequired) {
(gdb) n
348 if (mWrPartialPresent) {
(gdb) n
gfxPlatform::InitWebRenderConfig (this=<optimized out>)
at gfx/thebes/gfxPlatform.cpp:2733
2733 if (Preferences::GetBool("gfx.webrender.program-binary-disk", false)) {
(gdb) c
[...]
That's a bit too much detail there, but the key conclusion is that mFeatureWr (which represents the state of the WEBRENDER feature starts off disabled and the value is never changed. So by the end of the gfxConfigManager::ConfigureWebRender() method the feature remains disabled. It's not changed anywhere else and so we're left with our layer manager being created as a Client layer manager, which is what we need.We can see that it's set to disabled from the following sequence, copied from the full debugging session above:
(gdb) p mFeatureWr->IsEnabled() $17 = false (gdb) p mFeatureWr->mDefault.mStatus $30 = mozilla::gfx::FeatureStatus::Unused (gdb) p mFeatureWr->mRuntime.mStatus $31 = mozilla::gfx::FeatureStatus::UnusedFeatures are made from multiple layers of states. Each layer can be either set or unused. To determine the state of a feature each layer is examined in order until one of them is set to something other than Unused. The first unused layer provides the actual state of the feature.
The layers are the following:
- mRuntime
- mUser
- mEnvironment
- mStatus
- mDefault
So, to summarise and bring all this together, the mFeatureWr feature is enabled if all of the following hold:
- mFeatureWr->mDefault.mStatus is set to anything other than Unused.
- The mStatus value of one of the other layers is set to something other than Unused and is either Available or ForceEnabled.
Now we need to compare this to the process for ESR 91. Before we get into it it's worth noting that the WEBRENDER feature in ESR 91 is also (correctly) disabled, so we may not see any big differences here with this. Let's see.
Again, I can continue with the debugging session I've been running for the last few days:
(gdb) delete break
Delete all breakpoints? (y or n) y
(gdb) b gfxConfigManager::ConfigureWebRender
Breakpoint 9 at 0x7ff138d708: file gfx/config/gfxConfigManager.cpp, line 215.
(gdb) b gfxConfigManager::ConfigureWebRenderSoftware
Breakpoint 10 at 0x7ff138d41c: file gfx/config/gfxConfigManager.cpp, line 125.
(gdb) r
The program being debugged has been started already.
Start it from the beginning? (y or n) y
Starting program: /usr/bin/harbour-webview
[...]
Thread 7 "GeckoWorkerThre" hit Breakpoint 9, mozilla::gfx::gfxConfigManager::
ConfigureWebRender (this=this@entry=0x7fd7da72f8)
at gfx/config/gfxConfigManager.cpp:215
215 void gfxConfigManager::ConfigureWebRender() {
(gdb) p mFeatureWr->IsEnabled()
$13 = false
(gdb) p mFeatureWr->mDefault.mStatus
$14 = mozilla::gfx::FeatureStatus::Unused
(gdb) p mFeatureWr->mRuntime.mStatus
$15 = mozilla::gfx::FeatureStatus::Unused
So as we go in to the ConfigureWebRender() method the value is set to disabled. This is the same as for ESR 78.
(gdb) n
230 mFeatureWrCompositor->SetDefaultFromPref("gfx.webrender.compositor",
true,
(gdb)
233 if (mWrCompositorForceEnabled) {
(gdb)
237 ConfigureFromBlocklist(nsIGfxInfo::FEATURE_WEBRENDER_COMPOSITOR,
(gdb)
243 if (!mHwStretchingSupport.IsFullySupported() && mScaledResolution) {
(gdb)
253 ConfigureWebRenderSoftware();
(gdb) n
At this point we're jumping in to the ConfigureWebRenderSoftware() method. We're going to continue into it, since we're interested to know what happens there. But it's worth noting that this is a departure from what happens on ESR 78.
Thread 7 "GeckoWorkerThre" hit Breakpoint 10, mozilla::gfx::gfxConfigManager::
ConfigureWebRenderSoftware (this=this@entry=0x7fd7da72f8)
at gfx/config/gfxConfigManager.cpp:125
125 void gfxConfigManager::ConfigureWebRenderSoftware() {
(gdb) p mFeatureWrSoftware->IsEnabled()
$16 = false
(gdb) p mFeatureWrSoftware->mDefault.mStatus
$17 = mozilla::gfx::FeatureStatus::Unused
(gdb) p mFeatureWrSoftware->mDefault.mStatus
$18 = mozilla::gfx::FeatureStatus::Unused
(gdb) p mFeatureWrSoftware->mRuntime.mStatus
$19 = mozilla::gfx::FeatureStatus::Unused
Going in we also see that the mFeatureWrSoftware feature is disabled.
(gdb) n
128 mFeatureWrSoftware->EnableByDefault();
(gdb) n
134 if (mWrSoftwareForceEnabled) {
(gdb) p mFeatureWrSoftware->IsEnabled()
$20 = true
(gdb) p mFeatureWrSoftware->mDefault.mStatus
$21 = mozilla::gfx::FeatureStatus::Available
(gdb) p mFeatureWrSoftware->mRuntime.mStatus
$22 = mozilla::gfx::FeatureStatus::Unused
(gdb) p mFeatureWrSoftware->mUser.mStatus
$23 = mozilla::gfx::FeatureStatus::Unused
(gdb) p mFeatureWrSoftware->mEnvironment.mStatus
$24 = mozilla::gfx::FeatureStatus::Unused
(gdb) p mFeatureWrSoftware->mDefault.mStatus
$25 = mozilla::gfx::FeatureStatus::Available
But this is immediately switched to being enabled; in this case set as having a default value of Available. So far there have been no conditions on the execution, so we're guaranteed to reach this state every time. Let's continue.
(gdb) p mWrSoftwareForceEnabled
$33 = false
(gdb) n
136 } else if (mWrForceDisabled || mWrEnvForceDisabled) {
(gdb) p mWrForceDisabled
$26 = false
(gdb) p mWrEnvForceDisabled
$27 = false
Here there was an opportunity to disable the feature if either mWrForceDisabled or mWrEnvForceDisabled were set to true, but since both were set to false we skip over this possibility. This might be our way in to disabling it, so we may want to return to this. But let's continue on with the rest of the debugging for now.
(gdb) n
141 } else if (gfxPlatform::DoesFissionForceWebRender()) {
(gdb) n
145 if (!mHasWrSoftwareBlocklist) {
(gdb) p mHasWrSoftwareBlocklist
$28 = false
At this point the mHasWrSoftwareBlocklist variable is set to false which causes us to jump out of the ConfigureWebRenderSoftware() method early. So we'll return back up the stack to the ConfigureWebRender() method and continue from there.
(gdb) n
mozilla::gfx::gfxConfigManager::ConfigureWebRender
(this=this@entry=0x7fd7da72f8)
at gfx/config/gfxConfigManager.cpp:254
254 ConfigureWebRenderQualified();
(gdb) n
256 mFeatureWr->EnableByDefault();
(gdb) n
262 if (mWrSoftwareForceEnabled) {
(gdb) p mFeatureWr->IsEnabled()
$29 = true
(gdb) n
Here we see another change from ESR 78. The mFeatureWr feature is enabled here. We already know it's ultimately disabled so we should keep an eye out for where that happens.
266 } else if (mWrEnvForceEnabled) {
(gdb)
268 } else if (mWrForceDisabled || mWrEnvForceDisabled) {
(gdb)
275 } else if (mWrForceEnabled) {
(gdb) p mWrForceEnabled
$30 = false
(gdb) n
279 if (!mFeatureWrQualified->IsEnabled()) {
(gdb) p mFeatureWrQualified->IsEnabled()
$31 = false
(gdb) n
282 mFeatureWr->Disable(FeatureStatus::Disabled, "Not qualified",
(gdb) n
287 if (!mFeatureHwCompositing->IsEnabled()) {
(gdb) p mFeatureWr->IsEnabled()
$32 = false
So here it gets disabled again and the reason is because mFeatureWrQualified is disabled. Here's the comment text that goes alongside this in the code (the debugger skips these comments):
// No qualified hardware. If we haven't allowed software fallback,
// then we need to disable WR.
So we'll end up with this being disabled whatever happens. There's not much to see in the remainder of the method, but let's skip through the rest of the steps for completeness.
(gdb) n
293 if (mSafeMode) {
(gdb) n
302 if (mXRenderEnabled) {
(gdb) n
312 mFeatureWrAngle->EnableByDefault();
(gdb) n
313 if (mFeatureD3D11HwAngle) {
(gdb) n
335 mFeatureWrAngle->Disable(FeatureStatus::Unavailable,
"OS not supported",
(gdb) n
339 if (mWrForceAngle && mFeatureWr->IsEnabled() &&
(gdb) n
347 if (!mFeatureWr->IsEnabled() && mDisableHwCompositingNoWr) {
(gdb) n
367 mFeatureWrDComp->EnableByDefault();
(gdb) n
368 if (!mWrDCompWinEnabled) {
(gdb) n
369 mFeatureWrDComp->UserDisable("User disabled via pref",
(gdb) n
373 if (!mIsWin10OrLater) {
(gdb) n
375 mFeatureWrDComp->Disable(FeatureStatus::Unavailable,
(gdb) n
380 if (!mIsNightly) {
(gdb) n
383 nsAutoString adapterVendorID;
(gdb) n
384 mGfxInfo->GetAdapterVendorID(adapterVendorID);
(gdb) n
385 if (adapterVendorID == u"0x10de") {
(gdb) n
383 nsAutoString adapterVendorID;
(gdb) n
396 mFeatureWrDComp->MaybeSetFailed(
(gdb) n
399 mFeatureWrDComp->MaybeSetFailed(mFeatureWrAngle->IsEnabled(),
(gdb) n
403 if (!mFeatureWrDComp->IsEnabled() && mWrCompositorDCompRequired) {
(gdb) n
411 if (mWrPartialPresent) {
(gdb) n
654 ${PROJECT}/obj-build-mer-qt-xr/dist/include/mozilla/StaticPrefList_gfx.h:
No such file or directory.
(gdb) n
433 ConfigureFromBlocklist(nsIGfxInfo::FEATURE_WEBRENDER_SHADER_CACHE,
(gdb) n
435 if (!mFeatureWr->IsEnabled()) {
(gdb) n
436 mFeatureWrShaderCache->ForceDisable(FeatureStatus::Unavailable,
(gdb) n
441 mFeatureWrOptimizedShaders->EnableByDefault();
(gdb) n
442 if (!mWrOptimizedShaders) {
(gdb) n
446 ConfigureFromBlocklist(nsIGfxInfo::FEATURE_WEBRENDER_OPTIMIZED_SHADERS,
(gdb) n
448 if (!mFeatureWr->IsEnabled()) {
(gdb) n
449 mFeatureWrOptimizedShaders->ForceDisable(FeatureStatus::Unavailable,
(gdb) n
And we're out of the method. So that's it: we can see that mFeatureWr is disabled here, as expected. However when it comes to mFeatureWrSoftware it's a different story. The value is enabled by default; to get it disabled we'll need to ensure one of mWrForceDisabled or mWrEnvForceDisabled is set to true.Both of these are set in the initialisation method, like this:
void gfxConfigManager::Init() {
[...]
mWrForceDisabled = StaticPrefs::gfx_webrender_force_disabled_AtStartup();
[...]
mWrEnvForceDisabled = gfxPlatform::WebRenderEnvvarDisabled();
[...]
Here's the code that creates the former:
ONCE_PREF( "gfx.webrender.force-disabled", gfx_webrender_force_disabled, gfx_webrender_force_disabled_AtStartup, bool, false )That's from the autogenerated obj-build-mer-qt-xr/modules/libpref/init/StaticPrefList_gfx.h file. This is being generated from the gecko-dev/modules/libpref/init/StaticPrefList.yaml file, the relevant part of which looks like this:
# Also expose a pref to allow users to force-disable WR. This is exposed # on all channels because WR can be enabled on qualified hardware on all # channels. - name: gfx.webrender.force-disabled type: bool value: false mirror: onceThe latter is set using an environment variable:
/*static*/
bool gfxPlatform::WebRenderEnvvarDisabled() {
const char* env = PR_GetEnv("MOZ_WEBRENDER");
return (env && *env == '0');
}
Okay, we've reached the end of this piece of investigation. What's clear is that there may not be any Sailfish-specific code for disabling the web render layer manager because it's being disabled by default anyway.For the software web render layer manager we could set the MOZ_WEBRENDER environment variable to 0 to force it to be disabled and this will be handy for testing. But in the longer term we should probably put some code into sailfish-browser to explicitly set the gfx.webrender.force-disabled static preference to true.
As I look in to this I discover something surprising. Even though web render is disabled by default, doing some grepping around the code threw the following up in the sailfish-browser code:
void DeclarativeWebUtils::setRenderingPreferences()
{
SailfishOS::WebEngineSettings *webEngineSettings =
SailfishOS::WebEngineSettings::instance();
// Use external Qt window for rendering content
webEngineSettings->setPreference(
QString("gfx.compositor.external-window"), QVariant(true));
webEngineSettings->setPreference(
QString("gfx.compositor.clear-context"), QVariant(false));
webEngineSettings->setPreference(
QString("gfx.webrender.force-disabled"), QVariant(true));
webEngineSettings->setPreference(
QString("embedlite.compositor.external_gl_context"), QVariant(true));
}
This is fine for the browser, but it's not going to get executed for the WebView, so I'll need to set this in WebEngineSettings::initialize() as well. Thankfully, making this change turns out to be pretty straightforward:
diff --git a/lib/webenginesettings.cpp b/lib/webenginesettings.cpp
index de9e4b86..13b21d5b 100644
--- a/lib/webenginesettings.cpp
+++ b/lib/webenginesettings.cpp
@@ -110,6 +110,10 @@ void SailfishOS::WebEngineSettings::initialize()
engineSettings->setPreference(QStringLiteral("intl.accept_languages"),
QVariant::fromValue<QString>(langs));
+ // Ensure the web renderer is disabled
+ engineSettings->setPreference(QStringLiteral("gfx.webrender.force-disabled"),
+ QVariant(true));
+
Silica::Theme *silicaTheme = Silica::Theme::instance();
// Notify gecko when the ambience switches between light and dark
As well as this change I also had to amend the rawwebview.cpp file to accommodate some of the API changes I made earlier to gecko. I guess I've not built the sailfish-components-webview packages recently or this would have come up. Nevertheless the fix isn't anything too dramatic:
diff --git a/import/webview/rawwebview.cpp b/import/webview/rawwebview.cpp
index 1b1bb92a..2eab77f5 100644
--- a/import/webview/rawwebview.cpp
+++ b/import/webview/rawwebview.cpp
@@ -37,7 +37,7 @@ public:
ViewCreator();
~ViewCreator();
- quint32 createView(const quint32 &parentId, const uintptr_t &parentBrowsingContext) override;
+ quint32 createView(const quint32 &parentId, const uintptr_t &parentBrowsingContext, bool hidden) override;
static std::shared_ptr<ViewCreator> instance();
@@ -54,9 +54,10 @@ ViewCreator::~ViewCreator()
SailfishOS::WebEngine::instance()->setViewCreator(nullptr);
}
-quint32 ViewCreator::createView(const quint32 &parentId, const uintptr_t &parentBrowsingContext)
+quint32 ViewCreator::createView(const quint32 &parentId, const uintptr_t &parentBrowsingContext, bool hidden)
{
Q_UNUSED(parentBrowsingContext)
+ Q_UNUSED(hidden)
for (RawWebView *view : views) {
if (view->uniqueId() == parentId) {
Having fixed all this, I've built and transferred the new packages over to my phone. Now when I run the harbour-webview example app I get something quite different to the crash we were seeing before:
[defaultuser@Xperia10III gecko]$ harbour-webview
[D] unknown:0 - QML debugging is enabled. Only use this in a safe environment.
[D] main:30 - WebView Example
[D] main:44 - Using default start URL: "https://www.flypig.co.uk/search/"
[D] main:47 - Opening webview
[D] unknown:0 - Using Wayland-EGL
library "libutils.so" not found
library "libcutils.so" not found
library "libhardware.so" not found
library "android.hardware.graphics.mapper@2.0.so" not found
library "android.hardware.graphics.mapper@2.1.so" not found
library "android.hardware.graphics.mapper@3.0.so" not found
library "android.hardware.graphics.mapper@4.0.so" not found
library "libc++.so" not found
library "libhidlbase.so" not found
library "libgralloctypes.so" not found
library "android.hardware.graphics.common@1.2.so" not found
library "libion.so" not found
library "libz.so" not found
library "libhidlmemory.so" not found
library "android.hidl.memory@1.0.so" not found
library "vendor.qti.qspmhal@1.0.so" not found
greHome from GRE_HOME:/usr/bin
libxul.so is not found, in /usr/bin/libxul.so
Created LOG for EmbedLiteTrace
[W] unknown:7 - file:///usr/share/harbour-webview/qml/harbour-webview.qml:7:30:
Type WebViewPage unavailable
initialPage: Component { WebViewPage { } }
^
[W] unknown:13 - file:///usr/share/harbour-webview/qml/pages/
WebViewPage.qml:13:5: Type WebView unavailable
WebView {
^
[W] unknown:141 - file:///usr/lib64/qt5/qml/Sailfish/WebView/WebView.qml:141:9:
Type TextSelectionController unavailable
TextSelectionController {
^
[W] unknown:14 - file:///usr/lib64/qt5/qml/Sailfish/WebView/Controls/
TextSelectionController.qml:14:1: module "QOfono" is not installed
import QOfono 0.2
^
Created LOG for EmbedLite
JSComp: EmbedLiteConsoleListener.js loaded
JSComp: ContentPermissionManager.js loaded
JSComp: EmbedLiteChromeManager.js loaded
JSComp: EmbedLiteErrorPageHandler.js loaded
JSComp: EmbedLiteFaviconService.js loaded
JSComp: EmbedLiteGlobalHelper.js loaded
EmbedLiteGlobalHelper app-startup
JSComp: EmbedLiteOrientationChangeHandler.js loaded
JSComp: EmbedLiteSearchEngine.js loaded
JSComp: EmbedLiteSyncService.js loaded
EmbedLiteSyncService app-startup
JSComp: EmbedLiteWebrtcUI.js: loaded
JSComp: EmbedLiteWebrtcUI.js: got app-startup
JSComp: EmbedPrefService.js loaded
EmbedPrefService app-startup
JSComp: EmbedliteDownloadManager.js loaded
JSComp: LoginsHelper.js loaded
JSComp: PrivateDataManager.js loaded
JSComp: UserAgentOverrideHelper.js loaded
UserAgentOverrideHelper app-startup
CONSOLE message:
[JavaScript Error: "Unexpected event profile-after-change" {file:
"resource://gre/modules/URLQueryStrippingListService.jsm" line: 228}]
observe@resource://gre/modules/URLQueryStrippingListService.jsm:228:12
Created LOG for EmbedPrefs
No crash, several errors, but (of course) still a blank screen: no actual rendering taking place. But this is still really good progress. The WebView application which was completely crashing before, is now running, just not rendering. That means we now have the opportunity to debug and fix it. One more step forwards.I'll look into the rendering more tomorrow.
If you'd like to read any of my other gecko diary entries, they're all available on my Gecko-dev Diary page.
20 Feb 2024 : Day 162 #
Yesterday we were looking in to the WebView rendering pipeline. We got to the point where we had a backtrace showing the flow that resulted in a WebRender layer manager being created, when the EmbedLite code was expecting a Client layer manager. The consequence was that the EmbedLite code forcefully killed itself.
That was on ESR 91. Today I want to find the equivalent flow on ESR 78 to see how it differs. To do this I need to first install the same harbour-webview-example code that I'm using for testing on my ESR 78 device. Then set it off with the debugger:
The options structure and its functionality is defined in CompositorOptions.h. Checking through the code there we can see that mUseWebRender is set at initialisation, either to the default value of false if the default constructor is used, or an explicit value if the following constructor overload is used:
For both ESR 78 and ESR 91, the value that's passed in is that of the local enableWR variable. The logic for this value is really straightforward for ESR 78:
Let's find out which is responsible.
The value of enableWR has a much more complex derivation in ESR 91 compared to that in ESR 78. Here's the logic (note that I've simplified the code to remove the unnecessary parts):
So we have a clear difference. In ESR 78 Feature::WEBRENDER is set to false. In ESR 91 the Feature::WEBRENDER_SOFTWARE has been added which is enough for the WebRender layer manager to be enabled.
This is good progress. The next step is to figure out where Feature::WEBRENDER_SOFTWARE is being set to enabled and find out how to disable it. I'll take a look at that tomorrow.
If you'd like to read any of my other gecko diary entries, they're all available on my Gecko-dev Diary page.
Comment
That was on ESR 91. Today I want to find the equivalent flow on ESR 78 to see how it differs. To do this I need to first install the same harbour-webview-example code that I'm using for testing on my ESR 78 device. Then set it off with the debugger:
$ gdb harbour-webview
[...]
(gdb) b nsBaseWidget::CreateCompositorSession
Function "nsBaseWidget::CreateCompositorSession" not defined.
Make breakpoint pending on future shared library load? (y or [n]) y
Breakpoint 1 (nsBaseWidget::CreateCompositorSession) pending.
(gdb) r
[...]
Thread 7 "GeckoWorkerThre" hit Breakpoint 1, nsBaseWidget::
CreateCompositorSession (this=this@entry=0x7f8ccbf3d0, aWidth=1080,
aHeight=2520, aOptionsOut=aOptionsOut@entry=0x7fa7972ac0)
at widget/nsBaseWidget.cpp:1176
1176 int aWidth, int aHeight, CompositorOptions* aOptionsOut) {
(gdb) n
1180 CreateCompositorVsyncDispatcher();
(gdb) n
1182 gfx::GPUProcessManager* gpu = gfx::GPUProcessManager::Get();
(gdb) n
1186 gpu->EnsureGPUReady();
(gdb) n
67 obj-build-mer-qt-xr/dist/include/mozilla/StaticPtr.h:
No such file or directory.
(gdb) n
1193 bool enableAPZ = UseAPZ();
(gdb) n
1194 CompositorOptions options(enableAPZ, enableWR);
(gdb) n
1198 bool enableAL =
(gdb) n
1203 options.SetUseWebGPU(StaticPrefs::dom_webgpu_enabled());
(gdb) n
50 obj-build-mer-qt-xr/dist/include/mozilla/layers/CompositorOptions.h:
No such file or directory.
(gdb) n
1210 options.SetInitiallyPaused(CompositorInitiallyPaused());
(gdb) n
53 obj-build-mer-qt-xr/dist/include/mozilla/layers/CompositorOptions.h:
No such file or directory.
(gdb)
39 in obj-build-mer-qt-xr/dist/include/mozilla/layers/CompositorOptions.h
(gdb)
1217 lm = new ClientLayerManager(this);
(gdb) p enableWR
$1 = false
(gdb) p enableAPZ
$2 = <optimized out>
(gdb) p enableAL
$3 = <optimized out>
(gdb) p gfx::gfxConfig::IsEnabled(gfx::Feature::ADVANCED_LAYERS)
$4 = false
(gdb) p mFissionWindow
$5 = false
(gdb) p StaticPrefs::layers_advanced_fission_enabled()
No symbol "layers_advanced_fission_enabled" in namespace "mozilla::StaticPrefs".
(gdb) p StaticPrefs::dom_webgpu_enabled()
$6 = false
(gdb) p options.UseWebRender()
Cannot evaluate function -- may be inlined
(gdb) p options
$7 = {mUseAPZ = true, mUseWebRender = false, mUseAdvancedLayers = false,
mUseWebGPU = false, mInitiallyPaused = false}
(gdb)
As we can see, on ESR 78 things are different: the options.mUseWebRender field is set to false compared to ESR 91 where it's set to true. What's feeding in to these values?The options structure and its functionality is defined in CompositorOptions.h. Checking through the code there we can see that mUseWebRender is set at initialisation, either to the default value of false if the default constructor is used, or an explicit value if the following constructor overload is used:
CompositorOptions(bool aUseAPZ, bool aUseWebRender,
bool aUseSoftwareWebRender)
: mUseAPZ(aUseAPZ),
mUseWebRender(aUseWebRender),
mUseSoftwareWebRender(aUseSoftwareWebRender) {
MOZ_ASSERT_IF(aUseSoftwareWebRender, aUseWebRender);
}
It's never changed after that. So going back to our nsBaseWidget::CreateCompositorSession() code, the only part we need to concern ourselves with is the value that's passed in to the constructor.For both ESR 78 and ESR 91, the value that's passed in is that of the local enableWR variable. The logic for this value is really straightforward for ESR 78:
bool enableWR =
gfx::gfxVars::UseWebRender() && WidgetTypeSupportsAcceleration();
Let's find out how this value is being set:
(gdb) p WidgetTypeSupportsAcceleration() $8 = true (gdb) p gfx::gfxVars::UseWebRender() Cannot evaluate function -- may be inlinedWe can't call the UseWebRender() method directly, but we can extract the value it would return by digging into the data structures. This is all following from the code in gfxVars.h:
(gdb) p gfx::gfxVars::sInstance.mRawPtr.mVarUseWebRender.mValue $11 = falseThat's useful, but it doesn't tell us everything we need to know. The next step is to find out where and why this value is being set to false.
$ grep -rIn "gfxVars::SetUseWebRender(" * --include="*.cpp"
gecko-dev/gfx/thebes/gfxPlatform.cpp:2750: gfxVars::SetUseWebRender(true);
gecko-dev/gfx/thebes/gfxPlatform.cpp:3297: gfxVars::SetUseWebRender(false);
gecko-dev/gfx/ipc/GPUProcessManager.cpp:479: gfx::gfxVars::SetUseWebRender(false);
These are being set in gfxPlatform::InitWebRenderConfig(), gfxPlatform::NotifyGPUProcessDisabled() and GPUProcessManager::DisableWebRender() respectively.Let's find out which is responsible.
(gdb) delete break
Delete all breakpoints? (y or n) y
(gdb) break gfxPlatform::InitWebRenderConfig
Breakpoint 2 at 0x7fb9013328: file gfx/thebes/gfxPlatform.cpp, line 2691.
(gdb) b gfxPlatform::NotifyGPUProcessDisabled
Breakpoint 3 at 0x7fb9016fb0: file gfx/thebes/gfxPlatform.cpp, line 3291.
(gdb) b GPUProcessManager::DisableWebRender
Breakpoint 4 at 0x7fb907f858: GPUProcessManager::DisableWebRender. (3 locations)
(gdb) r
The program being debugged has been started already.
Start it from the beginning? (y or n) y
Starting program: /usr/bin/harbour-webview
[...]
Thread 7 "GeckoWorkerThre" hit Breakpoint 2, gfxPlatform::InitWebRenderConfig
(this=0x7f8c8bbf60)
at gfx/thebes/gfxPlatform.cpp:2691
2691 void gfxPlatform::InitWebRenderConfig() {
(gdb) n
2692 bool prefEnabled = WebRenderPrefEnabled();
(gdb) n
2693 bool envvarEnabled = WebRenderEnvvarEnabled();
(gdb) n
2698 gfxVars::AddReceiver(&nsCSSProps::GfxVarReceiver());
(gdb) n
2708 ScopedGfxFeatureReporter reporter("WR", prefEnabled || envvarEnabled);
(gdb) n
2709 if (!XRE_IsParentProcess()) {
(gdb) n
2723 gfxConfigManager manager;
(gdb) n
2725 manager.ConfigureWebRender();
(gdb) n
2733 if (Preferences::GetBool("gfx.webrender.program-binary-disk", false)) {
(gdb) n
2738 if (StaticPrefs::gfx_webrender_use_optimized_shaders_AtStartup()) {
(gdb) n
2739 gfxVars::SetUseWebRenderOptimizedShaders(
(gdb) n
2743 if (Preferences::GetBool("gfx.webrender.software", false)) {
(gdb) p gfxConfig::IsEnabled(Feature::WEBRENDER)
$12 = false
(gdb) n
2749 if (gfxConfig::IsEnabled(Feature::WEBRENDER)) {
(gdb) n
2791 if (gfxConfig::IsEnabled(Feature::WEBRENDER_COMPOSITOR)) {
(gdb) p gfxConfig::IsEnabled(Feature::WEBRENDER_COMPOSITOR)
$13 = false
(gdb) n
2795 Telemetry::ScalarSet(
(gdb) n
2799 if (gfxConfig::IsEnabled(Feature::WEBRENDER_PARTIAL)) {
(gdb) n
2805 gfxVars::SetUseGLSwizzle(
(gdb) n
2810 gfxUtils::RemoveShaderCacheFromDiskIfNecessary();
(gdb) r
[...]
No other breakpoints are hit. So as we can see here, on ESR 78 the value for UseWebRender() is left as the default value of false. The reason for this is that gfxConfig::IsEnabled(Feature::WEBRENDER) is returning false. We might need to investigate further where this Feature::WEBRENDER configuration value is coming from or being set, but let's switch to ESR 91 now to find out how things are happening there.The value of enableWR has a much more complex derivation in ESR 91 compared to that in ESR 78. Here's the logic (note that I've simplified the code to remove the unnecessary parts):
bool supportsAcceleration = WidgetTypeSupportsAcceleration();
bool enableWR;
if (supportsAcceleration ||
StaticPrefs::gfx_webrender_unaccelerated_widget_force()) {
enableWR = gfx::gfxVars::UseWebRender();
} else if (gfxPlatform::DoesFissionForceWebRender() ||
StaticPrefs::
gfx_webrender_software_unaccelerated_widget_allow()) {
enableWR = gfx::gfxVars::UseWebRender();
} else {
enableWR = false;
}
In practice supportsAcceleration is going to be set to true, which simplifies things and brings us back to this condition:
enableWR = gfx::gfxVars::UseWebRender();
Let's follow the same investigatory path that we did for ESR 78.
$ grep -rIn "gfxVars::SetUseWebRender(" * --include="*.cpp"
gecko-dev/gfx/thebes/gfxPlatform.cpp:2713: gfxVars::SetUseWebRender(true);
gecko-dev/gfx/thebes/gfxPlatform.cpp:3435: gfxVars::SetUseWebRender(true);
gecko-dev/gfx/thebes/gfxPlatform.cpp:3475: gfxVars::SetUseWebRender(false);
The second of these appears in some code that's compile-time conditional on the platform being Windows XP, so we can ignore it. The other two appear in gfxPlatform::InitWebRenderConfig() and gfxPlatform::FallbackFromAcceleration() respectively. I'm going to go out on a limb and say that we're interested in the former, but let's check using the debugger to make sure.
(gdb) delete break
Delete all breakpoints? (y or n) y
(gdb) b gfxPlatform::InitWebRenderConfig
Breakpoint 7 at 0x7ff12ef954: file gfx/thebes/gfxPlatform.cpp, line 2646.
(gdb) b gfxPlatform::FallbackFromAcceleration
Breakpoint 8 at 0x7ff12f3048: file gfx/thebes/gfxPlatform.cpp, line 3381.
(gdb) r
The program being debugged has been started already.
Start it from the beginning? (y or n) y
Starting program: /usr/bin/harbour-webview
[...]
Thread 7 "GeckoWorkerThre" hit Breakpoint 7, gfxPlatform::InitWebRenderConfig
(this=0x7fc4a48c90)
at gfx/thebes/gfxPlatform.cpp:2646
2646 void gfxPlatform::InitWebRenderConfig() {
(gdb) n
2647 bool prefEnabled = WebRenderPrefEnabled();
(gdb) n
2648 bool envvarEnabled = WebRenderEnvvarEnabled();
(gdb)
[New LWP 27297]
2653 gfxVars::AddReceiver(&nsCSSProps::GfxVarReceiver());
(gdb)
2663 ScopedGfxFeatureReporter reporter("WR", prefEnabled || envvarEnabled);
(gdb)
32 ${PROJECT}/obj-build-mer-qt-xr/dist/include/gfxCrashReporterUtils.h:
No such file or directory.
(gdb)
2664 if (!XRE_IsParentProcess()) {
(gdb)
2678 gfxConfigManager manager;
(gdb)
2679 manager.Init();
(gdb)
2680 manager.ConfigureWebRender();
(gdb)
2682 bool hasHardware = gfxConfig::IsEnabled(Feature::WEBRENDER);
(gdb)
2683 bool hasSoftware = gfxConfig::IsEnabled(Feature::WEBRENDER_SOFTWARE);
(gdb)
2684 bool hasWebRender = hasHardware || hasSoftware;
(gdb) p hasHardware
$10 = false
(gdb) p hasSoftware
$11 = true
(gdb) p hasWebRender
$12 = <optimized out>
(gdb) n
2701 if (gfxConfig::IsEnabled(Feature::WEBRENDER_SHADER_CACHE)) {
(gdb) n
2705 gfxVars::SetUseWebRenderOptimizedShaders(
(gdb) n
2708 gfxVars::SetUseSoftwareWebRender(!hasHardware && hasSoftware);
(gdb) n
2712 if (hasWebRender) {
(gdb) n
2713 gfxVars::SetUseWebRender(true);
(gdb) c
[...]
So there we can see that the WebRender layer manager is being activated in ESR 91 due to Feature::WEBRENDER_SOFTWARE being enabled.So we have a clear difference. In ESR 78 Feature::WEBRENDER is set to false. In ESR 91 the Feature::WEBRENDER_SOFTWARE has been added which is enough for the WebRender layer manager to be enabled.
This is good progress. The next step is to figure out where Feature::WEBRENDER_SOFTWARE is being set to enabled and find out how to disable it. I'll take a look at that tomorrow.
If you'd like to read any of my other gecko diary entries, they're all available on my Gecko-dev Diary page.
19 Feb 2024 : Day 161 #
Yesterday I was complaining about the difficulty debugging while travelling by train. Before I'd even posted the diary entry I'd received some beautiful new creations from Thigg to illustrate my experiences. I think he's captured it rather too well and it's a real joy to be able to share this creation with you.

This is just so great! But although this was the most representative, it wasn't my favourite of the images Thigg created. I'll be sharing some of the others at other times when I have the pleasure of enjoying train-based-development, so watch out for more!
On to a fresh day, and this morning the package I started building yesterday evening on the train has finally finished. But that's not as helpful to me as I was hoping it would be when I kicked it off. The change I made was to annotate the code with some debug output. Since then I've been able to find out all the same information using the debugger.
To recap the situation, we've been looking at WebView rendering. Currently any attempt to use the WebView will result in a crash. That's because the the EmbedLite PuppetWdigetBase code, on discovering that the layer manager is of type LAYERS_WR (Web Renderer) is intentionally triggering a crash. It requires the layer manager to be of type LAYERS_CLIENT to prevent this crash from happening.
So my task for today is to find out where the layer manager is being created and establish why the wrong type is being used. To get a good handle on the situation I'll also need to compare this against the same paths in ESR 78 to find out whey they're different.
Looking through the code there are two obvious places where a WebLayerManager is created. First there's code in PuppetWidget that looks like this:
So we now know that the Web Render version of the layer manager is being created in nsBaseWidget::CreateCompositorSession(). There are two questions that immediately spring to mind: first, if the Client version of the layer manager were being created at this point, would it fix things? Second, is it possible to run with the Web Render layer manager instead?
I also want to know exactly what inputs are being used to decide which type of layer manager to use. Stepping through the nsBaseWidget::CreateCompositorSession() is likely to help with this, so let's give that a go.
If you'd like to read any of my other gecko diary entries, they're all available on my Gecko-dev Diary page.
Comment

This is just so great! But although this was the most representative, it wasn't my favourite of the images Thigg created. I'll be sharing some of the others at other times when I have the pleasure of enjoying train-based-development, so watch out for more!
On to a fresh day, and this morning the package I started building yesterday evening on the train has finally finished. But that's not as helpful to me as I was hoping it would be when I kicked it off. The change I made was to annotate the code with some debug output. Since then I've been able to find out all the same information using the debugger.
To recap the situation, we've been looking at WebView rendering. Currently any attempt to use the WebView will result in a crash. That's because the the EmbedLite PuppetWdigetBase code, on discovering that the layer manager is of type LAYERS_WR (Web Renderer) is intentionally triggering a crash. It requires the layer manager to be of type LAYERS_CLIENT to prevent this crash from happening.
So my task for today is to find out where the layer manager is being created and establish why the wrong type is being used. To get a good handle on the situation I'll also need to compare this against the same paths in ESR 78 to find out whey they're different.
Looking through the code there are two obvious places where a WebLayerManager is created. First there's code in PuppetWidget that looks like this:
bool PuppetWidget::CreateRemoteLayerManager(
const std::function<bool(LayerManager*)>& aInitializeFunc) {
RefPtr<LayerManager> lm;
MOZ_ASSERT(mBrowserChild);
if (mBrowserChild->GetCompositorOptions().UseWebRender()) {
lm = new WebRenderLayerManager(this);
} else {
lm = new ClientLayerManager(this);
}
[...]
Second there's some code in nsBaseWidget that looks like this (I've left some of the comments in, since they're relevant):
already_AddRefed<LayerManager> nsBaseWidget::CreateCompositorSession(
int aWidth, int aHeight, CompositorOptions* aOptionsOut) {
[...]
gfx::GPUProcessManager* gpu = gfx::GPUProcessManager::Get();
// Make sure GPU process is ready for use.
// If it failed to connect to GPU process, GPU process usage is disabled in
// EnsureGPUReady(). It could update gfxVars and gfxConfigs.
gpu->EnsureGPUReady();
// If widget type does not supports acceleration, we may be allowed to use
// software WebRender instead. If not, then we use ClientLayerManager even
// when gfxVars::UseWebRender() is true. WebRender could coexist only with
// BasicCompositor.
[...]
RefPtr<LayerManager> lm;
if (options.UseWebRender()) {
lm = new WebRenderLayerManager(this);
} else {
lm = new ClientLayerManager(this);
}
[...]
It should be pretty easy to check using the debugger whether either of these are the relevant routes when setting up the layer manager. I still have the debugging session open from yesterday:
(gdb) break nsBaseWidget.cpp:1364
Breakpoint 3 at 0x7ff2a57b64: file widget/nsBaseWidget.cpp, line 1364.
(gdb) break PuppetWidget.cpp:616
Breakpoint 4 at 0x7ff2a67d48: file widget/PuppetWidget.cpp, line 616.
(gdb) r
The program being debugged has been started already.
Start it from the beginning? (y or n) y
Starting program: /usr/bin/harbour-webview
[...]
Created LOG for EmbedLiteLayerManager
Thread 7 "GeckoWorkerThre" hit Breakpoint 3, nsBaseWidget::
CreateCompositorSession (this=this@entry=0x7fc4dad520,
aWidth=aWidth@entry=1080, aHeight=aHeight@entry=2520,
aOptionsOut=aOptionsOut@entry=0x7fd7da7770)
at widget/nsBaseWidget.cpp:1364
1364 options.SetInitiallyPaused(CompositorInitiallyPaused());
(gdb) n
43 ${PROJECT}/obj-build-mer-qt-xr/dist/include/mozilla/layers/
CompositorOptions.h: No such file or directory.
(gdb)
1369 lm = new WebRenderLayerManager(this);
(gdb) p options
$4 = {mUseAPZ = true, mUseWebRender = true, mUseSoftwareWebRender = true,
mAllowSoftwareWebRenderD3D11 = false, mAllowSoftwareWebRenderOGL = false,
mUseAdvancedLayers = false, mUseWebGPU = false, mInitiallyPaused = false}
(gdb)
The options structure is really clean and it's helpful to be able to see all of the contents like this.So we now know that the Web Render version of the layer manager is being created in nsBaseWidget::CreateCompositorSession(). There are two questions that immediately spring to mind: first, if the Client version of the layer manager were being created at this point, would it fix things? Second, is it possible to run with the Web Render layer manager instead?
I also want to know exactly what inputs are being used to decide which type of layer manager to use. Stepping through the nsBaseWidget::CreateCompositorSession() is likely to help with this, so let's give that a go.
(gdb) delete break
Delete all breakpoints? (y or n) y
(gdb) break nsBaseWidget::CreateCompositorSession
Breakpoint 5 at 0x7ff2a578f8: file widget/nsBaseWidget.cpp, line 1308.
(gdb) r
The program being debugged has been started already.
Start it from the beginning? (y or n) y
Starting program: /usr/bin/harbour-webview
[...]
Thread 7 "GeckoWorkerThre" hit Breakpoint 5, nsBaseWidget::
CreateCompositorSession (this=this@entry=0x7fc4db8a30,
aWidth=aWidth@entry=1080, aHeight=aHeight@entry=2520,
aOptionsOut=aOptionsOut@entry=0x7fd7da7770)
at widget/nsBaseWidget.cpp:1308
1308 int aWidth, int aHeight, CompositorOptions* aOptionsOut) {
(gdb) n
1312 CreateCompositorVsyncDispatcher();
(gdb) n
1314 gfx::GPUProcessManager* gpu = gfx::GPUProcessManager::Get();
(gdb) n
1318 gpu->EnsureGPUReady();
(gdb) n
1324 bool supportsAcceleration = WidgetTypeSupportsAcceleration();
(gdb) n
1327 if (supportsAcceleration ||
(gdb) n
1329 enableWR = gfx::gfxVars::UseWebRender();
(gdb) n
195 ${PROJECT}/obj-build-mer-qt-xr/dist/include/mozilla/gfx/gfxVars.h:
No such file or directory.
(gdb) n
1338 bool enableAPZ = UseAPZ();
(gdb) n
1339 CompositorOptions options(enableAPZ, enableWR, enableSWWR);
(gdb) p supportsAcceleration
$8 = <optimized out>
(gdb) p enableAPZ
$5 = true
(gdb) p enableWR
$6 = true
(gdb) p enableSWWR
$7 = true
(gdb) n
1357 options.SetUseWebGPU(StaticPrefs::dom_webgpu_enabled());
(gdb) p StaticPrefs::dom_webgpu_enabled()
$9 = false
(gdb) n
mozilla::Atomic<bool, (mozilla::MemoryOrdering)0, void>::operator bool
(this=<optimized out>)
at ${PROJECT}/obj-build-mer-qt-xr/dist/include/mozilla/layers/
CompositorOptions.h:67
67 ${PROJECT}/obj-build-mer-qt-xr/dist/include/mozilla/layers/
CompositorOptions.h: No such file or directory.
(gdb) n
nsBaseWidget::CreateCompositorSession (this=this@entry=0x7fc4db8a30,
aWidth=aWidth@entry=1080, aHeight=aHeight@entry=2520,
aOptionsOut=aOptionsOut@entry=0x7fd7da7770)
at widget/nsBaseWidget.cpp:1364
1364 options.SetInitiallyPaused(CompositorInitiallyPaused());
(gdb) n
43 ${PROJECT}/obj-build-mer-qt-xr/dist/include/mozilla/layers/
CompositorOptions.h: No such file or directory.
(gdb) n
1369 lm = new WebRenderLayerManager(this);
(gdb)
That gives us some things to work with, but to actually dig into what this all means will have to wait until the morning.If you'd like to read any of my other gecko diary entries, they're all available on my Gecko-dev Diary page.
18 Feb 2024 : Day 160 #
It's been a long couple of days running an event at work, but now I'm on the train heading home and looking forward to a change of focus for a bit.
And part of that is getting the opportunity to take a look at the backtrace generated yesterday for the WebView rendering pipeline. I won't copy it out again in full, but it might be worth giving a high-level summary.
It would be nice to know what value is actually being returned, but it looks like this will be easier said than done with the code in its present form. There's nowhere to place the required breakpoint and no variable to extract it from. The LayerManager is an interface and it's not clear what will be inheriting it at this point.
While I'm on the train it's also particularly challenging for me to do any debugging. It is technically possible and I've done it before, but it requires me to attach USB cables between my devices, which is fine until I lose track of time and find I've arrived at my destination. I prefer to spend my time on the train coding, or reviewing code, if I can.
So I'm going to examine the code visually first. So let's suppose it's EmbedLiteAppProcessParentManager that's inheriting from LayerManager. This isn't an absurd suggestion, it's quite possibly the case. So then the value returned will be a constant:
In the meantime, let's continue with our thought that the layer manager is of type EmbedLiteAppProcessParentManager and that the method is therefore returning LAYERS_OPENGL. The enum in LayersTypes.h shows that this definitely takes a different value from LAYERS_CLIENT:
I'll need to check if either the return value or the test condition has changed since ESR 78. But the other possibility is that it's something else inheriting the LayerManager class.
[...]
Now I'm back home and have access to the debugger. The code is still building — no surprise there — so while I wait let's attache the debugger and see what it throws up.
Tomorrow I must find out where the layer manager is being created and also what the layer manager type is on ERS 78 for comparison.
If you'd like to read any of my other gecko diary entries, they're all available on my Gecko-dev Diary page.
Comment
And part of that is getting the opportunity to take a look at the backtrace generated yesterday for the WebView rendering pipeline. I won't copy it out again in full, but it might be worth giving a high-level summary.
#0 PuppetWidgetBase::Invalidate (this=0x7fc4dac130, aRect=...)
at mobile/sailfishos/embedshared/PuppetWidgetBase.cpp:274
#1 PuppetWidgetBase::UpdateBounds (...)
at mobile/sailfishos/embedshared/PuppetWidgetBase.cpp:395
#2 EmbedLiteWindowChild::CreateWidget (this=0x7fc4d626d0)
at xpcom/base/nsCOMPtr.h:851
#3 RunnableMethodArguments<>::applyImpl...
at obj-build-mer-qt-xr/dist/include/nsThreadUtils.h:1151
[...]
#28 0x0000007ff6a0489c in ?? () from /lib64/libc.so.6
Now that I've mentally parsed the backtrace, it's clearly not as useful as I was hoping. But it is something to go on. The line that's causing the crash is the one with MOZ_CRASH() in it below.
void
PuppetWidgetBase::Invalidate(const LayoutDeviceIntRect &aRect)
{
[...]
if (mozilla::layers::LayersBackend::LAYERS_CLIENT == lm->GetBackendType()) {
// No need to do anything, the compositor will handle drawing
} else {
MOZ_CRASH("Unexpected layer manager type");
}
[...]
That means that lm->GetBackendType() is returning something other than LAYERS_CLIENT.It would be nice to know what value is actually being returned, but it looks like this will be easier said than done with the code in its present form. There's nowhere to place the required breakpoint and no variable to extract it from. The LayerManager is an interface and it's not clear what will be inheriting it at this point.
While I'm on the train it's also particularly challenging for me to do any debugging. It is technically possible and I've done it before, but it requires me to attach USB cables between my devices, which is fine until I lose track of time and find I've arrived at my destination. I prefer to spend my time on the train coding, or reviewing code, if I can.
So I'm going to examine the code visually first. So let's suppose it's EmbedLiteAppProcessParentManager that's inheriting from LayerManager. This isn't an absurd suggestion, it's quite possibly the case. So then the value returned will be a constant:
virtual mozilla::layers::LayersBackend GetBackendType() override {
return LayersBackend::LAYERS_OPENGL; }
Again, there's nothing to hang a breakpoint from there. So I've added a debug output so the value can be extracted explicitly.
LOGW("WEBVIEW: Invalidate LAYERS_CLIENT: %d", lm->GetBackendType());
if (mozilla::layers::LayersBackend::LAYERS_CLIENT == lm->GetBackendType()) {
// No need to do anything, the compositor will handle drawing
} else {
MOZ_CRASH("Unexpected layer manager type");
}
There's nothing wrong with this approach, except that it requires a rebuild of the code, which I've just set going. Hopefully it'll forge through the changes swiftly.In the meantime, let's continue with our thought that the layer manager is of type EmbedLiteAppProcessParentManager and that the method is therefore returning LAYERS_OPENGL. The enum in LayersTypes.h shows that this definitely takes a different value from LAYERS_CLIENT:
enum class LayersBackend : int8_t {
LAYERS_NONE = 0,
LAYERS_BASIC,
LAYERS_OPENGL,
LAYERS_D3D11,
LAYERS_CLIENT,
LAYERS_WR,
LAYERS_LAST
};
Which does make me wonder how this has come about. Isn't it inevitable that the code will crash in this case?I'll need to check if either the return value or the test condition has changed since ESR 78. But the other possibility is that it's something else inheriting the LayerManager class.
[...]
Now I'm back home and have access to the debugger. The code is still building — no surprise there — so while I wait let's attache the debugger and see what it throws up.
(gdb) p lm->GetBackendType()
$2 = mozilla::layers::LayersBackend::LAYERS_WR
(gdb) ptype lm
type = class mozilla::layers::LayerManager : public mozilla::layers::FrameRecorder {
protected:
nsAutoRefCnt mRefCnt;
[...]
virtual mozilla::layers::LayersBackend GetBackendType(void);
[...]
protected:
~LayerManager();
[...]
} *
(gdb) p this->GetLayerManager(0, mozilla::layers::LayersBackend::LAYERS_NONE, LAYER_MANAGER_CURRENT)
$2 = (mozilla::layers::LayerManager *) 0x7fc4db1250
Direct examination of the LayerManager doesn't show what the original object type is that's inheriting it. But there is a trick you can do with gdb to get it to tell you:
(gdb) set print object on (gdb) p this->GetLayerManager(0, mozilla::layers::LayersBackend::LAYERS_NONE, LAYER_MANAGER_CURRENT) $3 = (mozilla::layers::WebRenderLayerManager *) 0x7fc4db1250 (gdb) set print object offSo the actual type of the layer manager is WebRenderLayerManager. This is clearly a problem, because this will always return LAYERS_WR as its backend type:
LayersBackend GetBackendType() override { return LayersBackend::LAYERS_WR; }
All this debugging has been useful; so useful in fact that it's made the debug prints I added on the train completely redundant. No matter, I'll leave the build running anyway.Tomorrow I must find out where the layer manager is being created and also what the layer manager type is on ERS 78 for comparison.
If you'd like to read any of my other gecko diary entries, they're all available on my Gecko-dev Diary page.
17 Feb 2024 : Day 159 #
I've been working through a singular bug stack for so long now that it feels strange to have a completely open ended set of possibilities for which direction to go next. We had a small diversion yesterday into creating random grids of avatars but before that were focused for a while on the task of getting DuckDuckGo working. Today I have to make some new decisions about where to go next.
There are two things I'd really like to look into. While working on the browser over the last weeks it's been stable enough to use pretty successfully as a browser. But occasionally the renderer crashes out completely, pulling the browser down, for no obvious reason. It's sporadic enough that there's no obvious cause. But if I could get a backtrace from the crash that might be enough to start looking in to it.
So my first option is looking in to these sporadic crashes. They're not nice for users and might signify a deeper issue.
The second option is fixing the webview rendering pipeline. That needs a little explanation. On Sailfish OS the browser is used in one of two ways, either as a web browser, or as a webview embedded in some other application.
The best example of this is the email client which uses the webview to render messages. These often contain HTML, so it makes perfect sense to use a good embedded browser rending engine for them.
So these are two different use-cases. But they also happen to have two different rendering pipelines. Currently the browser pipeline works nicely, but the webview pipeline is broken. I'd really like to fix it.
I've decided to go with the native rendering pipeline task first (issue 1043 on GitHub). It's clearly defined, but also potentially a big job, so needs some attention. But if I continue to see browser crashes I may switch focus to those instead.
For the native rendering pipeline the first step is straightforward: install a webview project on my phone. There are plenty out there, but I also have several basic examples already written in the "projects" folder on my laptop, and which I should be able to just build and install on my phone for testing.
Digging through projects I find one called "harbour-webview-example" (sounds promising) with the following as the main page of the app:
If you'd like to read any of my other gecko diary entries, they're all available on my Gecko-dev Diary page.
Comment
There are two things I'd really like to look into. While working on the browser over the last weeks it's been stable enough to use pretty successfully as a browser. But occasionally the renderer crashes out completely, pulling the browser down, for no obvious reason. It's sporadic enough that there's no obvious cause. But if I could get a backtrace from the crash that might be enough to start looking in to it.
So my first option is looking in to these sporadic crashes. They're not nice for users and might signify a deeper issue.
The second option is fixing the webview rendering pipeline. That needs a little explanation. On Sailfish OS the browser is used in one of two ways, either as a web browser, or as a webview embedded in some other application.
The best example of this is the email client which uses the webview to render messages. These often contain HTML, so it makes perfect sense to use a good embedded browser rending engine for them.
So these are two different use-cases. But they also happen to have two different rendering pipelines. Currently the browser pipeline works nicely, but the webview pipeline is broken. I'd really like to fix it.
I've decided to go with the native rendering pipeline task first (issue 1043 on GitHub). It's clearly defined, but also potentially a big job, so needs some attention. But if I continue to see browser crashes I may switch focus to those instead.
For the native rendering pipeline the first step is straightforward: install a webview project on my phone. There are plenty out there, but I also have several basic examples already written in the "projects" folder on my laptop, and which I should be able to just build and install on my phone for testing.
Digging through projects I find one called "harbour-webview-example" (sounds promising) with the following as the main page of the app:
import QtQuick 2.0
import Sailfish.Silica 1.0
import Sailfish.WebView 1.0
import Sailfish.WebEngine 1.0
import uk.co.flypig.webview 1.0
Page {
allowedOrientations: Orientation.All
WebView {
anchors.fill: parent
active: true
url: "http://www.sailfishos.org"
onLinkClicked: {
WebEngine.notifyObservers("exampleTopic", url)
}
}
}
Straightforward. But containing a webview. Attempting to run it, the results sadly aren't good:
$ harbour-webview
[D] unknown:0 - QML debugging is enabled. Only use this in a safe environment.
[...]
JSComp: UserAgentOverrideHelper.js loaded
UserAgentOverrideHelper app-startup
CONSOLE message:
[JavaScript Error: "Unexpected event profile-after-change"
{file: "resource://gre/modules/URLQueryStrippingListService.jsm" line: 228}]
observe@resource://gre/modules/URLQueryStrippingListService.jsm:228:12
Created LOG for EmbedPrefs
Content JS: resource://gre/modules/SearchSettings.jsm, function: get, message:
[JavaScript Warning: "get: No settings file exists, new profile?
NotFoundError: Could not open the file at
.cache/harbour-webview/harbour-webview/.mozilla/search.json.mozlz4"]
Created LOG for EmbedLiteLayerManager
Segmentation fault
There are a couple of JavaScript errors (may or may not be related) and a crash (definitely relevant). Let's see if we can get a backtrace from the crash:
$ gdb harbour-webview
GNU gdb (GDB) Mer (8.2.1+git9)
Copyright (C) 2018 Free Software Foundation, Inc.
[...]
Thread 7 "GeckoWorkerThre" received signal SIGSEGV, Segmentation fault.
[Switching to LWP 12581]
0x0000007ff367c0a8 in mozilla::embedlite::PuppetWidgetBase::Invalidate
(this=0x7fc4dac130, aRect=...)
at mobile/sailfishos/embedshared/PuppetWidgetBase.cpp:274
274 MOZ_CRASH("Unexpected layer manager type");
(gdb) bt
#0 0x0000007ff367c0a8 in mozilla::embedlite::PuppetWidgetBase::Invalidate
(this=0x7fc4dac130, aRect=...)
at mobile/sailfishos/embedshared/PuppetWidgetBase.cpp:274
#1 0x0000007ff368093c in mozilla::embedlite::PuppetWidgetBase::UpdateBounds
(this=0x7fc4dac130, aRepaint=aRepaint@entry=true)
at mobile/sailfishos/embedshared/PuppetWidgetBase.cpp:395
#2 0x0000007ff3689b28 in mozilla::embedlite::EmbedLiteWindowChild::CreateWidget
(this=0x7fc4d626d0)
at xpcom/base/nsCOMPtr.h:851
#3 0x0000007ff367a094 in mozilla::detail::RunnableMethodArguments<>::applyImpl
<mozilla::embedlite::EmbedLiteWindowChild, void
(mozilla::embedlite::EmbedLiteWindowChild::*)()>
(mozilla::embedlite::EmbedLiteWindowChild*, void
(mozilla::embedlite::EmbedLiteWindowChild::*)(), mozilla::Tuple<>&,
std::integer_sequence<unsigned long>) (args=..., m=<optimized out>,
o=<optimized out>)
at ${PROJECT}/obj-build-mer-qt-xr/dist/include/nsThreadUtils.h:1151
[...]
#28 0x0000007ff6a0489c in ?? () from /lib64/libc.so.6
(gdb)
That's definitely something to go on. But unfortunately I'm tight for time today, so digging in to this backtrace will have to wait until tomorrow.If you'd like to read any of my other gecko diary entries, they're all available on my Gecko-dev Diary page.
16 Feb 2024 : Day 158 #
A couple of days back I included a small graphic that showed avatars and usernames of everyone who has helped, commented on, liked, boosted and generally supported this dev diary. Here it is again (because you can never say thank you enough!).
It's actually a slide from my FOSDEM presentation, and while I do like it, that's not the real reason I'm showing it again here. During my presentation I mentioned that it had taken me a long time to create the slide. And that's true. But I thought it might be interesting to find out how it was created. Maybe it could have been done in a simpler, better, or quicker way?
Creating it required four steps:
Let me first give a quick overview of how I collected the data in step one. This did take a long time — longer than I expected — primarily because there were more people interacting with my dev diary than I'd quite appreciated. Initially I collected names from the sailfish forum. There's a thread about the dev diary and I picked up most of the names from there, or from direct messages.
Each user on the forum has an avatar, even if it's been auto-generated by the Discourse forum software. Whenever someone posts their avatar is shown next to their comment. But this is a small version of the avatar. Select the username at the top of a post and a more detailed summary of the account is shown, including a larger version of the same image. Right click on this and it can be saved out to disc.
If you try this you'll notice the avatar is actually a square image, even though it's shown in the forum as circular. A mask is being applied to it on the client side. This will be important for step two.
At this point I also added other users I could think of who, while they may not have made a post on the forum, had nevertheless interacted in important ways with the dev diary. This included many different types of interactions such as comments on IRC or matrix. In this case, I also found their avatars and usernames on the forum.
While doing this I kept a CSV file as I was going along containing two columns: username and avatar filename.
Finally I checked my Mastodon account for all the users who had interacted with my posts there. I stepped through all 149 of my dev diary Mastodon posts (as it was at the time), checking who had favourited, boosted, or replied to a post there. Once again I took a copy of their avatar and added their details to the CSV file.
So far so manual. What I was left with was a directory containing 145 images and a CSV file with 145 rows. Here's the first few rows of the CSV file to give you an idea:
That brings us on to step two, the processing of the avatars (which sounds far more grand than it is). Different avatars were in different formats (jpeg or PNG), with different sizes, but mostly square in shape. They needed to all be the same size, the same format (PNG) and with a circular mask applied.
For this I used the convert tool, which is part of the brilliantImageMagick suite. It performs a vast array of image manipulations all from the command line. Here's just the a small flavour from its help output:
All of the work is done by the convert tool, via this simple addmask.sh script. It's so simple in fact that I can give the entirety of it here without it taking up too much space:
Nevertheless the script lived on in my file system and finally found itself a use. To be honest, I was pretty tight for time writing up my presentation for FOSDEM so I'm not sure if I'd have gone down this route if I didn't already have something to build on. I made some small changes to it to handle resizing, but that was pretty much the only change.
That brings us to step three. Now having a directory full of nicely processed images, I needed them to be arranged on a canvas, ideally in SVG format, so that I could then embed the result on a slide.
Since starting my role as a Research Data Scientist I've been immersed in random Python scripts. Python has the benefit of a huge array of random libraries to draw from, SVG-writing included in the form of the drawsvg 2 project. It is, honestly, a really simple way to generate SVGs quickly and easily. Now that I've tried it I think I'll be using it more often.
My aim was to arrange the avatars and names "randomly" on the page. I started by creating a method that placed a single avatar on the canvas with the username underneath. Getting the scale, font and formatting correct took a little trial and error, but I was happy that the final values all made sense. The drawsvg coordinate system works just as it should!
Arranging them at random requires an algorithm. My first instinct was to arrange them all in a grid, but with a random "jitter" applied. That is, for each image select a random angle and distance and move it by that amount on the page.
The script I created for this is a little too long to show here, but you can check it out on GitHub.
Here's how I ran it:

The avatars have been placed, but the grid formation is still very clear despite the added jitter, plus there's a gap at the end because the number of avatars in total doesn't divide by the number of avatars on each row. I wasn't happy with it.
So I came up with an alternative solution: for each avatar a random location is chosen on the canvas. As each avatar is added its position is stored in an array, then when the next position is chosen it's compared against all of these positions. If it's within a certain distance (60 units) of any of the other points, it's rejected and a new random position is chosen.
Again, you can see this algorithm given in the same file on GitHub. Here's how I ran it:
But I found given enough space to locate the avatars the process actually finished pretty quickly. And since I only need to run it once, not multiple times, that's actually not a problem.
In retrospect a better algorithm would have been to partition the canvas up into a grid of sizes much smaller than an avatar. Ideally it would be one pixel per pixel, but in practice we don't really know what a pixel means in this context. Besides which something approaching this is likely to be fine. Now store a Boolean associated with each of these grid points indicating whether it's available or used.
After placing an avatar mark the pixels around the location in this grid as being used, to the extent that there will be no overlap if another avatar is placed in any of the unused spots. Keep a count of the available locations.
Then a random number can be chosen between zero and the total remaining available locations in order to select the next spot.
I didn't implement this, but in my head it works really well.
Finally step four involved tidying up the files. Some of the avatars and usernames were overlapping so needed a bit of manual tweaking (but thankfully not too much). Plus I also had to manually make room for the "Thank you" text in the top left of the window. This required a bit more manual shuffling of avatars, but it all worked out in the end. I'm quite happy with how it came out.
That's it. Just a little diversion into the scripts used to create the image; I hope it's been of some interest.
There will be more of the usual gecko dev diary tomorrow.
If you'd like to read any of my other gecko diary entries, they're all available on my Gecko-dev Diary page.
Comment
It's actually a slide from my FOSDEM presentation, and while I do like it, that's not the real reason I'm showing it again here. During my presentation I mentioned that it had taken me a long time to create the slide. And that's true. But I thought it might be interesting to find out how it was created. Maybe it could have been done in a simpler, better, or quicker way?
Creating it required four steps:
- Collect the names and avatars.
- Process the avatars.
- Plot the names and avatars on the canvas.
- Tidy things up.
Let me first give a quick overview of how I collected the data in step one. This did take a long time — longer than I expected — primarily because there were more people interacting with my dev diary than I'd quite appreciated. Initially I collected names from the sailfish forum. There's a thread about the dev diary and I picked up most of the names from there, or from direct messages.
Each user on the forum has an avatar, even if it's been auto-generated by the Discourse forum software. Whenever someone posts their avatar is shown next to their comment. But this is a small version of the avatar. Select the username at the top of a post and a more detailed summary of the account is shown, including a larger version of the same image. Right click on this and it can be saved out to disc.
If you try this you'll notice the avatar is actually a square image, even though it's shown in the forum as circular. A mask is being applied to it on the client side. This will be important for step two.
At this point I also added other users I could think of who, while they may not have made a post on the forum, had nevertheless interacted in important ways with the dev diary. This included many different types of interactions such as comments on IRC or matrix. In this case, I also found their avatars and usernames on the forum.
While doing this I kept a CSV file as I was going along containing two columns: username and avatar filename.
Finally I checked my Mastodon account for all the users who had interacted with my posts there. I stepped through all 149 of my dev diary Mastodon posts (as it was at the time), checking who had favourited, boosted, or replied to a post there. Once again I took a copy of their avatar and added their details to the CSV file.
So far so manual. What I was left with was a directory containing 145 images and a CSV file with 145 rows. Here's the first few rows of the CSV file to give you an idea:
000exploit, 000exploit.png aerique, aerique.png Adrian McEwen, amcewen.png ApB, apb.png Adam T, atib.png [...]You'll notice that it's in alphabetical order. That's because after collecting all the details I ran it through sort on the command line.
That brings us on to step two, the processing of the avatars (which sounds far more grand than it is). Different avatars were in different formats (jpeg or PNG), with different sizes, but mostly square in shape. They needed to all be the same size, the same format (PNG) and with a circular mask applied.
For this I used the convert tool, which is part of the brilliant
$ convert --help
Version: ImageMagick 6.9.11-60 Q16 x86_64 2021-01-25 https://imagemagick.org
Copyright: (C) 1999-2021 ImageMagick Studio LLC
License: https://imagemagick.org/script/license.php
Features: Cipher DPC Modules OpenMP(4.5)
Delegates (built-in): bzlib djvu fftw fontconfig freetype heic jbig jng jp2
jpeg lcms lqr ltdl lzma openexr pangocairo png tiff webp wmf x xml zlib
Usage: convert-im6.q16 [options ...] file [ [options ...] file ...]
[options ...] file
Image Settings:
-adjoin join images into a single multi-image file
-affine matrix affine transform matrix
-alpha option activate, deactivate, reset, or set the alpha channel
-antialias remove pixel-aliasing
-authenticate password
decipher image with this password
-attenuate value lessen (or intensify) when adding noise to an image
[...]
Happily for me, all three of my desired conversions (changing format, changing size, applying a mask) were available using the tool. I put together a very simple bash script which cycles through all of the files with a given format in a folder, processes them in the way that was needed and then output them to a different folder with a suffix added to the filename.All of the work is done by the convert tool, via this simple addmask.sh script. It's so simple in fact that I can give the entirety of it here without it taking up too much space:
SUFFIX_FROM=$1
OUT_FOLDER=$2
SUFFIX_TO=$3
set -e
if [ $# -ne 3 ]; then
echo "Syntax: " $0 "<extension-in> <out-folder> <out-suffix>"
exit 0
fi
SUFFIX_FROM_DOT="${SUFFIX_FROM}."
echo "Converting <image>.$SUFFIX_FROM images to <image>-$SUFFIX_TO.png"
echo
for name in *.$SUFFIX_FROM; do
newname="${name%.*}$SUFFIX_TO.png"
echo "Converting $name to $OUT_FOLDER/$newname"
convert "$name" masks/mask.png -sample 240x240 -alpha Off -compose \
CopyOpacity -composite -density 180 -background transparent \
"$OUT_FOLDER/$newname"
done
I then called it a couple of times inside the folder with the images to produce the results needed:
$ ./addmask.sh png masked -masked $ ./addmask.sh jpg masked -maskedAfter processing, each of the updated images is given a new name, so I had to perform a regex search and replace on my CSV file to update them appropriately. The file now looks like this:
000exploit, 000exploit-masked.png aerique, aerique-masked.png Adrian McEwen, amcewen-masked.png ApB, apb-masked.png Adam T, atib-masked.png [...]I have to admit that I cheated a bit with this script. I originally wrote it back in September 2022 for Jolla's "Sailing for Ten Years" party held in Berlin on 14th October of the same year. Nico Cartron wrote up a nice summary of the event in the Sailfish Community News at the time. I was asked to give a presentation at the event; one of the slides I created for it was a thank you slide not unlike the one above. In that case it was for translators and apps, but it never actually got used during the event.
Nevertheless the script lived on in my file system and finally found itself a use. To be honest, I was pretty tight for time writing up my presentation for FOSDEM so I'm not sure if I'd have gone down this route if I didn't already have something to build on. I made some small changes to it to handle resizing, but that was pretty much the only change.
That brings us to step three. Now having a directory full of nicely processed images, I needed them to be arranged on a canvas, ideally in SVG format, so that I could then embed the result on a slide.
Since starting my role as a Research Data Scientist I've been immersed in random Python scripts. Python has the benefit of a huge array of random libraries to draw from, SVG-writing included in the form of the drawsvg 2 project. It is, honestly, a really simple way to generate SVGs quickly and easily. Now that I've tried it I think I'll be using it more often.
My aim was to arrange the avatars and names "randomly" on the page. I started by creating a method that placed a single avatar on the canvas with the username underneath. Getting the scale, font and formatting correct took a little trial and error, but I was happy that the final values all made sense. The drawsvg coordinate system works just as it should!
Arranging them at random requires an algorithm. My first instinct was to arrange them all in a grid, but with a random "jitter" applied. That is, for each image select a random angle and distance and move it by that amount on the page.
The script I created for this is a little too long to show here, but you can check it out on GitHub.
Here's how I ran it:
$ python3 createthanks.py names.csv thanks-grid.svg --grid Using grid formation Exported to thanks-grid.svgThe results weren't good, as you can see for yourself in this image.
The avatars have been placed, but the grid formation is still very clear despite the added jitter, plus there's a gap at the end because the number of avatars in total doesn't divide by the number of avatars on each row. I wasn't happy with it.
So I came up with an alternative solution: for each avatar a random location is chosen on the canvas. As each avatar is added its position is stored in an array, then when the next position is chosen it's compared against all of these positions. If it's within a certain distance (60 units) of any of the other points, it's rejected and a new random position is chosen.
Again, you can see this algorithm given in the same file on GitHub. Here's how I ran it:
$ python3 createthanks.py names.csv thanks-random.svg Using random formation 100% Exported to thanks-random.svgThis is the approach I ended up using, so you can see the results in the original slide. But it's not ideal for several reasons. Most crucially it's not guaranteed to complete, for example if there isn't enough space to fit all of the avatars the algorithm will hang indefinitely while it tries to find a place to position the next avatar. It's also inefficient, with each location being compared with every other and a potentially large number of rejections being made before a suitable location is found at each step.
But I found given enough space to locate the avatars the process actually finished pretty quickly. And since I only need to run it once, not multiple times, that's actually not a problem.
In retrospect a better algorithm would have been to partition the canvas up into a grid of sizes much smaller than an avatar. Ideally it would be one pixel per pixel, but in practice we don't really know what a pixel means in this context. Besides which something approaching this is likely to be fine. Now store a Boolean associated with each of these grid points indicating whether it's available or used.
After placing an avatar mark the pixels around the location in this grid as being used, to the extent that there will be no overlap if another avatar is placed in any of the unused spots. Keep a count of the available locations.
Then a random number can be chosen between zero and the total remaining available locations in order to select the next spot.
I didn't implement this, but in my head it works really well.
Finally step four involved tidying up the files. Some of the avatars and usernames were overlapping so needed a bit of manual tweaking (but thankfully not too much). Plus I also had to manually make room for the "Thank you" text in the top left of the window. This required a bit more manual shuffling of avatars, but it all worked out in the end. I'm quite happy with how it came out.
That's it. Just a little diversion into the scripts used to create the image; I hope it's been of some interest.
There will be more of the usual gecko dev diary tomorrow.
If you'd like to read any of my other gecko diary entries, they're all available on my Gecko-dev Diary page.
15 Feb 2024 : Day 157 #
The new gecko packages completed their build during the gap. I'm not expecting anything special from them, apart from the debug output that I added yesterday having been removed. But it will be nice to test whether the packages are working. If they are that means I'll have dealt with the session history issues and the actor issues and it'll be time to wind back down the stack to checking DuckDuckGo.
I've just now fired up sailfish-browser and all of the JavaScript errors seem to have been resolved. If nothing else, that's pleasing to see. So now it's time to return to DuckDuckGo again.
You'll recall that I spent a long time getting DuckDuckGo to work. The main problem was the Sec-Fetch-* headers. This allowed the main search page to load. But there was still an issue in that the search results weren't being displayed. I thought this could potentially be related to the session history issue, which is why I started looking at it. But I wasn't at all certain.
Now that the session history is fixed and the JavaScript output is clean, there's a small chance this will have fixed DuckDuckGo as well.
And it has! Searching with DuckDuckGo now produced nice results. And the page feels nice and smooth as well. With the Forwards and Back buttons now also working as expected, it's really starting to feel like a usable browser finally.
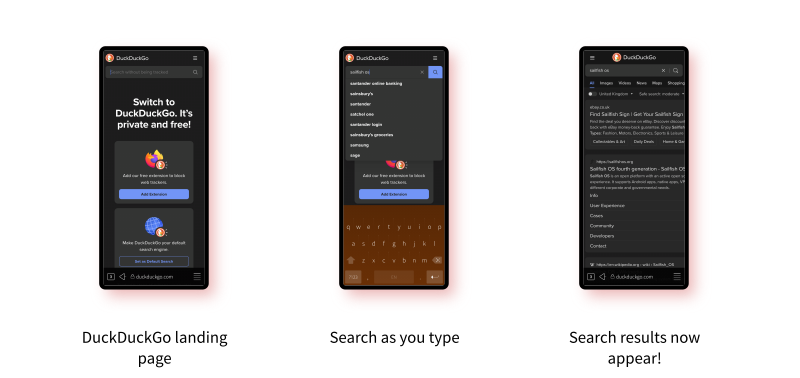
But my euphoria is short-lived. I'm able to get the browser into a state where DuckDuckGo is no longer working correctly: it just displays a blank page again.
After closing and firing up the browser again everything works as expected again.
It takes me ages to figure out how to get it back into the state where DuckDuckGo is broken. The breakage looks the same as the Sec-Fetch-* header issues that we were experiencing a couple of weeks back. If that's the case, then it's likely there's some route to getting to the DuckDuckGo page that's getting the wrong flags from the user interface and then offering up the wrong Sec-Fetch-* headers as a result.
What do I mean by a route? I mean some set of interactions to get there: loading the page from the history, a bookmark, the URL bar, pressing back, as a page loaded from the command line. All of these are routes and each will potentially need slightly different flags so that the gecko engine knows what's going on and can send the correct Sec-Fetch-* headers to match.
I thought I'd fixed them all, but it would have been easy to miss some. And so it appears.
So I try all the ways to open the page I can think of from different starting states. After having exhausted what I think are all the routes I realise I've missed something important.
So far I've been running the browser from the command line each time. What if the issue is to do with the way the browser is starting up?
Starting the browser from the command line isn't the same as starting it by pressing on its icon in the app grid. There are multiple rasons for this, but the most significant two are:
To find out what's going wrong I need to establish the Sec-Fetch-* header values that are being sent to the site. That's going to be a little tricky because when launching from the app grid there's no debug output being sent to the console. But it might be possible to extract the same info from the system log. Let's try it:
But as I write this I'm hurtling towards King's Cross Station on the train and due to arrive shortly. So I'll have to leave that question open until this evening.
[...]
It's the evening now, so time to check out the logging from the SailJailed browser. Before running it I want to forcefully enable network logging. This will be easier than configuring a special environment for it.
I've made some amendments to the Logger.js directly on-device for this:
Maybe a caching issue? Let's try deleting the profile, killing any running booster processes and trying again.
When running the browser from the launcher there's an added complication that usually the booster is still running in the background for performance reasons. So changes to the browser code and files may not always be applied if this is the case. After killing the booster processes, this seems to have been fixed.
After this additional investigation I'm satisfied that this doesn't look like an issue with the code after all.
I'm going to leave it there for today. Tomorrow I'll be looking for a completely new task to work on. But I think the browser has got to the stage where it would be worth having more hands to test it, so the next task may be to figure out how that can happen.
If you'd like to read any of my other gecko diary entries, they're all available on my Gecko-dev Diary page.
Comment
I've just now fired up sailfish-browser and all of the JavaScript errors seem to have been resolved. If nothing else, that's pleasing to see. So now it's time to return to DuckDuckGo again.
You'll recall that I spent a long time getting DuckDuckGo to work. The main problem was the Sec-Fetch-* headers. This allowed the main search page to load. But there was still an issue in that the search results weren't being displayed. I thought this could potentially be related to the session history issue, which is why I started looking at it. But I wasn't at all certain.
Now that the session history is fixed and the JavaScript output is clean, there's a small chance this will have fixed DuckDuckGo as well.
And it has! Searching with DuckDuckGo now produced nice results. And the page feels nice and smooth as well. With the Forwards and Back buttons now also working as expected, it's really starting to feel like a usable browser finally.

But my euphoria is short-lived. I'm able to get the browser into a state where DuckDuckGo is no longer working correctly: it just displays a blank page again.
After closing and firing up the browser again everything works as expected again.
It takes me ages to figure out how to get it back into the state where DuckDuckGo is broken. The breakage looks the same as the Sec-Fetch-* header issues that we were experiencing a couple of weeks back. If that's the case, then it's likely there's some route to getting to the DuckDuckGo page that's getting the wrong flags from the user interface and then offering up the wrong Sec-Fetch-* headers as a result.
What do I mean by a route? I mean some set of interactions to get there: loading the page from the history, a bookmark, the URL bar, pressing back, as a page loaded from the command line. All of these are routes and each will potentially need slightly different flags so that the gecko engine knows what's going on and can send the correct Sec-Fetch-* headers to match.
I thought I'd fixed them all, but it would have been easy to miss some. And so it appears.
So I try all the ways to open the page I can think of from different starting states. After having exhausted what I think are all the routes I realise I've missed something important.
So far I've been running the browser from the command line each time. What if the issue is to do with the way the browser is starting up?
Starting the browser from the command line isn't the same as starting it by pressing on its icon in the app grid. There are multiple rasons for this, but the most significant two are:
- When launched from the app grid the sandbox is used. It's not used when launched from the command line.
- When launched from the app grid the booster is used, unlike when launched from the command line.
To find out what's going wrong I need to establish the Sec-Fetch-* header values that are being sent to the site. That's going to be a little tricky because when launching from the app grid there's no debug output being sent to the console. But it might be possible to extract the same info from the system log. Let's try it:
$ devel-su journalctl --system -f [...] booster-browser[14470]: [D] unknown:0 - Using Wayland-EGL autologind[5343]: library "libutils.so" not found autologind[5343]: library "libcutils.so" not found autologind[5343]: library "libhardware.so" not found autologind[5343]: library "android.hardware.graphics.mapper@2.0.so" not found autologind[5343]: library "android.hardware.graphics.mapper@2.1.so" not found autologind[5343]: library "android.hardware.graphics.mapper@3.0.so" not found autologind[5343]: library "android.hardware.graphics.mapper@4.0.so" not found autologind[5343]: library "libc++.so" not found autologind[5343]: library "libhidlbase.so" not found autologind[5343]: library "libgralloctypes.so" not found autologind[5343]: library "android.hardware.graphics.common@1.2.so" not found autologind[5343]: library "libion.so" not found autologind[5343]: library "libz.so" not found autologind[5343]: library "libhidlmemory.so" not found autologind[5343]: library "android.hidl.memory@1.0.so" not found autologind[5343]: library "vendor.qti.qspmhal@1.0.so" not found [...]It looks like the logging output is all there. The next step is to figure out a way to set the EMBED_CONSOLE="network" environment variable, so that we can capture the headers used.
But as I write this I'm hurtling towards King's Cross Station on the train and due to arrive shortly. So I'll have to leave that question open until this evening.
[...]
It's the evening now, so time to check out the logging from the SailJailed browser. Before running it I want to forcefully enable network logging. This will be easier than configuring a special environment for it.
I've made some amendments to the Logger.js directly on-device for this:
vim /usr/lib64/mozembedlite/chrome/embedlite/content/Logger.jsThe changes applied are the following, in order to force the "extreme" network logging to be used:
[...]
get stackTraceEnabled() {
return true;
//return this._consoleEnv.indexOf("stacktrace") !== -1;
},
get devModeNetworkEnabled() {
return true;
//return this._consoleEnv.indexOf("network") !== -1;
},
[...]
Next we must set the logger running, also on the device:
$ devel-su journalctl --system -f | grep "dbus-daemon" > sailjail-log-01.txtAnd finally run sailfish-browser. The DuckDuckGo page loads, but doesn't render. That's good: that's the bug we want to examine. After closing the browser down I'm left with a surprisingly tractable 80 KiB log file to investigate:
$ ls -lh sailjail-log-01.txt -rw-rw-r-- 1 defaultu defaultu 80.0K Feb 13 22:35 sailjail-log-01.txtThe bits we're interested in are the Sec-Fetch-* request headers. This is what's in the log file for these:
[ Request details ------------------------------------------- ]
Request: GET status: 200 OK
URL: https://duckduckgo.com/?t=h_
[ Request headers --------------------------------------- ]
Host : duckduckgo.com
User-Agent : Mozilla/5.0 (X11; Linux aarch64; rv:91.0) Gecko/20100101
Firefox/91.0
Accept : text/html,application/xhtml+xml,application/xml;q=0.9,
image/webp,*/*;q=0.8
Accept-Language : en-GB,en;q=0.5
Accept-Encoding : gzip, deflate, br
Connection : keep-alive
Cookie : l=wt-wt
Upgrade-Insecure-Requests : 1
Sec-Fetch-Dest : document
Sec-Fetch-Mode : navigate
Sec-Fetch-Site : none
Sec-Fetch-User : ?1
If-None-Match : "65cbc605-4716"
Going back to the non-sandboxed run, below are the equivalent headers sent. There are two here because the browser is downloading a second file.
[ Request details ------------------------------------------- ]
Request: GET status: 200 OK
URL: https://duckduckgo.com/?t=h_
[ Request headers --------------------------------------- ]
Host : duckduckgo.com
User-Agent : Mozilla/5.0 (X11; Linux aarch64; rv:91.0) Gecko/20100101
Firefox/91.0
Accept : text/html,application/xhtml+xml,application/xml;q=0.9,
image/webp,*/*;q=0.8
Accept-Language : en-GB,en;q=0.5
Accept-Encoding : gzip, deflate, br
Connection : keep-alive
Cookie : l=wt-wt
Upgrade-Insecure-Requests : 1
Sec-Fetch-Dest : document
Sec-Fetch-Mode : navigate
Sec-Fetch-Site : none
Sec-Fetch-User : ?1
If-None-Match : "65cbc606-4716"
[ Request details ------------------------------------------- ]
Request: GET status: 304 Not Modified
URL: https://content-signature-2.cdn.mozilla.net/chains/remote-settings.
content-signature.mozilla.org-2024-03-20-10-07-03.chain
[ Request headers --------------------------------------- ]
Host : content-signature-2.cdn.mozilla.net
User-Agent : Mozilla/5.0 (X11; Linux aarch64; rv:91.0) Gecko/20100101
Firefox/91.0
Accept : */*
Accept-Language : en-GB,en;q=0.5
Accept-Encoding : gzip, deflate, br
Connection : keep-alive
Sec-Fetch-Dest : empty
Sec-Fetch-Mode : cors
Sec-Fetch-Site : cross-site
If-Modified-Since : Tue, 30 Jan 2024 10:07:04 GMT
If-None-Match : "b437816fe2de8ff3d429925523643815"
To be honest I'm a bit confused by this: for the initial request there are no difference between the values provided for the Sec-Fetch-* headers in either case. I was expecting to see a difference.Maybe a caching issue? Let's try deleting the profile, killing any running booster processes and trying again.
$ mv ~/.local/share/org.sailfishos/browser/.mozilla/ \
~/.local/share/org.sailfishos/browser/mozilla.bak
$ ps aux | grep browser
4628 defaultu /usr/bin/invoker [...] --application=sailfish-browser
4640 defaultu /usr/bin/firejail [...] --application=sailfish-browser
4674 defaultu /usr/libexec/mapplauncherd/booster-browser
--application=sailfish-browser
4675 defaultu booster [browser]
4702 defaultu grep browser
6184 defaultu /usr/bin/invoker --type=silica-session [...]
--application=jolla-email
6243 defaultu /usr/bin/firejail [...] --application=sailfish-browser
6248 defaultu /usr/bin/firejail [...] --application=jolla-email
6442 defaultu /usr/libexec/mapplauncherd/booster-browser
--application=jolla-email
6452 defaultu booster [browser]
$ kill -1 4640
$ kill -1 6243
After deleting the browser's local config storage and killing the SailJail/booster processes, DuckDuckGo then works successfully again. So probably it was a caching issue.When running the browser from the launcher there's an added complication that usually the booster is still running in the background for performance reasons. So changes to the browser code and files may not always be applied if this is the case. After killing the booster processes, this seems to have been fixed.
After this additional investigation I'm satisfied that this doesn't look like an issue with the code after all.
I'm going to leave it there for today. Tomorrow I'll be looking for a completely new task to work on. But I think the browser has got to the stage where it would be worth having more hands to test it, so the next task may be to figure out how that can happen.
If you'd like to read any of my other gecko diary entries, they're all available on my Gecko-dev Diary page.
14 Feb 2024 : Day 156 #
It is the morning, time to take a look into why EmbedLiteGlobalHelper.js isn't being initialised on ESR 91. We saw yesterday that this was why the Window Actors weren't being registered. If we want them registered we're going to have to get EmbedLiteGlobalHelper.js back up and running.
Now I think about it, it's not that EmbedLiteGlobalHelper.js isn't being loaded. We know it's being loaded because we see this line in the debug output when running ESR 91:
Presumably there was some error resulting from the call to ActorManagerParent.flush(), but November was a long time ago now (way back on Day 88 in fact). According to the diary entry then, the change was to remove the following error:
The results here are interesting. This has clearly brought the ActorManagerParent back to life. But there is still this error about flush() not being a function. And when comparing the code in ActorManagerParent.jsm between ESR 78 and ESR 91 it is true that this flush() method has been removed.
That leaves us with an interesting quandary. In ESR 78 the flush() function was being used to trigger initialisation of the module. Now we need something else to do the same.
Thankfully there is a really simple solution. We can just instantiate an ActorManagerParent object without calling any functions on it.
If you'd like to read any of my other gecko diary entries, they're all available on my Gecko-dev Diary page.
Comment
Now I think about it, it's not that EmbedLiteGlobalHelper.js isn't being loaded. We know it's being loaded because we see this line in the debug output when running ESR 91:
$ EMBED_CONSOLE=1 sailfish-browser [...] JSComp: EmbedLiteGlobalHelper.js loaded [...]That line is being directly output from the EmbedLiteGlobalHelper.js file itself:
function EmbedLiteGlobalHelper()
{
L10nRegistry.registerSources([new FileSource(
"0-mozembedlite",
["en-US", "fi", "ru"],
"chrome://browser/content/localization/
{locale}/")])
Logger.debug("JSComp: EmbedLiteGlobalHelper.js loaded");
}
But! There is a line missing from here that's in the ESR 78 code:
function EmbedLiteGlobalHelper()
{
ActorManagerParent.flush();
L10nRegistry.registerSource(new FileSource(
"0-mozembedlite",
["en-US", "fi", "ru"],
"chrome://browser/content/localization/
{locale}/"))
Logger.debug("JSComp: EmbedLiteGlobalHelper.js loaded");
}
Could it be that the call to ActorManagerParent.flush() is what kicks the ActorManagerParent into life? Presumably there's a reason it was removed. It was most likely me that removed it, but I don't recall. But we should be able to find out.
$ git log -S "ActorManagerParent" -1 -- jscomps/EmbedLiteGlobalHelper.js
commit 0bf2601425ec1d8d639255d6a7c32231e7e38eae
Author: David Llewellyn-Jones <david.llewellyn-jones@jolla.com>
Date: Thu Nov 23 21:55:13 2023 +0000
Remove EmbedLiteGlobalHelper.js errors
Makes three changes to address errors that were coming from
EmbedLiteGlobalHelper.js:
1. Use ComponentUtils.generateNSGetFactory() instead of
XPCOMUtils.generateNSGetFactory().
2. Remove call to ActorManagerParent.flush(). See Bug 1649843.
3. Use L10nRegistry.registerSources() instead of
L10nRegistry.registerSource(). See Bug 1648631.
See the following related upstream changes:
https://phabricator.services.mozilla.com/D95206
https://phabricator.services.mozilla.com/D81243
That "Bug 1648631" that's being referred to there is described as "Remove legacy JS actors infrastructure and migrate remaining actors to JSWindowActors".Presumably there was some error resulting from the call to ActorManagerParent.flush(), but November was a long time ago now (way back on Day 88 in fact). According to the diary entry then, the change was to remove the following error:
JavaScript error: file:///usr/lib64/mozembedlite/components/
EmbedLiteGlobalHelper.js,
line 32: TypeError: ActorManagerParent.flush is not a function
JavaScript error: file:///usr/lib64/mozembedlite/components/
EmbedLiteGlobalHelper.js,
line 34: TypeError: L10nRegistry.registerSource is not a function
With all of the other changes we've been making, restoring the removed code to see what happens doesn't sound like the worst idea right now. Let's try it.
$ sailfish-browser
[D] unknown:0 - Using Wayland-EGL
[...]
Created LOG for EmbedLite
ACTOR: addJSProcessActors
ACTOR: RegisterProcessActor:
ACTOR: RegisterProcessActor:
ACTOR: RegisterProcessActor:
ACTOR: addJSWindowActors
ACTOR: RegisterWindowActor:
ACTOR: RegisterWindowActor:
ACTOR: RegisterWindowActor:
ACTOR: RegisterWindowActor:
ACTOR: RegisterWindowActor:
ACTOR: RegisterWindowActor:
ACTOR: RegisterWindowActor:
ACTOR: RegisterWindowActor:
ACTOR: RegisterWindowActor:
ACTOR: RegisterWindowActor:
ACTOR: RegisterWindowActor:
ACTOR: RegisterWindowActor:
ACTOR: RegisterWindowActor:
ACTOR: RegisterWindowActor:
ACTOR: RegisterWindowActor:
ACTOR: RegisterWindowActor:
ACTOR: RegisterWindowActor:
ACTOR: RegisterWindowActor:
ACTOR: RegisterWindowActor:
ACTOR: RegisterWindowActor:
ACTOR: RegisterWindowActor:
ACTOR: RegisterWindowActor:
ACTOR: RegisterWindowActor:
ACTOR: RegisterWindowActor:
ACTOR: RegisterWindowActor:
ACTOR: RegisterWindowActor:
ACTOR: RegisterWindowActor:
ACTOR: RegisterWindowActor:
ACTOR: RegisterWindowActor:
ACTOR: RegisterWindowActor:
ACTOR: RegisterWindowActor:
AJavaScript error: file:///usr/lib64/mozembedlite/components/
EmbedLiteGlobalHelper.js, line 31: TypeError: ActorManagerParent.flush
is not a function
CTOR: RegisterWindowActor:
ACTOR: RegisterWindowActor:
Created LOG for EmbedPrefs
Created LOG for EmbedLiteLayerManager
ACTOR: Getting LoginManager
ACTOR: Getting LoginManager
ACTOR: Getting LoginManager
ACTOR: Getting LoginManager
Call EmbedLiteApp::StopChildThread()
It turns out the code I added to output the name of the actors is broken: the log output is being generated, but without the name of the actor concerned. But I don't fancy doing a complete rebuild to fix that so we'll just have to do without for now.The results here are interesting. This has clearly brought the ActorManagerParent back to life. But there is still this error about flush() not being a function. And when comparing the code in ActorManagerParent.jsm between ESR 78 and ESR 91 it is true that this flush() method has been removed.
That leaves us with an interesting quandary. In ESR 78 the flush() function was being used to trigger initialisation of the module. Now we need something else to do the same.
Thankfully there is a really simple solution. We can just instantiate an ActorManagerParent object without calling any functions on it.
function EmbedLiteGlobalHelper()
{
// Touch ActorManagerParent so that it gets initialised
var actor = new ActorManagerParent();
L10nRegistry.registerSources([new FileSource(
"0-mozembedlite",
["en-US", "fi", "ru"],
"chrome://browser/content/localization/
{locale}/")])
Logger.debug("JSComp: EmbedLiteGlobalHelper.js loaded");
}
Now we get a nice clean startup without any errors:
$ sailfish-browser [D] unknown:0 - Using Wayland-EGL [...] Created LOG for EmbedLiteTrace [D] onCompleted:105 - ViewPlaceholder requires a SilicaFlickable parent Created LOG for EmbedLite ACTOR: addJSProcessActors ACTOR: RegisterProcessActor: ACTOR: RegisterProcessActor: ACTOR: RegisterProcessActor: ACTOR: addJSWindowActors ACTOR: RegisterWindowActor: [...] ACTOR: RegisterWindowActor: Created LOG for EmbedPrefs Created LOG for EmbedLiteLayerManager ACTOR: Getting LoginManager ACTOR: Getting LoginManager ACTOR: Getting LoginManager ACTOR: Getting LoginManager Call EmbedLiteApp::StopChildThread()Excellent! The final step then is to remove all of the debugging code I added and see where that leaves us. With any luck, this will resolve the session history issues and allow us to head back in to checking DuckDuckGo once again.
If you'd like to read any of my other gecko diary entries, they're all available on my Gecko-dev Diary page.
13 Feb 2024 : Day 155 #
This morning the build I started yesterday has completed successfully. Now to test it.
You'll recall that the purpose of the build was to add some debugging output to find out what's going on with the Window Actors and the LoginManager actor in particular. Is it being registered? Are others being registered? Are others being requested? Every time one of these events occurs we should get some appropriate debug output so that we know.
To actually see the output we'll need to activate the BrowsingContext log output, like this:
This... looks suspicious to me. I'm not entirely convinced that the logging I've added is working, particularly for the printf() output I added to the JSActorService class.
I don't want to have to make another build, but thankfully we can check this using the debugger.
The obvious thing to do now is to check the same thing using ESR 78. So let's do that.
This is enlightening. It means that this is an iceberg moment: the error from LoginManager is exposing a much more serious problem under the surface. Honestly, I'm puzzled as to why this hasn't caused more breakages of other elements of the browser user interface.
The next step is to look at the backtrace and find out why the same code isn't executing in ESR 91. It's not the best backtrace to be honest because it's backstopped by the interpreter, but it at least gives us something to work with.
So back to ESR 91:
The backtrace gets lost when it hits JavaScript, but it looks like the JavaScript action is happen in the ActorManagerParent.jsm file. So back to ESR 78, and I've added a couple of extra debug prints to the ActorManagerParent.jsm file:
Time for a break, but when I get back I'll look into this further.
[...]
Back to it. So the question I need to answer now is "where in ESR 78 are the actors getting registered?" There are two clear candidates. The first is BrowserGlue.jsm. This includes code to get the ActorManagerParent:
I should be able to check this pretty straightforwardly. If I comment out the code in EmbedLiteGlobalHelper.js related to the actors like this:
Once again, this feels like progress, but an answer for this question will have to wait until tomorrow.
If you'd like to read any of my other gecko diary entries, they're all available on my Gecko-dev Diary page.
Comment
You'll recall that the purpose of the build was to add some debugging output to find out what's going on with the Window Actors and the LoginManager actor in particular. Is it being registered? Are others being registered? Are others being requested? Every time one of these events occurs we should get some appropriate debug output so that we know.
To actually see the output we'll need to activate the BrowsingContext log output, like this:
$ MOZ_LOG="BrowsingContext:5" sailfish-browser
[D] unknown:0 - Using Wayland-EGL
library "libutils.so" not found
library "libcutils.so" not found
library "libhardware.so" not found
library "android.hardware.graphics.mapper@2.0.so" not found
library "android.hardware.graphics.mapper@2.1.so" not found
library "android.hardware.graphics.mapper@3.0.so" not found
library "android.hardware.graphics.mapper@4.0.so" not found
library "libc++.so" not found
library "libhidlbase.so" not found
library "libgralloctypes.so" not found
library "android.hardware.graphics.common@1.2.so" not found
library "libion.so" not found
library "libz.so" not found
library "libhidlmemory.so" not found
library "android.hidl.memory@1.0.so" not found
library "vendor.qti.qspmhal@1.0.so" not found
greHome from GRE_HOME:/usr/bin
libxul.so is not found, in /usr/bin/libxul.so
Created LOG for EmbedLiteTrace
[D] onCompleted:105 - ViewPlaceholder requires a SilicaFlickable parent
Created LOG for EmbedLite
Created LOG for EmbedPrefs
Created LOG for EmbedLiteLayerManager
[Parent 4610: Unnamed thread 7908002670]: D/BrowsingContext Creating 0x00000003
in Parent
[Parent 4610: Unnamed thread 7908002670]: D/BrowsingContext Parent: Connecting
0x00000003 to 0x00000000 (private=0, remote=0, fission=0, oa=)
ACTOR: Getting LoginManager
[Parent 4610: Unnamed thread 7908002670]: D/BrowsingContext ACTOR: GetActor:
JavaScript error: resource://gre/modules/LoginManagerChild.jsm, line 542:
NotFoundError: WindowGlobalChild.getActor: No such JSWindowActor
'LoginManager'
ACTOR: Getting LoginManager
[Parent 4610: Unnamed thread 7908002670]: D/BrowsingContext ACTOR: GetActor:
JavaScript error: resource://gre/modules/LoginManagerChild.jsm, line 542:
NotFoundError: WindowGlobalChild.getActor: No such JSWindowActor
'LoginManager'
[Parent 4610: Unnamed thread 7908002670]: D/BrowsingContext Parent: Detaching
0x00000003 from 0x00000000
Call EmbedLiteApp::StopChildThread()
Redirecting call to abort() to mozalloc_abort
It's a little hard to tell, but there are actually only a couple of relevant lines of output in there. Let's clean that up a bit:
$ MOZ_LOG="BrowsingContext:5" sailfish-browser 2>&1 | grep -E "ACTOR:|error"
ACTOR: Getting LoginManager
[Parent 4720: Unnamed thread 7668002670]: D/BrowsingContext ACTOR: GetActor:
JavaScript error: resource://gre/modules/LoginManagerChild.jsm, line 542:
NotFoundError: WindowGlobalChild.getActor: No such JSWindowActor
'LoginManager'
ACTOR: Getting LoginManager
[Parent 4720: Unnamed thread 7668002670]: D/BrowsingContext ACTOR: GetActor:
JavaScript error: resource://gre/modules/LoginManagerChild.jsm, line 542:
NotFoundError: WindowGlobalChild.getActor: No such JSWindowActor
'LoginManager'
So what we have is an access to GetActor() but without any apparent registrations for this or any other actors.This... looks suspicious to me. I'm not entirely convinced that the logging I've added is working, particularly for the printf() output I added to the JSActorService class.
I don't want to have to make another build, but thankfully we can check this using the debugger.
$ MOZ_LOG="BrowsingContext:5" gdb sailfish-browser
GNU gdb (GDB) Mer (8.2.1+git9)
[...]
(gdb) b JSActorService::RegisterWindowActor
Function "JSActorService::RegisterWindowActor" not defined.
Make breakpoint pending on future shared library load? (y or [n]) y
Breakpoint 1 (JSActorService::RegisterWindowActor) pending.
(gdb) b JSActorService::UnregisterWindowActor
Function "JSActorService::UnregisterWindowActor" not defined.
Make breakpoint pending on future shared library load? (y or [n]) y
Breakpoint 2 (JSActorService::UnregisterWindowActor) pending.
(gdb) b JSActorService::RegisterProcessActor
Function "JSActorService::RegisterProcessActor" not defined.
Make breakpoint pending on future shared library load? (y or [n]) y
Breakpoint 3 (JSActorService::RegisterProcessActor) pending.
(gdb) b JSActorService::UnregisterProcessActor
Function "JSActorService::UnregisterProcessActor" not defined.
Make breakpoint pending on future shared library load? (y or [n]) y
Breakpoint 4 (JSActorService::UnregisterProcessActor) pending.
(gdb) r
[...]
ACTOR: Getting LoginManager
[Parent 8108: Unnamed thread 7fc0002670]: D/BrowsingContext ACTOR: GetActor:
JavaScript error: resource://gre/modules/LoginManagerChild.jsm, line 542:
NotFoundError: WindowGlobalChild.getActor: No such JSWindowActor
'LoginManager'
[...]
ACTOR: Getting LoginManager
[Parent 8108: Unnamed thread 7fc0002670]: D/BrowsingContext ACTOR: GetActor:
JavaScript error: resource://gre/modules/LoginManagerChild.jsm, line 542:
NotFoundError: WindowGlobalChild.getActor: No such JSWindowActor
'LoginManager'
[Parent 8108: Unnamed thread 7fc0002670]: D/BrowsingContext Parent: Detaching
0x00000003 from 0x00000000
Call EmbedLiteApp::StopChildThread()
Redirecting call to abort() to mozalloc_abort
[...]
(gdb) info break
Num Type Disp Enb What
1 breakpoint keep y in mozilla::dom::JSActorService::RegisterWindowActor
(nsTSubstring<char> const&, mozilla::dom::
WindowActorOptions const&, mozilla::ErrorResult&)
at dom/ipc/jsactor/JSActorService.cpp:60
2 breakpoint keep y in mozilla::dom::JSActorService::UnregisterWindowActor
(nsTSubstring<char> const&)
at dom/ipc/jsactor/JSActorService.cpp:109
3 breakpoint keep y in mozilla::dom::JSActorService::RegisterProcessActor
(nsTSubstring<char> const&, mozilla::dom::
ProcessActorOptions const&, mozilla::ErrorResult&)
at dom/ipc/jsactor/JSActorService.cpp:231
4 breakpoint keep y in mozilla::dom::JSActorService::UnregisterProcessActor
(nsTSubstring<char> const&)
at dom/ipc/jsactor/JSActorService.cpp:275
(gdb)
Even though the breakpoints found places to attach, there are no hits. It really does look like the entire actor functionality is missing, which may or may not be intended.The obvious thing to do now is to check the same thing using ESR 78. So let's do that.
$ gdb sailfish-browser
GNU gdb (GDB) Mer (8.2.1+git9)
[...]
(gdb) b JSActorService::RegisterWindowActor
Function "JSActorService::RegisterWindowActor" not defined.
Make breakpoint pending on future shared library load? (y or [n]) y
Breakpoint 1 (JSActorService::RegisterWindowActor) pending.
(gdb) b JSActorService::UnregisterWindowActor
Function "JSActorService::UnregisterWindowActor" not defined.
Make breakpoint pending on future shared library load? (y or [n]) y
Breakpoint 2 (JSActorService::UnregisterWindowActor) pending.
(gdb) b JSActorService::RegisterProcessActor
Function "JSActorService::RegisterProcessActor" not defined.
Make breakpoint pending on future shared library load? (y or [n]) y
Breakpoint 3 (JSActorService::RegisterProcessActor) pending.
(gdb) b JSActorService::UnregisterProcessActor
Function "JSActorService::UnregisterProcessActor" not defined.
Make breakpoint pending on future shared library load? (y or [n]) y
Breakpoint 4 (JSActorService::UnregisterProcessActor) pending.
(gdb) r
[...]
Thread 10 "GeckoWorkerThre" hit Breakpoint 1, mozilla::dom::JSActorService::
RegisterWindowActor (this=this@entry=0x7f80480850, aName=..., aOptions=...,
aRv=...) at dom/ipc/JSActorService.cpp:51
51 ErrorResult& aRv) {
(gdb) handle SIGPIPE nostop
Signal Stop Print Pass to program Description
SIGPIPE No Yes Yes Broken pipe
(gdb) p aName
$1 = (const nsACString &) @0x7fa69e3d80: {<mozilla::detail::nsTStringRepr
<char>> = {mData = 0x7fa69e3d94 "AboutHttpsOnlyError", mLength = 19,
mDataFlags = (mozilla::detail::StringDataFlags::TERMINATED |
mozilla::detail::StringDataFlags::INLINE),
mClassFlags = mozilla::detail::StringClassFlags::INLINE},
static kMaxCapacity = 2147483637}
(gdb) p aName.mData
$2 = (mozilla::detail::nsTStringRepr<char>::char_type *) 0x7fa69e3d94
"AboutHttpsOnlyError"
(gdb) c
Continuing.
Thread 10 "GeckoWorkerThre" hit Breakpoint 1, mozilla::dom::JSActorService::
RegisterWindowActor (this=this@entry=0x7f80480850, aName=..., aOptions=...,
aRv=...) at dom/ipc/JSActorService.cpp:51
51 ErrorResult& aRv) {
(gdb) p aName.mData
$3 = (mozilla::detail::nsTStringRepr<char>::char_type *) 0x7fa69e3d94
"AudioPlayback"
(gdb) c
Continuing.
Thread 10 "GeckoWorkerThre" hit Breakpoint 1, mozilla::dom::JSActorService::
RegisterWindowActor (this=this@entry=0x7f80480850, aName=..., aOptions=...,
aRv=...) at dom/ipc/JSActorService.cpp:51
51 ErrorResult& aRv) {
(gdb) p aName.mData
$4 = (mozilla::detail::nsTStringRepr<char>::char_type *) 0x7fa69e3d94
"AutoComplete"
(gdb) c
[...]
There are dozens more of them. But also, crucially, this one:
Thread 10 "GeckoWorkerThre" hit Breakpoint 1, mozilla::dom::JSActorService:: RegisterWindowActor (this=this@entry=0x7f80480850, aName=..., aOptions=..., aRv=...) at dom/ipc/JSActorService.cpp:51 51 ErrorResult& aRv) { (gdb) p aName.mData $17 = (mozilla::detail::nsTStringRepr<char>::char_type *) 0x7fa69e3a84 "LoginManager" (gdb) bt #0 mozilla::dom::JSActorService::RegisterWindowActor (this=this@entry=0x7f80480850, aName=..., aOptions=..., aRv=...) at dom/ipc/JSActorService.cpp:51 #1 0x0000007fba9881b0 in mozilla::dom::ChromeUtils::RegisterWindowActor (aGlobal=..., aName=..., aOptions=..., aRv=...) at dom/base/ChromeUtils.cpp:1243 #2 0x0000007fbae8b4f4 in mozilla::dom::ChromeUtils_Binding::registerWindowActor (cx_=<optimized out>, argc=<optimized out>, vp=0x7fa69e3b00) at ChromeUtilsBinding.cpp:4263 #3 0x0000007f00460260 in ?? () #4 0x0000007fbcb1ba80 in Interpret (cx=0x7fa69e3ad0, state=...) at js/src/vm/Activation.h:541 #5 0x0000007fbcb1ba80 in Interpret (cx=0x7f802270c0, state=...) at js/src/vm/Activation.h:541 #6 0x0000000000000000 in ?? () Backtrace stopped: previous frame identical to this frame (corrupt stack?) (gdb)
Eventually it gets through them all and the page loads. None of the other breakpoints get hit, so there don't appear to be any deregistrations.This is enlightening. It means that this is an iceberg moment: the error from LoginManager is exposing a much more serious problem under the surface. Honestly, I'm puzzled as to why this hasn't caused more breakages of other elements of the browser user interface.
The next step is to look at the backtrace and find out why the same code isn't executing in ESR 91. It's not the best backtrace to be honest because it's backstopped by the interpreter, but it at least gives us something to work with.
So back to ESR 91:
(gdb) b ChromeUtils::RegisterWindowActor Breakpoint 5 at 0x7ff2c9a0d8: file dom/base/ChromeUtils.cpp, line 1350. (gdb) b ChromeUtils_Binding::registerWindowActor Breakpoint 6 at 0x7ff31bf858: file ChromeUtilsBinding.cpp, line 5237. (gdb) r The program being debugged has been started already. Start it from the beginning? (y or n) y Starting program: /usr/bin/sailfish-browser [...]No hits.
The backtrace gets lost when it hits JavaScript, but it looks like the JavaScript action is happen in the ActorManagerParent.jsm file. So back to ESR 78, and I've added a couple of extra debug prints to the ActorManagerParent.jsm file:
addJSProcessActors(actors) {
dump("ACTOR: addJSProcessActors\n");
this._addActors(actors, "JSProcessActor");
},
addJSWindowActors(actors) {
dump("ACTOR: addJSWindowActors\n");
this._addActors(actors, "JSWindowActor");
},
And there's an immediate hit:
$ EMBED_CONSOLE=1 sailfish-browser [D] unknown:0 - Using Wayland-EGL library "libGLESv2_adreno.so" not found library "eglSubDriverAndroid.so" not found greHome from GRE_HOME:/usr/bin libxul.so is not found, in /usr/bin/libxul.so Created LOG for EmbedLiteTrace [D] onCompleted:105 - ViewPlaceholder requires a SilicaFlickable parent Created LOG for EmbedLite JSComp: EmbedLiteConsoleListener.js loaded JSComp: ContentPermissionManager.js loaded JSComp: EmbedLiteChromeManager.js loaded JSComp: EmbedLiteErrorPageHandler.js loaded JSComp: EmbedLiteFaviconService.js loaded ACTOR: addJSProcessActors ACTOR: addJSWindowActors JSComp: EmbedLiteGlobalHelper.js loaded EmbedLiteGlobalHelper app-startup [..]And for a bit more clarity:
$ sailfish-browser 2>&1 | grep "ACTOR:" ACTOR: addJSProcessActors ACTOR: addJSWindowActorsI've copied those same debug lines over to the ESR 91 code to see if the same methods are being called there.
$ EMBED_CONSOLE=1 sailfish-browser [D] unknown:0 - Using Wayland-EGL library "libutils.so" not found library "libcutils.so" not found library "libhardware.so" not found library "android.hardware.graphics.mapper@2.0.so" not found library "android.hardware.graphics.mapper@2.1.so" not found library "android.hardware.graphics.mapper@3.0.so" not found library "android.hardware.graphics.mapper@4.0.so" not found library "libc++.so" not found library "libhidlbase.so" not found library "libgralloctypes.so" not found library "android.hardware.graphics.common@1.2.so" not found library "libion.so" not found library "libz.so" not found library "libhidlmemory.so" not found library "android.hidl.memory@1.0.so" not found library "vendor.qti.qspmhal@1.0.so" not found greHome from GRE_HOME:/usr/bin libxul.so is not found, in /usr/bin/libxul.so Created LOG for EmbedLiteTrace [D] onCompleted:105 - ViewPlaceholder requires a SilicaFlickable parent Created LOG for EmbedLite JSComp: EmbedLiteConsoleListener.js loaded JSComp: ContentPermissionManager.js loaded JSComp: EmbedLiteChromeManager.js loaded JSComp: EmbedLiteErrorPageHandler.js loaded JSComp: EmbedLiteFaviconService.js loaded JSComp: EmbedLiteGlobalHelper.js loaded EmbedLiteGlobalHelper app-startup [...]Nothing that I can see, but just to be certain:
$ sailfish-browser 2>&1 | grep "ACTOR:" ACTOR: Getting LoginManager ACTOR: Getting LoginManagerSo somewhere between EmbedLiteFaviconService.js being loaded and EmbedLiteGlobalHelper.js being loaded the actors are registered on ESR 78, but that's not happening on ESR 91.
Time for a break, but when I get back I'll look into this further.
[...]
Back to it. So the question I need to answer now is "where in ESR 78 are the actors getting registered?" There are two clear candidates. The first is BrowserGlue.jsm. This includes code to get the ActorManagerParent:
ChromeUtils.defineModuleGetter( this, "ActorManagerParent", "resource://gre/modules/ActorManagerParent.jsm" );It even adds some actors of its own during initialisation:
// initialization (called on application startup)
_init: function BG__init() {
[...]
ActorManagerParent.addJSProcessActors(JSPROCESSACTORS);
ActorManagerParent.addJSWindowActors(JSWINDOWACTORS);
ActorManagerParent.addLegacyActors(LEGACY_ACTORS);
ActorManagerParent.flush();
[...]
},
Another, potentially more promising candidate, is EmbedLiteGlobalHelper.js. It's more promising for multiple reasons. First, it's part of embedlite-components, which means it's intended for use with sailfish-browser. Second, something in the back of my mind tells me sailfish-browser uses its own version of the browser glue. Third, and perhaps most compelling, the debug output messages come straight before EmbedLiteGlobalHelper.js is claiming to be initialised, which would fit with the the actor initialisation being part of the initialisation of EmbedLiteGlobalHelper.js.I should be able to check this pretty straightforwardly. If I comment out the code in EmbedLiteGlobalHelper.js related to the actors like this:
//ChromeUtils.defineModuleGetter(
// this,
// "ActorManagerParent",
// "resource://gre/modules/ActorManagerParent.jsm"
//);
Services.scriptloader.loadSubScript("chrome://embedlite/content/Logger.js");
// Common helper service
function EmbedLiteGlobalHelper()
{
//ActorManagerParent.flush();
[...]
Then the errors received start to look very similar to those for ESR 91:
$ sailfish-browser
[D] unknown:0 - Using Wayland-EGL
library "libGLESv2_adreno.so" not found
library "eglSubDriverAndroid.so" not found
greHome from GRE_HOME:/usr/bin
libxul.so is not found, in /usr/bin/libxul.so
Created LOG for EmbedLiteTrace
[D] onCompleted:105 - ViewPlaceholder requires a SilicaFlickable parent
Created LOG for EmbedLite
Created LOG for EmbedPrefs
Created LOG for EmbedLiteLayerManager
JavaScript error: resource://gre/modules/LoginManagerChild.jsm, line 442:
NotSupportedError: WindowGlobalChild.getActor: Could not get
JSWindowActorProtocol: LoginManager is not registered
To double-check, we can run sailfish-browser using the debugger with breakpoints on the relevant methods like this:
$ gdb sailfish-browser GNU gdb (GDB) Mer (8.2.1+git9) [...] (gdb) b JSActorService::RegisterWindowActor Function "JSActorService::RegisterWindowActor" not defined. Make breakpoint pending on future shared library load? (y or [n]) y Breakpoint 1 (JSActorService::RegisterWindowActor) pending. (gdb) b JSActorService::UnregisterWindowActor Function "JSActorService::UnregisterWindowActor" not defined. Make breakpoint pending on future shared library load? (y or [n]) y Breakpoint 2 (JSActorService::UnregisterWindowActor) pending. (gdb) b JSActorService::RegisterProcessActor Function "JSActorService::RegisterProcessActor" not defined. Make breakpoint pending on future shared library load? (y or [n]) y Breakpoint 3 (JSActorService::RegisterProcessActor) pending. (gdb) b JSActorService::UnregisterProcessActor Function "JSActorService::UnregisterProcessActor" not defined. Make breakpoint pending on future shared library load? (y or [n]) y Breakpoint 4 (JSActorService::UnregisterProcessActor) pending. (gdb) r [...]No hits. So, in conclusion it seems that EmbedLiteGlobalHelper.js isn't being initialised on ESR 91. The task now is to find out why.
Once again, this feels like progress, but an answer for this question will have to wait until tomorrow.
If you'd like to read any of my other gecko diary entries, they're all available on my Gecko-dev Diary page.
12 Feb 2024 : Day 154 #
I'm still trying to track down the reason for the following error today:
So I thought I should let it settle overnight. One possibility I came up with during this pondering process was that there's an error during the initialisation of LoginManager that's resulting in it not becoming available for use later.
But a careful check of the debug output prior to the above error doesn't give any indication that anything like this is going wrong. Here's the entire output.
Another possibility that crossed my mind is that there's a problem with the way WindowGlobalChild::GetActor() is working in general. In other words, the issue isn't really with the LoginManager at all but rather with the code for accessing it.
On the face of it this seems unlikely: the error is only showing for the LoginManager and no other actors. And there are plenty of other uses. I count 167 instances, only 9 of which are for LoginManager.
To try to find out, I've added some debugging code so that something will be output whenever GetActor() is called off the WindowGlobalChild:
[...]
Before the build completes I realise that all of the action registering and unregistering actors happens in JSActorService.cpp. There's a hash table called mWindowActorDescriptors which stores all of the actors, alongside registration and removal methods. To help understand what's going on there it will be helpful to add some debug output here too, to expose any actors that are added or removed here. So I've cancelled the build while I add it in.
Here's an example:
Now I've set it building again. Time for a break while my laptop does all the work for me.
[...]
It turns out the break was longer than I anticipated. I thought the build might finish quickly but it's still chugging away several hours later as it heads towards bed time.
So I'll have to pick this up in the morning once it's built. I'm looking forward to finding out what's really happening with this Actor code.
If you'd like to read any of my other gecko diary entries, they're all available on my Gecko-dev Diary page.
Comment
JavaScript error: resource://gre/modules/LoginManagerChild.jsm, line 541:
NotFoundError: WindowGlobalChild.getActor:
No such JSWindowActor 'LoginManager'
It's being a bit elusive, because there doesn't seem to be any clear difference between the way the LoginManager is set up on ESR 78 compared to ESR 91.So I thought I should let it settle overnight. One possibility I came up with during this pondering process was that there's an error during the initialisation of LoginManager that's resulting in it not becoming available for use later.
But a careful check of the debug output prior to the above error doesn't give any indication that anything like this is going wrong. Here's the entire output.
[defaultuser@Xperia10III gecko]$ sailfish-browser
[D] unknown:0 - Using Wayland-EGL
library "libutils.so" not found
library "libcutils.so" not found
library "libhardware.so" not found
library "android.hardware.graphics.mapper@2.0.so" not found
library "android.hardware.graphics.mapper@2.1.so" not found
library "android.hardware.graphics.mapper@3.0.so" not found
library "android.hardware.graphics.mapper@4.0.so" not found
library "libc++.so" not found
library "libhidlbase.so" not found
library "libgralloctypes.so" not found
library "android.hardware.graphics.common@1.2.so" not found
library "libion.so" not found
library "libz.so" not found
library "libhidlmemory.so" not found
library "android.hidl.memory@1.0.so" not found
library "vendor.qti.qspmhal@1.0.so" not found
greHome from GRE_HOME:/usr/bin
libxul.so is not found, in /usr/bin/libxul.so
Created LOG for EmbedLiteTrace
[D] onCompleted:105 - ViewPlaceholder requires a SilicaFlickable parent
Created LOG for EmbedLite
Created LOG for EmbedPrefs
Created LOG for EmbedLiteLayerManager
JavaScript error: resource://gre/modules/LoginManagerChild.jsm, line 541:
NotFoundError: WindowGlobalChild.getActor:
No such JSWindowActor 'LoginManager'
JavaScript error: resource://gre/modules/LoginManagerChild.jsm, line 541:
NotFoundError: WindowGlobalChild.getActor:
No such JSWindowActor 'LoginManager'
Call EmbedLiteApp::StopChildThread()
Apart from the LoginManager error the output is looking surprisingly clean now. But I do still need to figure this one out.Another possibility that crossed my mind is that there's a problem with the way WindowGlobalChild::GetActor() is working in general. In other words, the issue isn't really with the LoginManager at all but rather with the code for accessing it.
On the face of it this seems unlikely: the error is only showing for the LoginManager and no other actors. And there are plenty of other uses. I count 167 instances, only 9 of which are for LoginManager.
$ grep -rIn ".getActor(\"" * --include="*.js*" | wc -l 167 $ grep -rIn ".getActor(\"LoginManager\")" * --include="*.js*" | wc -l 9Nevertheless it is possible that only the LoginManager happens to be being requested. Unlikely, but possible.
To try to find out, I've added some debugging code so that something will be output whenever GetActor() is called off the WindowGlobalChild:
already_AddRefed<JSWindowActorChild> WindowGlobalChild::GetActor(
JSContext* aCx, const nsACString& aName, ErrorResult& aRv) {
MOZ_LOG(BrowsingContext::GetLog(), LogLevel::Debug, ("ACTOR: GetActor: ",
PromiseFlatCString(aName)));
return JSActorManager::GetActor(aCx, aName, aRv)
.downcast<JSWindowActorChild>();
}
I've also added some debugging closer to the action in LoginManagerChild.jsm:
static forWindow(window) {
let windowGlobal = window.windowGlobalChild;
if (windowGlobal) {
dump("ACTOR: Getting LoginManager\n");
return windowGlobal.getActor("LoginManager");
}
return null;
}
Let's see if either of those provide any insight. Unfortunately these changes require a build, so it will take a while. During the build, I'm going to look into the third possibility I thought about: that the LoginManager isn't being registered correctly.[...]
Before the build completes I realise that all of the action registering and unregistering actors happens in JSActorService.cpp. There's a hash table called mWindowActorDescriptors which stores all of the actors, alongside registration and removal methods. To help understand what's going on there it will be helpful to add some debug output here too, to expose any actors that are added or removed here. So I've cancelled the build while I add it in.
Here's an example:
void JSActorService::RegisterWindowActor(const nsACString& aName,
const WindowActorOptions& aOptions,
ErrorResult& aRv) {
MOZ_ASSERT(NS_IsMainThread());
MOZ_ASSERT(XRE_IsParentProcess());
printf("ACTOR: RegisterWindowActor: %s", PromiseFlatCString(aName));
[...]
I've added similar debug output for UnregisterWindowActor(), RegisterProcessActor() and UnregisterProcessActor() as well.Now I've set it building again. Time for a break while my laptop does all the work for me.
[...]
It turns out the break was longer than I anticipated. I thought the build might finish quickly but it's still chugging away several hours later as it heads towards bed time.
So I'll have to pick this up in the morning once it's built. I'm looking forward to finding out what's really happening with this Actor code.
If you'd like to read any of my other gecko diary entries, they're all available on my Gecko-dev Diary page.
11 Feb 2024 : Day 153 #
Yesterday we finally saw the session history start to work. But it wasn't without errors and we were still left with the following showing in the console:
Happily the embedhelper.js file is part of embedlite-components which makes it super-quick to test. No need to rebuild gecko. And the change does the trick: no more PurgeHistory errors. I experience a couple of cases where it seems to drop some items from the history, but I think this might be teething troubles (and also not just an ESR 91 issue... I'm sure I've seen it in the current release build as well). I'll have to see if I can find a way to reliably reproduce it.
What about the second error relating to LoginManagerChild.jsm then?
The code in WindowGlobalChild.cpp related to this has changed — become much simpler in fact — but I'm not yet convinced that this is the reason for the error.
There are no obvious differences in the LoginManager.jsm code itself. Just some additional telemetry and minor reformatting.
I've checked a bunch of things. The LoginManager.jsm file is contained within omni.ja. It's apparently accessed in multiple other places in both ESR 78 and ESR 91 in the same way. There is a very small change to the way it's being registered. From this:
So that's it for today, but hopefully I'll make a bit more progress on this tomorrow.
If you'd like to read any of my other gecko diary entries, they're all available on my Gecko-dev Diary page.
Comment
Warning: couldn't PurgeHistory. Was it a file download? TypeError:
legacyHistory.PurgeHistory is not a function
JavaScript error: resource://gre/modules/LoginManagerChild.jsm, line 541:
NotFoundError: WindowGlobalChild.getActor:
No such JSWindowActor 'LoginManager'
That's two separate errors. We started to look into the first of these, which is emanating from embedhelper.js. The PurgeHistory() method has been renamed to purgeHistory() in nsISHistory.idl. So with any luck if we just make the same change in embedhelper.js it'll fix the first of these.Happily the embedhelper.js file is part of embedlite-components which makes it super-quick to test. No need to rebuild gecko. And the change does the trick: no more PurgeHistory errors. I experience a couple of cases where it seems to drop some items from the history, but I think this might be teething troubles (and also not just an ESR 91 issue... I'm sure I've seen it in the current release build as well). I'll have to see if I can find a way to reliably reproduce it.
What about the second error relating to LoginManagerChild.jsm then?
JavaScript error: resource://gre/modules/LoginManagerChild.jsm, line 541:
NotFoundError: WindowGlobalChild.getActor:
No such JSWindowActor 'LoginManager'
Here's the bit of code from LoginManagerChild.jsm causing the error:
static forWindow(window) {
let windowGlobal = window.windowGlobalChild;
if (windowGlobal) {
return windowGlobal.getActor("LoginManager");
}
return null;
}
There's no change between this bit of code and the code in ESR 78. So the reason for the error must be buried a little deeper.The code in WindowGlobalChild.cpp related to this has changed — become much simpler in fact — but I'm not yet convinced that this is the reason for the error.
already_AddRefed<JSWindowActorChild> WindowGlobalChild::GetActor(
JSContext* aCx, const nsACString& aName, ErrorResult& aRv) {
return JSActorManager::GetActor(aCx, aName, aRv)
.downcast<JSWindowActorChild>();
}
The simplification is because the code has been moved in to JSActorManager.cpp, but it's really doing something that looks pretty similar.There are no obvious differences in the LoginManager.jsm code itself. Just some additional telemetry and minor reformatting.
I've checked a bunch of things. The LoginManager.jsm file is contained within omni.ja. It's apparently accessed in multiple other places in both ESR 78 and ESR 91 in the same way. There is a very small change to the way it's being registered. From this:
{
'cid': '{cb9e0de8-3598-4ed7-857b-827f011ad5d8}',
'contract_ids': ['@mozilla.org/login-manager;1'],
'jsm': 'resource://gre/modules/LoginManager.jsm',
'constructor': 'LoginManager',
},
To this:
{
'js_name': 'logins',
'cid': '{cb9e0de8-3598-4ed7-857b-827f011ad5d8}',
'contract_ids': ['@mozilla.org/login-manager;1'],
'interfaces': ['nsILoginManager'],
'jsm': 'resource://gre/modules/LoginManager.jsm',
'constructor': 'LoginManager',
},
But I don't see why that change would make any difference. So right now I'm unfortunately a bit stumped. Maybe sleeping on it will help. I guess I'll find out in the morning.So that's it for today, but hopefully I'll make a bit more progress on this tomorrow.
If you'd like to read any of my other gecko diary entries, they're all available on my Gecko-dev Diary page.
10 Feb 2024 : Day 152 #
This morning I woke to find the build had completed. Hooray! That means I can test the changes I made yesterday to add an InitSessionHistory() call into the EmbedLite code.
After installing and running the code I still see the occasional related error, but the main errors we were getting before about the sessionHistory being null are no longer appearing.
That's a small but important step. But even more important is the fact that the Back and Forwards buttons are now working as well. Not only a good sign, but also important functionality being restored. I've been finding it quite challenging using the browser without the navigation buttons. So this is a very welcome result.
A couple of additional errors are also appearing now. These are new; first another error related to the history:
This is where the call is defined, but to fix it we also now need to know where the call comes from. Doing a quick grep on the code highlights that it's being called in embedhelper.js which is part of the embedlite-components package.
Here's the relevant section:
If you'd like to read any of my other gecko diary entries, they're all available on my Gecko-dev Diary page.
Comment
After installing and running the code I still see the occasional related error, but the main errors we were getting before about the sessionHistory being null are no longer appearing.
That's a small but important step. But even more important is the fact that the Back and Forwards buttons are now working as well. Not only a good sign, but also important functionality being restored. I've been finding it quite challenging using the browser without the navigation buttons. So this is a very welcome result.
A couple of additional errors are also appearing now. These are new; first another error related to the history:
Warning: couldn't PurgeHistory. Was it a file download? TypeError:
legacyHistory.PurgeHistory is not a function
But also an error about the LoginManager:
JavaScript error: resource://gre/modules/LoginManagerChild.jsm, line 541:
NotFoundError: WindowGlobalChild.getActor:
No such JSWindowActor 'LoginManager'
Starting with the first error, the PurgeHistory() method certainly exists in nsISHistory.idl:
/** * Called to purge older documents from history. * Documents can be removed from session history for various * reasons. For example to control memory usage of the browser, to * prevent users from loading documents from history, to erase evidence of * prior page loads etc... * * @param numEntries The number of toplevel documents to be * purged from history. During purge operation, * the latest documents are maintained and older * 'numEntries' documents are removed from history. * @throws <code>NS_SUCCESS_LOSS_OF_INSIGNIFICANT_DATA</code> * Purge was vetod. * @throws <code>NS_ERROR_FAILURE</code> numEntries is * invalid or out of bounds with the size of history. */ void PurgeHistory(in long aNumEntries);It's no longer present in ESR 91 though. Let's find out why not.
$ git log -1 -S "PurgeHistory" docshell/shistory/nsISHistory.idl
commit f9f96d23ca42f359e143d0ae98234021e86179a7
Author: Andreas Farre <farre@mozilla.com>
Date: Wed Sep 16 14:51:01 2020 +0000
Bug 1662410 - Part 1: Fix usage of ChildSHistory.legacySHistory . r=peterv
ChildSHistory.legacySHistory isn't valid for content processes when
session history in the parent is enabled. We try to fix this by either
delegating to the parent by IPC or move the implementation partially
or as a whole to the parent.
Differential Revision: https://phabricator.services.mozilla.com/D89353
This is definitely the problem that's causing the issue, as we can see in the diff:
$ git diff f9f96d23ca42f359e143d0ae98234021e86179a7~ \
f9f96d23ca42f359e143d0ae98234021e86179a7 \
-- docshell/shistory/nsISHistory.idl
diff --git a/docshell/shistory/nsISHistory.idl b/docshell/shistory/
nsISHistory.idl
index 3d914924c94d..1f5b9c5477e9 100644
--- a/docshell/shistory/nsISHistory.idl
+++ b/docshell/shistory/nsISHistory.idl
@@ -87,7 +87,7 @@ interface nsISHistory: nsISupports
* @throws <code>NS_ERROR_FAILURE</code> numEntries is
* invalid or out of bounds with the size of history.
*/
- void PurgeHistory(in long aNumEntries);
+ void purgeHistory(in long aNumEntries);
/**
* Called to register a listener for the session history component.
@@ -255,7 +255,7 @@ interface nsISHistory: nsISupports
* Collect docshellIDs from aEntry's children and remove those
* entries from history.
*
- * @param aEntry Children docshellID's will be collected from
+ * @param aEntry Children docshellID's will be collected from
* this entry and passed to RemoveEntries as aIDs.
*/
[noscript, notxpcom]
@@ -265,7 +265,7 @@ interface nsISHistory: nsISupports
void Reload(in unsigned long aReloadFlags);
[notxpcom] void EnsureCorrectEntryAtCurrIndex(in nsISHEntry aEntry);
-
+
[notxpcom] void EvictContentViewersOrReplaceEntry(in nsISHEntry aNewSHEntry,
in bool aReplace);
nsISHEntry createEntry();
Helpfully we can immediately see from this that the call hasn't exactly been removed. It's just been slightly renamed, switching the initial uppercase "P" for a lowercase "p". With any luck then, this should be an easy fix.This is where the call is defined, but to fix it we also now need to know where the call comes from. Doing a quick grep on the code highlights that it's being called in embedhelper.js which is part of the embedlite-components package.
Here's the relevant section:
case "embedui:addhistory": {
// aMessage.data contains: 1) list of 'links' loaded from DB, 2) current 'index'.
let docShell = content.docShell;
let sessionHistory = docShell.QueryInterface(Ci.nsIWebNavigation).sessionHistory;
let legacyHistory = sessionHistory.legacySHistory;
let ioService = Cc["@mozilla.org/network/io-service;1"].getService(Ci.nsIIOService);
try {
// Initially we load the current URL and that creates an unneeded entry in History -> purge it.
if (legacyHistory.count > 0) {
legacyHistory.PurgeHistory(1);
}
} catch (e) {
Logger.warn("Warning: couldn't PurgeHistory. Was it a file download?", e);
}
Changing legacyHistory.PurgeHistory(1) to legacyHistory.purgeHistory(1) will hopefully do the trick. Unfortunately I'm already out of time for today, so we'll have to wait until tomorrow to find out for certain. But I feel like we're making progress.If you'd like to read any of my other gecko diary entries, they're all available on my Gecko-dev Diary page.
9 Feb 2024 : Day 151 #
Yesterday we were comparing ESR 78 and ESR 91 to see why the session history is initialised in the former but not in the latter. We reached this bit of code in ESR 91:
But when we stepped through the program we found it wasn't true. That's because mIsTopLevelContent was set to false, which itself was because BrowsingContext::mParentWindow was non-null.
That makes sense intuitively: if the window has a parent, then it's not a top level element.
However with ESR 78 we have a similar situation, because the code looks like this:
Although that seems like a fair question, there's another question I'd like to try to answer first. The D100348 change that caused this problem in the first place moves the InitSessionHistory() call from nsWebBrowser::Create() to sFrameLoader::TryRemoteBrowserInternal(). So clearly the authors of that change thought the execution flow would go via the latter method. So it would be good to know why it isn't for us using EmbedLite.
Looking through the code, there is at least one route to getting to InitSessionHistory() via TryRemoteBrowserInternal() that looks like this (I routed this by hand... quite laborious):
The top half of this, from LoadURI() to ReallyStartLoadingInternal() is certainly being called when the code is executed. We can see that by placing some breakpoints on various methods and checking the results:
Once again, the reason is that there's a parent browsing context:
The route via LoadURI() in ESR 91 is far less direct. Given this, one potential solution, which I think I rather like, is to explicitly initialise the session history where EmbedLite initialises the window, like this:
So, with this change made, it's time to set off the build. It'll take a while to complete, but once it has, we can give it a spin to test it.
For the record, and while the build is running, here is the backtrace for nsFrameLoader::MaybeCreateDocShell():
The build is running, so that's it for today. We'll find out whether it worked or not tomorrow.
If you'd like to read any of my other gecko diary entries, they're all available on my Gecko-dev Diary page.
Comment
// If we are an in-process browser, we want to set up our session history.
if (mIsTopLevelContent && mOwnerContent->IsXULElement(nsGkAtoms::browser) &&
!mOwnerContent->HasAttr(kNameSpaceID_None, nsGkAtoms::disablehistory)) {
// XXX(nika): Set this up more explicitly?
mPendingBrowsingContext->InitSessionHistory();
}
As you can see, this could potentially initialise the session history as long as the condition is true going in to it.But when we stepped through the program we found it wasn't true. That's because mIsTopLevelContent was set to false, which itself was because BrowsingContext::mParentWindow was non-null.
That makes sense intuitively: if the window has a parent, then it's not a top level element.
However with ESR 78 we have a similar situation, because the code looks like this:
if (aBrowsingContext->IsTop()) {
aBrowsingContext->InitSessionHistory();
}
But this is being executed, suggesting that in this case there is no parent window. Why the difference?Although that seems like a fair question, there's another question I'd like to try to answer first. The D100348 change that caused this problem in the first place moves the InitSessionHistory() call from nsWebBrowser::Create() to sFrameLoader::TryRemoteBrowserInternal(). So clearly the authors of that change thought the execution flow would go via the latter method. So it would be good to know why it isn't for us using EmbedLite.
Looking through the code, there is at least one route to getting to InitSessionHistory() via TryRemoteBrowserInternal() that looks like this (I routed this by hand... quite laborious):
nsFrameLoader::LoadURI() Document::InitializeFrameLoader() Document::MaybeInitializeFinalizeFrameLoaders() nsFrameLoader::ReallyStartLoading() nsFrameLoader::ReallyStartLoadingInternal() nsFrameLoader::EnsureRemoteBrowser() nsFrameLoader::TryRemoteBrowser() nsFrameLoader::TryRemoteBrowserInternal() BrowsingContext::InitSessionHistory()In other words a call to LoadURI() can then call InitializeFrameLoader() which can then call MaybeInitializeFinalizeFrameLoaders() and so on, all the way to InitSessionHistory().
The top half of this, from LoadURI() to ReallyStartLoadingInternal() is certainly being called when the code is executed. We can see that by placing some breakpoints on various methods and checking the results:
Thread 10 "GeckoWorkerThre" hit Breakpoint 4, nsFrameLoader::
LoadURI (this=this@entry=0x7fc1419ef0, aURI=0x7fc15feb90,
aTriggeringPrincipal=0x7fc11a47d0, aCsp=0x7ee8004780,
aOriginalSrc=aOriginalSrc@entry=true) at dom/base/nsFrameLoader.cpp:600
600 bool aOriginalSrc) {
(gdb) c
Continuing.
Thread 10 "GeckoWorkerThre" hit Breakpoint 3, mozilla::dom::Document::
InitializeFrameLoader (this=this@entry=0x7fc11a1960,
aLoader=aLoader@entry=0x7fc1419ef0) at dom/base/Document.cpp:8999
8999 nsresult Document::InitializeFrameLoader(nsFrameLoader* aLoader) {
(gdb) c
Continuing.
Thread 10 "GeckoWorkerThre" hit Breakpoint 2, mozilla::dom::Document::
MaybeInitializeFinalizeFrameLoaders (this=0x7fc11a1960)
at dom/base/Document.cpp:9039
9039 void Document::MaybeInitializeFinalizeFrameLoaders() {
(gdb) c
Continuing.
[...]
Thread 10 "GeckoWorkerThre" hit Breakpoint 9, nsFrameLoader::
ReallyStartLoadingInternal (this=this@entry=0x7fc147afe0)
at dom/base/nsFrameLoader.cpp:664
664 nsresult nsFrameLoader::ReallyStartLoadingInternal() {
(gdb) p mIsRemoteFrame
$3 = false
(gdb)
But that's as far as it goes. Beyond that it's the fact that mIsRemoteFrame is false that prevents the InitSessionHistory() from being called, because the relevant code inside ReallyStartLoadingInternal() looks like this:
if (IsRemoteFrame()) {
if (!EnsureRemoteBrowser()) {
NS_WARNING("Couldn't create child process for iframe.");
return NS_ERROR_FAILURE;
}
[...]
We can understand this better by also considering what IsRemoteFrame() is doing:
bool nsFrameLoader::IsRemoteFrame() {
if (mIsRemoteFrame) {
MOZ_ASSERT(!GetDocShell(), "Found a remote frame with a DocShell");
return true;
}
return false;
}
If it jumps past this, then it looks like the next place where InitSessionHistory() could potentially get called is in nsFrameLoader::MaybeCreateDocShell(). Maybe that's the place it's supposed to happen for non-remote frames. But in that case we're back to the same problem of mPendingBrowsingContext being false that we started with.Once again, the reason is that there's a parent browsing context:
(gdb) p mPendingBrowsingContext.mRawPtr->mParentWindow.mRawPtr->
mBrowsingContext.mRawPtr
$8 = (mozilla::dom::BrowsingContext *) 0x7fc0ba3f00
Contrast this with the ESR 78 way of doing things. In that case the call to >nsWebBrowser::Create() is coming from EmbedLiteViewChild::InitGeckoWindow(). There the BrowsingContext is explicitly created detached and so has no parent widget.The route via LoadURI() in ESR 91 is far less direct. Given this, one potential solution, which I think I rather like, is to explicitly initialise the session history where EmbedLite initialises the window, like this:
void
EmbedLiteViewChild::InitGeckoWindow(const uint32_t parentId,
mozilla::dom::BrowsingContext
*parentBrowsingContext,
const bool isPrivateWindow,
const bool isDesktopMode,
const bool isHidden)
{
[...]
RefPtr<BrowsingContext> browsingContext = BrowsingContext::CreateDetached
(nullptr, parentBrowsingContext, nullptr, EmptyString(),
BrowsingContext::Type::Content);
browsingContext->SetUsePrivateBrowsing(isPrivateWindow); // Needs to be called before attaching
browsingContext->EnsureAttached();
browsingContext->InitSessionHistory();
[...]
mWebBrowser = nsWebBrowser::Create(mChrome, mWidget, browsingContext,
nullptr);
In this case the session history is created broadly speaking where it would have been in ESR 78. This should be safe given that it isn't initialised at any later time. And the nice thing about it is that it doesn't require any changes to the core gecko code, only to the EmbedLite code.So, with this change made, it's time to set off the build. It'll take a while to complete, but once it has, we can give it a spin to test it.
For the record, and while the build is running, here is the backtrace for nsFrameLoader::MaybeCreateDocShell():
(gdb) bt
#0 nsFrameLoader::MaybeCreateDocShell (this=this@entry=0x7fc1476da0)
at dom/base/nsFrameLoader.cpp:2241
#1 0x0000007ff2def6c0 in nsFrameLoader::ReallyStartLoadingInternal
(this=this@entry=0x7fc1476da0)
at dom/base/nsFrameLoader.cpp:751
#2 0x0000007ff2defa88 in nsFrameLoader::ReallyStartLoading
(this=this@entry=0x7fc1476da0)
at dom/base/nsFrameLoader.cpp:656
#3 0x0000007ff2d25198 in mozilla::dom::Document::
MaybeInitializeFinalizeFrameLoaders (this=0x7fc11f88d0)
at dom/base/Document.cpp:9068
#4 0x0000007ff2cceebc in mozilla::detail::RunnableMethodArguments<>::applyImpl
<mozilla::dom::Document, void (mozilla::dom::Document::*)()>
(mozilla::dom::Document*, void (mozilla::dom::Document::*)(),
mozilla::Tuple<>&, std::integer_sequence<unsigned long>)
(args=..., m=<optimized out>, o=<optimized out>)
at ${PROJECT}/obj-build-mer-qt-xr/dist/include/nsThreadUtils.h:1151
#5 mozilla::detail::RunnableMethodArguments<>::apply<mozilla::dom::Document,
void (mozilla::dom::Document::*)()> (m=<optimized out>, o=<optimized out>,
this=<optimized out>)
at ${PROJECT}/obj-build-mer-qt-xr/dist/include/nsThreadUtils.h:1154
[...]
#20 0x0000007ff4e7e564 in js::RunScript (cx=cx@entry=0x7fc0233bd0, state=...)
at js/src/vm/Interpreter.cpp:395
#21 0x0000007ff4e7e9b0 in js::InternalCallOrConstruct (cx=cx@entry=0x7fc0233bd0,
args=..., construct=construct@entry=js::NO_CONSTRUCT,
reason=reason@entry=js::CallReason::Call) at js/src/vm/Interpreter.cpp:543
If we get the right outcome from this build this backtrace may not be useful any more, but it's worth taking a record just in case.The build is running, so that's it for today. We'll find out whether it worked or not tomorrow.
If you'd like to read any of my other gecko diary entries, they're all available on my Gecko-dev Diary page.
8 Feb 2024 : Day 150 #
FOSDEM'24 is over and it's back to semi-normal again now. In particular, as promised, I'm going to be back to writing daily dev diaries and hopefully getting the Sailfish Browser into better shape running ESR 91. My first action is going to be to continue in my attempt to get the back and forwards buttons working by fixing the sessionHistory. Then I'll move back up my task stack to return to the Set-Fetch-* headers and DuckDuckGo.
But before jumping back into coding let me also say how great it was to meet so many interesting people — both old friends and new &mdsah; at FOSDEM. The Linux on Mobile stand was buzzing the entire time with a crowd of curious FOSS enthusiasts. I was also really happy to have the chance to talk about these dev diaries in the FOSS on Mobile Devices devroom. In case you missed it there's a video available, as well as the slides and the LaTeX source for the slides.
I'm not going to go over my talk again here, but I will take the opportunity to share two of the images from the slides.
First, to reiterate my thanks for everyone who has been following this dev diary, helping with coding, sharing ideas, performing testing, writing their own code changes (to either this or other packages that gecko relies on), producing images, boosting or liking on Mastodon, commenting on things. I really appreciate it all. I've tried to capture everyone, but I apologise if I manage to miss anyone off.
The other graphic I wanted to share summarises my progress to date. This is of course a significant simplification: it's been a lot more messy than this in practice. But it serves as some kind of overview.
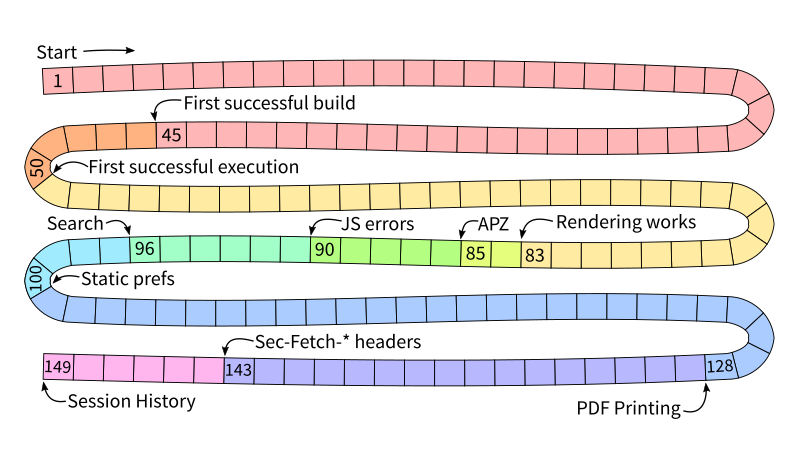
As you can see, this takes us right up to today and the session history.
Before this latest two week break I wrote myself some notes to help me get back up to speed when I returned. Here's what my notes say:
I'm glad I wrote this, because otherwise I'd have completely forgotten the details of what I was working on by now. So let's continue where we left off.
First off I'll try debugging ESR 78 to get a backtrace for the call to the nsFrameLoader constructor.
Unfortunately, although when I place a breakpoint on nsFrameLoader::Create() it does get hit when using ESR 78, it's not possible to extract a backtrace. The debugger just complains and tries to output a core dump.
Happily by placing breakpoints on promising looking methods that call it or its parents, I'm able to step back through the calls and place a breakpoint on nsGenericHTMLFrameElement::GetContentWindow() which, if hit, is guaranteed to then call nsFrameLoader::Create(). And it does git hit. And from this method it's possible to extract a backtrace:
This involves reading through each of the methods as they are in ESR 91 to see if they're different at any point. If they are I can run ESR 91 to establish whether that difference is the actual cause of the different execution paths between the two.
But before I do that I want to review things again.
On both ESR 78 and ESR 91 the nsFrameLoader::Create() method is called. However on ESR 91 changeset D100348 means that this no longer calls InitSessionHistory().
Instead, and because of this change, on ESR 91 it's the TryRemoteBrowserInternal() method needs to be called in order for the session history to be initialised. on ESR 91 the route to that method appears to be via nsFrameLoader::GetBrowsingContext().
On ESR 78 the GetBrowsingContext() method gets called like this:
In ESR 78 we have a slightly different version of this method:
Having said that, there is also a reference to InitSessionHistory() in MaybeCreateDocShell() so we ought to check that too:
Which is why the session isn't being initialised here.
That's enough digging for today. More tomorrow.
If you'd like to read any of my other gecko diary entries, they're all available on my Gecko-dev Diary page.
Comment
But before jumping back into coding let me also say how great it was to meet so many interesting people — both old friends and new &mdsah; at FOSDEM. The Linux on Mobile stand was buzzing the entire time with a crowd of curious FOSS enthusiasts. I was also really happy to have the chance to talk about these dev diaries in the FOSS on Mobile Devices devroom. In case you missed it there's a video available, as well as the slides and the LaTeX source for the slides.
I'm not going to go over my talk again here, but I will take the opportunity to share two of the images from the slides.
First, to reiterate my thanks for everyone who has been following this dev diary, helping with coding, sharing ideas, performing testing, writing their own code changes (to either this or other packages that gecko relies on), producing images, boosting or liking on Mastodon, commenting on things. I really appreciate it all. I've tried to capture everyone, but I apologise if I manage to miss anyone off.
The other graphic I wanted to share summarises my progress to date. This is of course a significant simplification: it's been a lot more messy than this in practice. But it serves as some kind of overview.
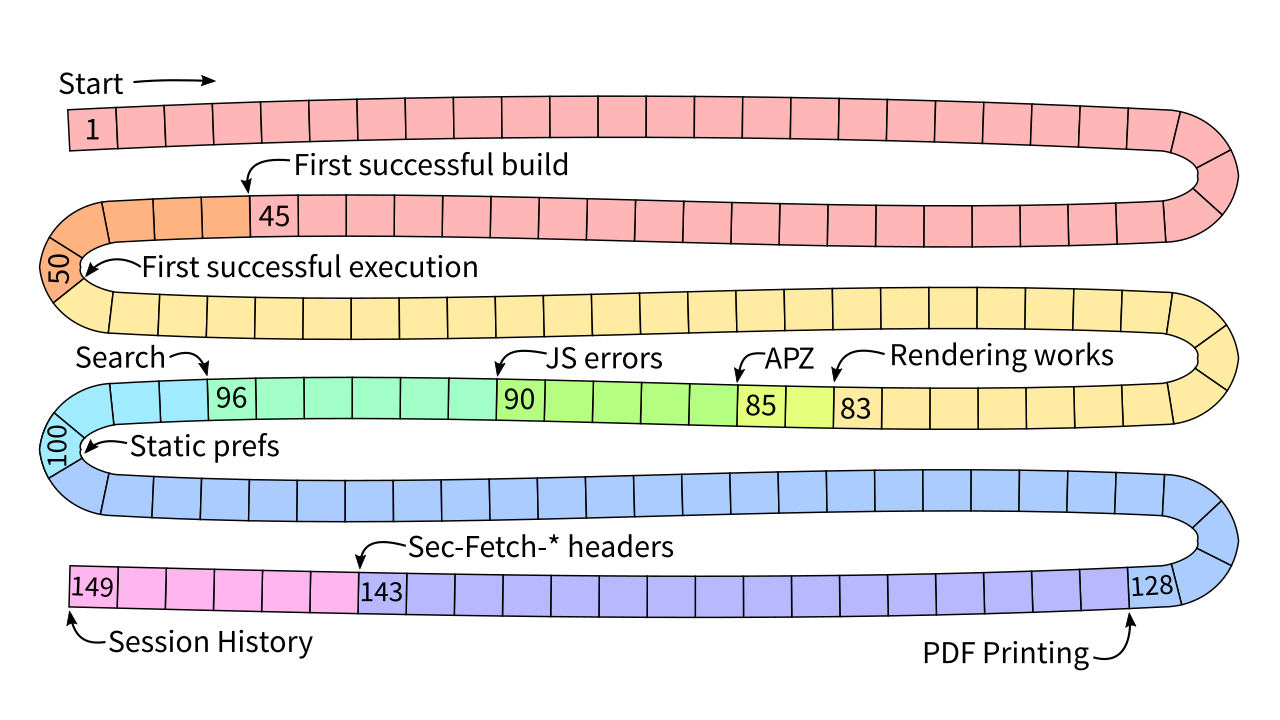
As you can see, this takes us right up to today and the session history.
Before this latest two week break I wrote myself some notes to help me get back up to speed when I returned. Here's what my notes say:
When I get back I'll be back to posting these dev diaries again. And as a note to myself, when I do, my first action must be to figure out why nsFrameLoader is being created in ESR 78 but not ESR 91. That might hold the key to why the sessionHistory isn't getting called in ESR 91. And as a last resort, I can always revert commit 140a4164598e0c9ed53.
I'm glad I wrote this, because otherwise I'd have completely forgotten the details of what I was working on by now. So let's continue where we left off.
First off I'll try debugging ESR 78 to get a backtrace for the call to the nsFrameLoader constructor.
Unfortunately, although when I place a breakpoint on nsFrameLoader::Create() it does get hit when using ESR 78, it's not possible to extract a backtrace. The debugger just complains and tries to output a core dump.
Happily by placing breakpoints on promising looking methods that call it or its parents, I'm able to step back through the calls and place a breakpoint on nsGenericHTMLFrameElement::GetContentWindow() which, if hit, is guaranteed to then call nsFrameLoader::Create(). And it does git hit. And from this method it's possible to extract a backtrace:
Thread 10 "GeckoWorkerThre" hit Breakpoint 4, nsGenericHTMLFrameElement::
GetContentWindowInternal (this=this@entry=0x7fba4f9560)
at dom/html/nsGenericHTMLFrameElement.cpp:100
100 EnsureFrameLoader();
(gdb) bt
#0 nsGenericHTMLFrameElement::GetContentWindowInternal
(this=this@entry=0x7fba4f9560)
at dom/html/nsGenericHTMLFrameElement.cpp:100
#1 0x0000007ff39194bc in nsGenericHTMLFrameElement::GetContentWindow
(this=this@entry=0x7fba4f9560)
at dom/html/nsGenericHTMLFrameElement.cpp:116
#2 0x0000007ff3518bf0 in mozilla::dom::HTMLIFrameElement_Binding::
get_contentWindow (cx=0x7fb82263f0, obj=..., void_self=0x7fba4f9560,
args=...)
at HTMLIFrameElementBinding.cpp:857
#3 0x0000007ff35b8290 in mozilla::dom::binding_detail::GenericGetter
<mozilla::dom::binding_detail::NormalThisPolicy, mozilla::dom::
binding_detail::ThrowExceptions> (cx=0x7fb82263f0, argc=<optimized out>,
vp=<optimized out>)
at dist/include/js/CallArgs.h:245
#4 0x0000007ff4e19610 in CallJSNative (args=..., reason=js::CallReason::Getter,
native=0x7ff35b80c0 <mozilla::dom::binding_detail::GenericGetter
<mozilla::dom::binding_detail::NormalThisPolicy, mozilla::dom::
binding_detail::ThrowExceptions>(JSContext*, unsigned int, JS::Value*)>,
cx=0x7fb82263f0)
at dist/include/js/CallArgs.h:285
#5 js::InternalCallOrConstruct (cx=cx@entry=0x7fb82263f0, args=...,
construct=construct@entry=js::NO_CONSTRUCT,
reason=reason@entry=js::CallReason::Getter) at js/src/vm/Interpreter.cpp:585
#6 0x0000007ff4e1a268 in InternalCall (reason=js::CallReason::Getter, args=...,
cx=0x7fb82263f0)
at js/src/vm/Interpreter.cpp:648
#7 js::Call (reason=js::CallReason::Getter, rval=..., args=..., thisv=...,
fval=..., cx=0x7fb82263f0)
at js/src/vm/Interpreter.cpp:665
#8 js::CallGetter (cx=cx@entry=0x7fb82263f0, thisv=..., getter=...,
getter@entry=..., rval=...)
at js/src/vm/Interpreter.cpp:789
[...]
#44 0x0000007fefa864ac in QThread::exec() () from /usr/lib64/libQt5Core.so.5
#45 0x0000007fefa8b0e8 in ?? () from /usr/lib64/libQt5Core.so.5
#46 0x0000007fef971a4c in ?? () from /lib64/libpthread.so.0
#47 0x0000007fef65b89c in ?? () from /lib64/libc.so.6
(gdb)
By reading through all of the functions in this backtrace, starting at the top and moving downwards, I need to find out where the ESR 91 code diverges from ESR 78 in a way that means this method doesn't get called with ESR 91.This involves reading through each of the methods as they are in ESR 91 to see if they're different at any point. If they are I can run ESR 91 to establish whether that difference is the actual cause of the different execution paths between the two.
But before I do that I want to review things again.
On both ESR 78 and ESR 91 the nsFrameLoader::Create() method is called. However on ESR 91 changeset D100348 means that this no longer calls InitSessionHistory().
Instead, and because of this change, on ESR 91 it's the TryRemoteBrowserInternal() method needs to be called in order for the session history to be initialised. on ESR 91 the route to that method appears to be via nsFrameLoader::GetBrowsingContext().
On ESR 78 the GetBrowsingContext() method gets called like this:
Thread 8 "GeckoWorkerThre" hit Breakpoint 3, nsFrameLoader::GetBrowsingContext
(this=0x7f89886f80)
at dom/base/nsFrameLoader.cpp:3194
3194 if (IsRemoteFrame()) {
(gdb) bt
#0 nsFrameLoader::GetBrowsingContext (this=0x7f89886f80)
at dom/base/nsFrameLoader.cpp:3194
#1 0x0000007fbb5ad250 in mozilla::dom::HTMLIFrameElement::
MaybeStoreCrossOriginFeaturePolicy (this=0x7f895858f0)
at dom/html/HTMLIFrameElement.cpp:252
#2 mozilla::dom::HTMLIFrameElement::MaybeStoreCrossOriginFeaturePolicy
(this=0x7f895858f0)
at dom/html/HTMLIFrameElement.cpp:241
#3 0x0000007fbb5ad390 in mozilla::dom::HTMLIFrameElement::RefreshFeaturePolicy
(this=0x7f895858f0, aParseAllowAttribute=aParseAllowAttribute@entry=true)
at dom/html/HTMLIFrameElement.cpp:329
#4 0x0000007fbb5ad4b8 in mozilla::dom::HTMLIFrameElement::BindToBrowsingContext
(this=<optimized out>, aBrowsingContext=<optimized out>)
at dom/html/HTMLIFrameElement.cpp:72
#5 0x0000007fbc7abf60 in mozilla::dom::BrowsingContext::Embed
(this=<optimized out>)
at docshell/base/BrowsingContext.cpp:505
#6 0x0000007fbaae320c in nsFrameLoader::MaybeCreateDocShell (this=0x7f89886f80)
at dist/include/mozilla/RefPtr.h:313
#7 0x0000007fbaae5468 in nsFrameLoader::ReallyStartLoadingInternal
(this=this@entry=0x7f89886f80)
at dom/base/nsFrameLoader.cpp:612
#8 0x0000007fbaae5864 in nsFrameLoader::ReallyStartLoading (
dwarf2read.c:10473: internal-error: process_die_scope::process_die_scope
(die_info*, dwarf2_cu*): Assertion `!m_die->in_process' failed.
A problem internal to GDB has been detected,
further debugging may prove unreliable.
On ESR 91 the GetBrowsingContext() method never seems to get called at all. But I've put breakpoints on most of the other places in the backtrace to check whether they get hit on ESR 91:
Breakpoint 3 at 0x7ff3925d4c: file dom/html/HTMLIFrameElement.cpp, line 221.
(gdb) b HTMLIFrameElement::MaybeStoreCrossOriginFeaturePolicy
Note: breakpoint 3 also set at pc 0x7ff3925d4c.
Breakpoint 4 at 0x7ff3925d4c: file dom/html/HTMLIFrameElement.cpp, line 221.
(gdb) b HTMLIFrameElement::RefreshFeaturePolicy
Breakpoint 5 at 0x7ff3925fb0: file dom/html/HTMLIFrameElement.cpp, line 266.
(gdb) b HTMLIFrameElement::BindToBrowsingContext
Breakpoint 6 at 0x7ff3926134: file dom/html/HTMLIFrameElement.cpp, line 70.
(gdb) b BrowsingContext::Embed
Breakpoint 7 at 0x7ff4ab2b0c: file ${PROJECT}/obj-build-mer-qt-xr/dist/include/
mozilla/RefPtr.h, line 313.
(gdb) b nsFrameLoader::MaybeCreateDocShell
Breakpoint 8 at 0x7ff2dedc98: file dom/base/nsFrameLoader.cpp, line 2179.
(gdb) b nsFrameLoader::ReallyStartLoadingInternal
Breakpoint 9 at 0x7ff2def63c: file dom/base/nsFrameLoader.cpp, line 664.
(gdb) info break
Num Type Disp Enb What
2 breakpoint keep y in nsFrameLoader::GetBrowsingContext()
at dom/base/nsFrameLoader.cpp:3489
3 breakpoint keep y in mozilla::dom::HTMLIFrameElement::
MaybeStoreCrossOriginFeaturePolicy()
at dom/html/HTMLIFrameElement.cpp:221
4 breakpoint keep y in mozilla::dom::HTMLIFrameElement::
MaybeStoreCrossOriginFeaturePolicy()
at dom/html/HTMLIFrameElement.cpp:221
5 breakpoint keep y in mozilla::dom::HTMLIFrameElement::
RefreshFeaturePolicy(bool)
at dom/html/HTMLIFrameElement.cpp:266
6 breakpoint keep y in mozilla::dom::HTMLIFrameElement::
BindToBrowsingContext(mozilla::dom::BrowsingContext*)
at dom/html/HTMLIFrameElement.cpp:70
7 breakpoint keep y in mozilla::dom::BrowsingContext::Embed()
at ${PROJECT}/obj-build-mer-qt-xr/dist/include/mozilla/
RefPtr.h:313
8 breakpoint keep y in nsFrameLoader::MaybeCreateDocShell()
at dom/base/nsFrameLoader.cpp:2179
9 breakpoint keep y in nsFrameLoader::ReallyStartLoadingInternal()
at dom/base/nsFrameLoader.cpp:664
(gdb) r
And one of them does get hit:
Thread 10 "GeckoWorkerThre" hit Breakpoint 9, nsFrameLoader::
ReallyStartLoadingInternal (this=this@entry=0x7fc160da30)
at dom/base/nsFrameLoader.cpp:664
664 nsresult nsFrameLoader::ReallyStartLoadingInternal() {
(gdb) c
Continuing.
Let's see what happens next...
Thread 10 "GeckoWorkerThre" hit Breakpoint 8, nsFrameLoader::
MaybeCreateDocShell(this=this@entry=0x7fc160da30)
at dom/base/nsFrameLoader.cpp:2179
2179 nsresult nsFrameLoader::MaybeCreateDocShell() {
(gdb) c
Continuing.
Thread 10 "GeckoWorkerThre" hit Breakpoint 7, mozilla::dom::BrowsingContext::
Embed (this=0x7fc161aa70)
at docshell/base/BrowsingContext.cpp:711
711 if (auto* frame = HTMLIFrameElement::FromNode(mEmbedderElement)) {
(gdb) c
Continuing.
Thread 10 "GeckoWorkerThre" hit Breakpoint 6, mozilla::dom::HTMLIFrameElement::
BindToBrowsingContext (this=0x7fc14db4c0)
at dom/html/HTMLIFrameElement.cpp:70
70 void HTMLIFrameElement::BindToBrowsingContext(BrowsingContext*) {
(gdb) c
Continuing.
Thread 10 "GeckoWorkerThre" hit Breakpoint 5, mozilla::dom::HTMLIFrameElement::
RefreshFeaturePolicy (this=0x7fc14db4c0,
aParseAllowAttribute=aParseAllowAttribute@entry=true) at
dom/html/HTMLIFrameElement.cpp:266
266 void HTMLIFrameElement::RefreshFeaturePolicy(bool aParseAllowAttribute) {
(gdb) c
Continuing.
Thread 10 "GeckoWorkerThre" hit Breakpoint 3, mozilla::dom::HTMLIFrameElement::
MaybeStoreCrossOriginFeaturePolicy (this=this@entry=0x7fc14db4c0)
at dom/html/HTMLIFrameElement.cpp:221
221 void HTMLIFrameElement::MaybeStoreCrossOriginFeaturePolicy() {
(gdb) c
Continuing.
Thread 10 "GeckoWorkerThre" hit Breakpoint 2, nsFrameLoader::GetBrowsingContext
(this=0x7fc160da30)
at dom/base/nsFrameLoader.cpp:3489
3489 if (mNotifyingCrash) {
(gdb)
As a quick reminder, this is what the inside of this method looks like:
BrowsingContext* nsFrameLoader::GetBrowsingContext() {
if (mNotifyingCrash) {
if (mPendingBrowsingContext && mPendingBrowsingContext->EverAttached()) {
return mPendingBrowsingContext;
}
return nullptr;
}
if (IsRemoteFrame()) {
Unused << EnsureRemoteBrowser();
} else if (mOwnerContent) {
Unused << MaybeCreateDocShell();
}
return GetExtantBrowsingContext();
}
Let's compare this to the relevant variable values.
(gdb) p mNotifyingCrash $1 = false (gdb) p mIsRemoteFrame $2 = false (gdb) p mOwnerContent $3 = (mozilla::dom::Element *) 0x7fc14db4c0 (gdb)With these values IsRemoteFrame() will return false and the MaybeCreateDocShell() path will be entered, rather than the EnsureRemoteBrowser() path that we want.
In ESR 78 we have a slightly different version of this method:
BrowsingContext* nsFrameLoader::GetBrowsingContext() {
if (IsRemoteFrame()) {
Unused << EnsureRemoteBrowser();
} else if (mOwnerContent) {
Unused << MaybeCreateDocShell();
}
return GetExtantBrowsingContext();
}
But given the values of the variables, we'll get the same result:
(gdb) p mIsRemoteFrame
$1 = false
(gdb) p mOwnerContent
$2 = (
dwarf2read.c:10473: internal-error: process_die_scope::process_die_scope
(die_info*, dwarf2_cu*): Assertion `!m_die->in_process' failed.
A problem internal to GDB has been detected,
further debugging may prove unreliable.
Quit this debugging session? (y or n) n
(gdb) p (mOwnerContent != 0)
$3 = true
(gdb)
It's beginning to look like the problem here is that IsRemoteFrame() is always returning false, so that the code we want to get called never gets called.Having said that, there is also a reference to InitSessionHistory() in MaybeCreateDocShell() so we ought to check that too:
Thread 10 "GeckoWorkerThre" hit Breakpoint 8, nsFrameLoader::MaybeCreateDocShell
(this=this@entry=0x7fc160da30)
at dom/base/nsFrameLoader.cpp:2179
2179 nsresult nsFrameLoader::MaybeCreateDocShell() {
(gdb) n
2180 if (GetDocShell()) {
(gdb)
nsFrameLoader::GetBrowsingContext (this=0x7fc160da30) at dom/base/
nsFrameLoader.cpp:3500
3500 return GetExtantBrowsingContext();
(gdb)
mozilla::dom::HTMLIFrameElement::MaybeStoreCrossOriginFeaturePolicy
(this=this@entry=0x7fc14db4c0)
at dom/html/HTMLIFrameElement.cpp:232
232 RefPtr<BrowsingContext> browsingContext = mFrameLoader->
GetBrowsingContext();
(gdb)
234 if (!browsingContext || !browsingContext->IsContentSubframe()) {
(gdb)
238 if (ContentChild* cc = ContentChild::GetSingleton()) {
(gdb)
232 RefPtr<BrowsingContext> browsingContext = mFrameLoader->
GetBrowsingContext();
(gdb)
nsFrameLoader::MaybeCreateDocShell (this=this@entry=0x7fc160da30) at
dom/base/nsFrameLoader.cpp:2237
2237 InvokeBrowsingContextReadyCallback();
(gdb) n
2239 mIsTopLevelContent = mPendingBrowsingContext->IsTopContent();
(gdb)
2241 if (mIsTopLevelContent) {
(gdb)
2252 nsCOMPtr<nsIDocShellTreeOwner> parentTreeOwner;
(gdb)
1363 ${PROJECT}/obj-build-mer-qt-xr/dist/include/nsCOMPtr.h:
No such file or directory.
(gdb)
859 in ${PROJECT}/obj-build-mer-qt-xr/dist/include/nsCOMPtr.h
(gdb)
2258 RefPtr<EventTarget> chromeEventHandler;
(gdb)
2259 bool parentIsContent = parentDocShell->GetBrowsingContext()->
IsContent();
(gdb)
2260 if (parentIsContent) {
(gdb)
2263 parentDocShell->GetChromeEventHandler(getter_AddRefs
(chromeEventHandler));
(gdb)
289 ${PROJECT}/obj-build-mer-qt-xr/dist/include/mozilla/RefPtr.h:
No such file or directory.
(gdb)
2278 nsCOMPtr<nsPIDOMWindowOuter> newWindow = docShell->GetWindow();
(gdb) n
2285 newWindow->SetFrameElementInternal(mOwnerContent);
(gdb)
2288 if (mOwnerContent->IsXULElement(nsGkAtoms::browser) &&
(gdb)
2295 if (!docShell->Initialize()) {
(gdb)
2301 NS_ENSURE_STATE(mOwnerContent);
(gdb)
We've now reached this condition, which we really want the programme counter to enter:
// If we are an in-process browser, we want to set up our session history.
if (mIsTopLevelContent && mOwnerContent->IsXULElement(nsGkAtoms::browser) &&
!mOwnerContent->HasAttr(kNameSpaceID_None, nsGkAtoms::disablehistory)) {
// XXX(nika): Set this up more explicitly?
mPendingBrowsingContext->InitSessionHistory();
}
But it isn't to be:
(gdb) p mIsTopLevelContent $4 = false (gdb) n 2304 if (mIsTopLevelContent && mOwnerContent->IsXULElement(nsGkAtoms::browser) && (gdb) 2315 HTMLIFrameElement* iframe = HTMLIFrameElement::FromNode(mOwnerContent); (gdb)The value of the mIsTopLevelContent comes from earlier in the same method:
mIsTopLevelContent = mPendingBrowsingContext->IsTopContent();Checking in BrowsingContext.h we see this:
bool IsTopContent() const { return IsContent() && IsTop(); }
[...]
bool IsContent() const { return mType == Type::Content; }
[...]
bool IsTop() const { return !GetParent(); }
And to round this off, the GetParent() method is defined in BrowsingContext.cpp like this:
BrowsingContext* BrowsingContext::GetParent() const {
return mParentWindow ? mParentWindow->GetBrowsingContext() : nullptr;
}
This call to IsTop() matches the call that the call to InitSessionHistory() is conditioned on elsewhere as well. Let's check the relevant values:
(gdb) p mPendingBrowsingContext.mRawPtr->mType
$5 = mozilla::dom::BrowsingContext::Type::Content
(gdb) p mPendingBrowsingContext.mRawPtr->mParentWindow
$6 = {mRawPtr = 0x7fc11bb430}
(gdb)
This means that GetParent() is returning a non-null value, hence IsTo() must be returning false.Which is why the session isn't being initialised here.
That's enough digging for today. More tomorrow.
If you'd like to read any of my other gecko diary entries, they're all available on my Gecko-dev Diary page.
25 Jan 2024 : Day 149 #
It's my last dev diary before taking a 14 day break from gecko development today. I'm not convinced that I've made the right decision: there's a part of me that thinks I should forge on ahead and just make all of the things fit into the time I have available. But there's also the realist in me that says something has to give.
So there will be no dev diary tomorrow or until the 8th February, at which point I'll start up again. Ostensibly the reason is so that I can get my presentations together for FOSDEM. I want to do a decent job with the presentations. But I also have a lot going on at work right now. So it's necessary.
But there's still development to do today. Yesterday I set the build running after having added /browser/components/sessionstore to the embedlite/moz.build file. I was hoping this would result in SessionStore.jsm and its dependencies being added to omni.ja.
The package built fine. But after installing it on my device, the new files weren't to be found: they didn't make it into the archive. Worse than that, they've not even made it into the obj-build-mer-qt-x folder on my laptop. That means they're still not getting included in the build.
It rather makes sense as well. The LOCAL_INCLUDES value should, if I'm understanding correctly, list places where C++ headers might be found. This should affect JavaScript files at all.
So I've spent the day digging around in the build system trying to figure out what needs to be changed to get them where they need to be. I'm certain there's an easy answer, but I just can't seem to figure it out.
I thought about trying to override SessionStore.jsm as a component, but since it doesn't actually seem to be a component itself, this didn't work either.
So after much flapping around, I've decided just to patch out the functionality from the SessionStoreFunctions.jsm file. That doesn't feel like the right way to do this, but until someone suggests a better way (which I'm all open to!) this should at least be a pretty simple fix.
Let's see.
I've built a new version of gecko-dev with the changes applied, installed them on my phone and it's now time to run them.
What's clear is that the SessionStore errors have now gone, which is great. But fixing those errors sadly hasn't fixed the Back and Forwards buttons.
Let's look at this other error then. It's caused by the last line in this code block:
So there are three potential reasons why this might be failing. First it could be that docShell no longer supports the WebNavigation interface. Second it could be that WebNavigation has changed so it no longer contains a sessionHitory value. Third it could be that the value is still there, but it's set to null.
From the nsDocShell class definition in nsDocShell.h it's clear that the interface is still supported:
There are indeed some differences. In ESR 91 it's called in BrowsingContext::CreateFromIPC() and BrowsingContext::Attach() whereas in ESR 78 it's called in BrowsingContext::Attach(). Both versions also have it being called from BrowsingContext::DidSet().
I should put some breakpoints on those methods to see which, if any, is being called. And I should do it for both versions.
See here's the result for ESR 91:
Immediately on examining the backtrace it's clear something odd is happening. The callee is BrowsingContext::DidSet() which is the only location where the call is made in both ESR 78 and ESR 91. So that does rather beg the question of why it's not getting called in ESR 91.
Digging back through the backtrace further, it eventually materialises that the difference is happening in nsWebBrowser::Create(). There's this bit of code in ESR 78 that looks like this:
Placing a breakpoint on nsFrameLoader::TryRemoteBrowserInternal() shows that it's not being called on ESR 91.
The interesting thing is that it appears that if EnsureRemoteBrowser() gets called in this bit of code:
From here, things pan out. The EnsureRemoteBrowser() method is called by all of these methods:
However this isn't true in ESR 78 where the constructor does get called. It's almost certainly worthwhile finding out about this difference. But unfortunately I'm out of time for today.
I have to wrap things up. As I mentioned previously, I'm taking a break for two weeks to give myself a bit more breathing space as I prepare for FOSDEM, which I'm really looking forward to. If you're travelling to Brussels yourself then I hope to see you there. You'll be able to find me mostly on the Linux on Mobile stand.
When I get back I'll be back to posting these dev diaries again. And as a note to myself, when I do, my first action must be to figure out why nsFrameLoader is being created in ESR 78 but not ESR 91. That might hold the key to why the sessionHistory isn't getting called in ESR 91. And as a last resort, I can always revert commit 140a4164598e0c9ed53.
If you'd like to read any of my other gecko diary entries, they're all available on my Gecko-dev Diary page.
Comment
So there will be no dev diary tomorrow or until the 8th February, at which point I'll start up again. Ostensibly the reason is so that I can get my presentations together for FOSDEM. I want to do a decent job with the presentations. But I also have a lot going on at work right now. So it's necessary.
But there's still development to do today. Yesterday I set the build running after having added /browser/components/sessionstore to the embedlite/moz.build file. I was hoping this would result in SessionStore.jsm and its dependencies being added to omni.ja.
The package built fine. But after installing it on my device, the new files weren't to be found: they didn't make it into the archive. Worse than that, they've not even made it into the obj-build-mer-qt-x folder on my laptop. That means they're still not getting included in the build.
It rather makes sense as well. The LOCAL_INCLUDES value should, if I'm understanding correctly, list places where C++ headers might be found. This should affect JavaScript files at all.
So I've spent the day digging around in the build system trying to figure out what needs to be changed to get them where they need to be. I'm certain there's an easy answer, but I just can't seem to figure it out.
I thought about trying to override SessionStore.jsm as a component, but since it doesn't actually seem to be a component itself, this didn't work either.
So after much flapping around, I've decided just to patch out the functionality from the SessionStoreFunctions.jsm file. That doesn't feel like the right way to do this, but until someone suggests a better way (which I'm all open to!) this should at least be a pretty simple fix.
Let's see.
I've built a new version of gecko-dev with the changes applied, installed them on my phone and it's now time to run them.
$ sailfish-browser
[D] unknown:0 - Using Wayland-EGL
library "libGLESv2_adreno.so" not found
library "eglSubDriverAndroid.so" not found
greHome from GRE_HOME:/usr/bin
libxul.so is not found, in /usr/bin/libxul.so
Created LOG for EmbedLiteTrace
[D] onCompleted:105 - ViewPlaceholder requires a SilicaFlickable parent
Created LOG for EmbedLite
Created LOG for EmbedPrefs
Created LOG for EmbedLiteLayerManager
JavaScript error: chrome://embedlite/content/embedhelper.js, line 259:
TypeError: sessionHistory is null
Call EmbedLiteApp::StopChildThread()
Redirecting call to abort() to mozalloc_abort
The log output is encouragingly quiet. There is one error stating that sessionHistory is null. I think this is unrelated to the SessionStore changes I've made, but it's still worth looking into this to fix it. Maybe this will be what fixes the Back and Forwards buttons?What's clear is that the SessionStore errors have now gone, which is great. But fixing those errors sadly hasn't fixed the Back and Forwards buttons.
Let's look at this other error then. It's caused by the last line in this code block:
case "embedui:addhistory": {
// aMessage.data contains: 1) list of 'links' loaded from DB, 2) current
// 'index'.
let docShell = content.docShell;
let sessionHistory = docShell.QueryInterface(Ci.nsIWebNavigation).
sessionHistory;
let legacyHistory = sessionHistory.legacySHistory;
The penultimate line is essentially saying "View the docShell object as a WebNavigation object and access the sessionHistory value stored inside it".So there are three potential reasons why this might be failing. First it could be that docShell no longer supports the WebNavigation interface. Second it could be that WebNavigation has changed so it no longer contains a sessionHitory value. Third it could be that the value is still there, but it's set to null.
From the nsDocShell class definition in nsDocShell.h it's clear that the interface is still supported:
class nsDocShell final : public nsDocLoader,
public nsIDocShell,
public nsIWebNavigation,
public nsIBaseWindow,
public nsIRefreshURI,
public nsIWebProgressListener,
public nsIWebPageDescriptor,
public nsIAuthPromptProvider,
public nsILoadContext,
public nsINetworkInterceptController,
public nsIDeprecationWarner,
public mozilla::SupportsWeakPtr {
So let's check that WebNavigation interface, defined in the nsIWebNavigation.idl file. The field is still there in the interface definition:
/** * The session history object used by this web navigation instance. This * object will be a mozilla::dom::ChildSHistory object, but is returned as * nsISupports so it can be called from JS code. */ [binaryname(SessionHistoryXPCOM)] readonly attribute nsISupports sessionHistory;Although the interface is being accessed from nsDocShell, when we look at the code we can see that the history itself is coming from elsewhere:
mozilla::dom::ChildSHistory* GetSessionHistory() {
return mBrowsingContext->GetChildSessionHistory();
}
[...]
RefPtr<mozilla::dom::BrowsingContext> mBrowsingContext;
This provides us with an opportunity, because it means we can place a breakpoint here to see what it's doing.
$ gdb sailfish-browser
[...]
(gdb) b nsDocShell::GetSessionHistory
Breakpoint 1 at 0x7fbc7b37c4: nsDocShell::GetSessionHistory. (10 locations)
(gdb) b BrowsingContext::GetChildSessionHistory
Breakpoint 2 at 0x7fbc7b376c: file docshell/base/BrowsingContext.cpp, line 3314.
(gdb) c
Thread 10 "GeckoWorkerThre" hit Breakpoint 1, nsDocShell::GetSessionHistory
(this=0x7f80aa9280)
at ${PROJECT}/obj-build-mer-qt-xr/dist/include/mozilla/RefPtr.h:313
313 ${PROJECT}/obj-build-mer-qt-xr/dist/include/mozilla/RefPtr.h:
No such file or directory.
(gdb) c
Continuing.
Thread 10 "GeckoWorkerThre" hit Breakpoint 2, mozilla::dom::BrowsingContext::
GetChildSessionHistory (this=0x7f80c58e90)
at docshell/base/BrowsingContext.cpp:3314
3314 ChildSHistory* BrowsingContext::GetChildSessionHistory() {
(gdb) b mChildSessionHistory
Function "mChildSessionHistory" not defined.
Make breakpoint pending on future shared library load? (y or [n]) n
(gdb) p mChildSessionHistory
$1 = {mRawPtr = 0x0}
(gdb)
So this value is unset, but we'd expect it to be set as a consequence of a call to CreateChildSHistory():
void BrowsingContext::CreateChildSHistory() {
MOZ_ASSERT(IsTop());
MOZ_ASSERT(GetHasSessionHistory());
MOZ_DIAGNOSTIC_ASSERT(!mChildSessionHistory);
// Because session history is global in a browsing context tree, every process
// that has access to a browsing context tree needs access to its session
// history. That is why we create the ChildSHistory object in every process
// where we have access to this browsing context (which is the top one).
mChildSessionHistory = new ChildSHistory(this);
// If the top browsing context (this one) is loaded in this process then we
// also create the session history implementation for the child process.
// This can be removed once session history is stored exclusively in the
// parent process.
mChildSessionHistory->SetIsInProcess(IsInProcess());
}
As I'm looking through this code in ESR 91 and ESR 78 I notice that the above method has changed: the call to SetIsInProcess() is new. I wonder if that will ultimately be related to why this isn't being set? I'm thinking that the location where the creation happens may be different.There are indeed some differences. In ESR 91 it's called in BrowsingContext::CreateFromIPC() and BrowsingContext::Attach() whereas in ESR 78 it's called in BrowsingContext::Attach(). Both versions also have it being called from BrowsingContext::DidSet().
I should put some breakpoints on those methods to see which, if any, is being called. And I should do it for both versions.
See here's the result for ESR 91:
$ gdb sailfish-browser [...] (gdb) b BrowsingContext::CreateChildSHistory Function "BrowsingContext::CreateChildSHistory" not defined. Make breakpoint pending on future shared library load? (y or [n]) y Breakpoint 1 (BrowsingContext::CreateChildSHistory) pending. (gdb) r [...]The breakpoint is never hit and the creation never occurs. In contrast, on ESR 78 we get a hit before the first page has loaded:
$ gdb sailfish-browser
[...]
(gdb) b BrowsingContext::CreateChildSHistory
Function "BrowsingContext::CreateChildSHistory" not defined.
Make breakpoint pending on future shared library load? (y or [n]) y
Breakpoint 1 (BrowsingContext::CreateChildSHistory) pending.
(gdb) r
[...]
Thread 8 "GeckoWorkerThre" hit Breakpoint 1, mozilla::dom::BrowsingContext::
CreateChildSHistory (this=this@entry=0x7f889dc120)
at obj-build-mer-qt-xr/dist/include/mozilla/cxxalloc.h:33
33 obj-build-mer-qt-xr/dist/include/mozilla/cxxalloc.h:
No such file or directory.
(gdb) bt
#0 mozilla::dom::BrowsingContext::CreateChildSHistory
(this=this@entry=0x7f889dc120)
at obj-build-mer-qt-xr/dist/include/mozilla/cxxalloc.h:33
#1 0x0000007fbc7c933c in mozilla::dom::BrowsingContext::DidSet
(aOldValue=<optimized out>, this=0x7f889dc120)
at docshell/base/BrowsingContext.cpp:2356
#2 mozilla::dom::syncedcontext::Transaction<mozilla::dom::BrowsingContext>::
Apply(mozilla::dom::BrowsingContext*)::{lambda(auto:1)#1}::operator()
<std::integral_constant<unsigned long, 37ul> >(std::integral_constant
<unsigned long, 37ul>) const (this=<optimized out>, this=<optimized out>,
idx=...)
at obj-build-mer-qt-xr/dist/include/mozilla/dom/SyncedContextInlines.h:137
[...]
#8 0x0000007fbc7cb484 in mozilla::dom::BrowsingContext::SetHasSessionHistory
<bool> (this=this@entry=0x7f889dc120,
aValue=aValue@entry=@0x7fa6e1da57: true)
at obj-build-mer-qt-xr/dist/include/mozilla/OperatorNewExtensions.h:47
#9 0x0000007fbc7cb54c in mozilla::dom::BrowsingContext::InitSessionHistory
(this=0x7f889dc120)
at docshell/base/BrowsingContext.cpp:2316
#10 0x0000007fbc7cb590 in mozilla::dom::BrowsingContext::InitSessionHistory
(this=this@entry=0x7f889dc120)
at obj-build-mer-qt-xr/dist/include/mozilla/dom/BrowsingContext.h:161
#11 0x0000007fbc901fac in nsWebBrowser::Create (aContainerWindow=
<optimized out>, aParentWidget=<optimized out>,
aBrowsingContext=aBrowsingContext@entry=0x7f889dc120,
aInitialWindowChild=aInitialWindowChild@entry=0x0)
at toolkit/components/browser/nsWebBrowser.cpp:158
#12 0x0000007fbca950e8 in mozilla::embedlite::EmbedLiteViewChild::
InitGeckoWindow (this=0x7f88bca840, parentId=0, parentBrowsingContext=0x0,
isPrivateWindow=<optimized out>, isDesktopMode=false)
at obj-build-mer-qt-xr/dist/include/nsCOMPtr.h:847
[...]
#33 0x0000007fb735e89c in ?? () from /lib64/libc.so.6
(gdb) c
Continuing.
[...]
This could well be our smoking gun. I need to check back through the backtrace to understand the process happening on ESR 78 and then establish why something similar isn't happening on ESR 91. Progress!Immediately on examining the backtrace it's clear something odd is happening. The callee is BrowsingContext::DidSet() which is the only location where the call is made in both ESR 78 and ESR 91. So that does rather beg the question of why it's not getting called in ESR 91.
Digging back through the backtrace further, it eventually materialises that the difference is happening in nsWebBrowser::Create(). There's this bit of code in ESR 78 that looks like this:
// If the webbrowser is a content docshell item then we won't hear any
// events from subframes. To solve that we install our own chrome event
// handler that always gets called (even for subframes) for any bubbling
// event.
if (aBrowsingContext->IsTop()) {
aBrowsingContext->InitSessionHistory();
}
NS_ENSURE_SUCCESS(docShellAsWin->Create(), nullptr);
docShellTreeOwner->AddToWatcher(); // evil twin of Remove in SetDocShell(0)
docShellTreeOwner->AddChromeListeners();
You can see the InitSessionHistory() call in there which eventually leads to the creation of our sessinHistory object. In ESR 91 that same bit of code looks like this:
// If the webbrowser is a content docshell item then we won't hear any
// events from subframes. To solve that we install our own chrome event
// handler that always gets called (even for subframes) for any bubbling
// event.
nsresult rv = docShell->InitWindow(nullptr, docShellParentWidget, 0, 0, 0, 0);
if (NS_WARN_IF(NS_FAILED(rv))) {
return nullptr;
}
docShellTreeOwner->AddToWatcher(); // evil twin of Remove in SetDocShell(0)
docShellTreeOwner->AddChromeListeners();
Where has the InitSessionHistory() gone? It should be possible to find out using a bit of git log searching. Here we're following the rule of using git blame to find out about lines that have been added and git log -S to find out about lines that have been removed.
$ git log -1 -S InitSessionHistory toolkit/components/browser/nsWebBrowser.cpp
commit 140a4164598e0c9ed537a377cf66ef668a7fbc25
Author: Randell Jesup <rjesup@wgate.com>
Date: Mon Feb 1 22:57:12 2021 +0000
Bug 1673617 - Create BrowsingContext::mChildSessionHistory more
aggressively, r=nika
Differential Revision: https://phabricator.services.mozilla.com/D100348
Just looking at this change, it removes the call to InitSessionHistory() in nsWebBrowser::Create() and moves it to nsFrameLoader::TryRemoteBrowserInternal. There are some related changes in the parent Bug 1673617, but looking through those it doesn't seem that they're anything we need to worry about.Placing a breakpoint on nsFrameLoader::TryRemoteBrowserInternal() shows that it's not being called on ESR 91.
The interesting thing is that it appears that if EnsureRemoteBrowser() gets called in this bit of code:
BrowsingContext* nsFrameLoader::GetBrowsingContext() {
if (mNotifyingCrash) {
if (mPendingBrowsingContext && mPendingBrowsingContext->EverAttached()) {
return mPendingBrowsingContext;
}
return nullptr;
}
if (IsRemoteFrame()) {
Unused << EnsureRemoteBrowser();
} else if (mOwnerContent) {
Unused << MaybeCreateDocShell();
}
return GetExtantBrowsingContext();
}
If the first path in the second condition is followed then the InitSessionHistory() would get called too. If this gets called by the InitSessionHistory() doesn't, it would imply that IsRemoteFrame() must be false. But if it is false then MaybeCreateDocShell() could get called, which also has a call to InitSessionHistory() like this:
// If we are an in-process browser, we want to set up our session history.
if (mIsTopLevelContent && mOwnerContent->IsXULElement(nsGkAtoms::browser) &&
!mOwnerContent->HasAttr(kNameSpaceID_None, nsGkAtoms::disablehistory)) {
// XXX(nika): Set this up more explicitly?
mPendingBrowsingContext->InitSessionHistory();
}
I wonder what's going on around about this code then. Checking with the debugger the answer turns out to be that apparently, nsFrameLoader::GetExtantBrowsingContext() simply doesn't get called either.From here, things pan out. The EnsureRemoteBrowser() method is called by all of these methods:
- nsFrameLoader::GetBrowsingContext()
- nsFrameLoader::ShowRemoteFrame()
- nsFrameLoader::ReallyStartLoadingInternal()
However this isn't true in ESR 78 where the constructor does get called. It's almost certainly worthwhile finding out about this difference. But unfortunately I'm out of time for today.
I have to wrap things up. As I mentioned previously, I'm taking a break for two weeks to give myself a bit more breathing space as I prepare for FOSDEM, which I'm really looking forward to. If you're travelling to Brussels yourself then I hope to see you there. You'll be able to find me mostly on the Linux on Mobile stand.
When I get back I'll be back to posting these dev diaries again. And as a note to myself, when I do, my first action must be to figure out why nsFrameLoader is being created in ESR 78 but not ESR 91. That might hold the key to why the sessionHistory isn't getting called in ESR 91. And as a last resort, I can always revert commit 140a4164598e0c9ed53.
If you'd like to read any of my other gecko diary entries, they're all available on my Gecko-dev Diary page.
24 Jan 2024 : Day 148 #
After much digging around in the code and gecko project structure I eventually decided that the best thing to do is implement a Sailfish-specific version of the SessionStore.jsm module.
Unfortunately this isn't just a case of copying the file over to embedlite-components, because it has some dependencies. These are listed at the top of the file. Let's go through and figure out which ones are already available, which we can remove, which we can copy over directly to embedlite-components and which we have to reimplement ourselves.
Here's the code that relates to the dependencies:
In addition to the above there's also the SessionStore.jsm file itself.
As you can see there's still a fair bit of uncertainty in the table. But also, quite a large number of the dependencies are already available.
From the code it looks like the functionality is around saving and restoring sessions, including tab data, cookies, window positions and the like. Some of this isn't relevant on Sailfish OS (there's no point saving and restoring window sizes) or is already handled by other parts of the system (cookie storage). In fact, it's not clear that this module is providing any additional functionality that sailfish-browser actually needs.
Given this my focus will be on creating a minimal implementation that doesn't error when called but performs very little functionality in practice. That will hopefully make the task tractable.
It's early in the morning here still, but time for me to start work; so I'll pick this up again tonight.
[...]
It's now late evening and I have just a bit of time to move some files around. I've started by copying the SessionStore.jsm file into the embedlite-components project, alongside the other files I think I can copy without making changes. Apart from SessionStore.jsm, I've tried to copy over only files that don't require dependencies, or where the dependencies are all available.
The final step is to hook them up into the system so that they get included and can be accessed by other parts of the code. And this is where I hit a problem. The embedlite-components package contains two types of JavaScript entity. The first are in the jscomps folder. These all seem to be components that have a defined interface (they satisfy a "contract") as specified in the EmbedLiteJSComponents.manifest file. Here's an example of the entry for the AboutRedirector component:
So I'm going to need to find some other way to do this. As it's late, it will take me a while to come up with an alternative. But my immediate thought is that maybe I can just add the missing files in to the EmbedLite build process. It looks like this is being controlled by the embedlite/moz.build file. So I've added the component folder /browser/components/sessionstore into the list of directories there:
If you'd like to read any of my other gecko diary entries, they're all available on my Gecko-dev Diary page.
Comment
Unfortunately this isn't just a case of copying the file over to embedlite-components, because it has some dependencies. These are listed at the top of the file. Let's go through and figure out which ones are already available, which we can remove, which we can copy over directly to embedlite-components and which we have to reimplement ourselves.
Here's the code that relates to the dependencies:
const { PrivateBrowsingUtils } = ChromeUtils.import(
"resource://gre/modules/PrivateBrowsingUtils.jsm"
);
const { Services } = ChromeUtils.import("resource://gre/modules/Services.jsm");
const { TelemetryTimestamps } = ChromeUtils.import(
"resource://gre/modules/TelemetryTimestamps.jsm"
);
const { XPCOMUtils } = ChromeUtils.import(
"resource://gre/modules/XPCOMUtils.jsm"
);
ChromeUtils.defineModuleGetter(
this,
"SessionHistory",
"resource://gre/modules/sessionstore/SessionHistory.jsm"
);
XPCOMUtils.defineLazyServiceGetters(this, {
gScreenManager: ["@mozilla.org/gfx/screenmanager;1", "nsIScreenManager"],
});
XPCOMUtils.defineLazyModuleGetters(this, {
AppConstants: "resource://gre/modules/AppConstants.jsm",
AsyncShutdown: "resource://gre/modules/AsyncShutdown.jsm",
BrowserWindowTracker: "resource:///modules/BrowserWindowTracker.jsm",
DevToolsShim: "chrome://devtools-startup/content/DevToolsShim.jsm",
E10SUtils: "resource://gre/modules/E10SUtils.jsm",
GlobalState: "resource:///modules/sessionstore/GlobalState.jsm",
HomePage: "resource:///modules/HomePage.jsm",
PrivacyFilter: "resource://gre/modules/sessionstore/PrivacyFilter.jsm",
PromiseUtils: "resource://gre/modules/PromiseUtils.jsm",
RunState: "resource:///modules/sessionstore/RunState.jsm",
SessionCookies: "resource:///modules/sessionstore/SessionCookies.jsm",
SessionFile: "resource:///modules/sessionstore/SessionFile.jsm",
SessionSaver: "resource:///modules/sessionstore/SessionSaver.jsm",
SessionStartup: "resource:///modules/sessionstore/SessionStartup.jsm",
TabAttributes: "resource:///modules/sessionstore/TabAttributes.jsm",
TabCrashHandler: "resource:///modules/ContentCrashHandlers.jsm",
TabState: "resource:///modules/sessionstore/TabState.jsm",
TabStateCache: "resource:///modules/sessionstore/TabStateCache.jsm",
TabStateFlusher: "resource:///modules/sessionstore/TabStateFlusher.jsm",
setTimeout: "resource://gre/modules/Timer.jsm",
});
Heres's a table to summarise. I've ordered them by their current status to help highlight what needs work and what type of work it is.| Module | Variable | Status |
|---|---|---|
| gre/modules/PrivateBrowsingUtils.jsm" | PrivateBrowsingUtils | Available |
| gre/modules/Services.jsm | Services | Available |
| gre/modules/TelemetryTimestamps.jsm | TelemetryTimestamps | Available |
| gre/modules/XPCOMUtils.jsm | XPCOMUtils | Available |
| gre/modules/sessionstore/SessionHistory.jsm | SessionHistory | Available |
| gre/modules/AppConstants.jsm | AppConstants | Available |
| gre/modules/AsyncShutdown.jsm | AsyncShutdown | Available |
| gre/modules/E10SUtils.jsm | E10SUtils | Available |
| gre/modules/sessionstore/PrivacyFilter.jsm | PrivacyFilter | Available |
| gre/modules/PromiseUtils.jsm | PromiseUtils | Available |
| gre/modules/Timer.jsm | setTimeout | Available |
| @mozilla.org/gfx/screenmanager;1 | gScreenManager | Drop |
| modules/ContentCrashHandlers.jsm | TabCrashHandler | Drop |
| devtools-startup/content/DevToolsShim.jsm | DevToolsShim | Drop |
| modules/sessionstore/TabAttributes.jsm | TabAttributes | Copy |
| modules/sessionstore/GlobalState.jsm | GlobalState | Copy |
| modules/sessionstore/RunState.jsm | RunState | Copy |
| modules/BrowserWindowTracker.jsm | BrowserWindowTracker | Drop |
| modules/sessionstore/SessionCookies.jsm | SessionCookies | Drop? |
| modules/HomePage.jsm | HomePage | Drop? |
| modules/sessionstore/SessionFile.jsm | SessionFile | Copy/drop? |
| modules/sessionstore/SessionSaver.jsm | SessionSaver | Copy/drop? |
| modules/sessionstore/SessionStartup.jsm | SessionStartup | Copy/drop? |
| modules/sessionstore/TabState.jsm | TabState | Copy/drop? |
| modules/sessionstore/TabStateCache.jsm | TabStateCache | Copy/drop? |
| modules/sessionstore/TabStateFlusher.jsm | TabStateFlusher | Copy/drop? |
In addition to the above there's also the SessionStore.jsm file itself.
As you can see there's still a fair bit of uncertainty in the table. But also, quite a large number of the dependencies are already available.
From the code it looks like the functionality is around saving and restoring sessions, including tab data, cookies, window positions and the like. Some of this isn't relevant on Sailfish OS (there's no point saving and restoring window sizes) or is already handled by other parts of the system (cookie storage). In fact, it's not clear that this module is providing any additional functionality that sailfish-browser actually needs.
Given this my focus will be on creating a minimal implementation that doesn't error when called but performs very little functionality in practice. That will hopefully make the task tractable.
It's early in the morning here still, but time for me to start work; so I'll pick this up again tonight.
[...]
It's now late evening and I have just a bit of time to move some files around. I've started by copying the SessionStore.jsm file into the embedlite-components project, alongside the other files I think I can copy without making changes. Apart from SessionStore.jsm, I've tried to copy over only files that don't require dependencies, or where the dependencies are all available.
$ find . -iname "SessionStore.jsm"
./gecko-dev/browser/components/sessionstore/SessionStore.jsm
$ cp ./gecko-dev/browser/components/sessionstore/SessionStore.jsm \
../../embedlite-components/jscomps/
$ cp ./gecko-dev/browser/components/sessionstore/TabAttributes.jsm \
../../embedlite-components/jscomps/
$ cp ./gecko-dev/browser/components/sessionstore/GlobalState.jsm \
../../embedlite-components/jscomps/
$ cp ./gecko-dev/browser/components/sessionstore/RunState.jsm \
../../embedlite-components/jscomps/
I've also been through and removed all of the code that used any of the dropped dependency. And in fact I've gone ahead and dropped all of the modules marked as "Drop" or "Copy/drop" in the table above. Despite the quantity of code in the original files, it really doesn't look like there's much functionality that's needed for sailfish-browser in these scripts. But having the functions available may turn out to be useful at some point in the future and in the meantime if the module just provides methods that don't do anything, then they will at least be successful in suppressing the errors.The final step is to hook them up into the system so that they get included and can be accessed by other parts of the code. And this is where I hit a problem. The embedlite-components package contains two types of JavaScript entity. The first are in the jscomps folder. These all seem to be components that have a defined interface (they satisfy a "contract") as specified in the EmbedLiteJSComponents.manifest file. Here's an example of the entry for the AboutRedirector component:
# AboutRedirector.js
component {59f3da9a-6c88-11e2-b875-33d1bd379849} AboutRedirector.js
contract @mozilla.org/network/protocol/about;1?what= {59f3da9a-6c88-11e2-b875-33d1bd379849}
contract @mozilla.org/network/protocol/about;1?what=embedlite {59f3da9a-6c88-11e2-b875-33d1bd379849}
contract @mozilla.org/network/protocol/about;1?what=certerror {59f3da9a-6c88-11e2-b875-33d1bd379849}
contract @mozilla.org/network/protocol/about;1?what=home {59f3da9a-6c88-11e2-b875-33d1bd379849}
Our SessionStore.jsm files can't be added like this because they're not components with defined interfaces in this way. The other type are in the jsscipts folder. These aren't components and the files would fit perfectly in there. But they are all accessed using a particular path and the chrome:// scheme, like this:
const { NetErrorHelper } = ChromeUtils.import("chrome://embedlite/content/NetErrorHelper.jsm")
This won't work for SessionStore.jsm, which is expected to be accessed like this:
XPCOMUtils.defineLazyModuleGetters(this, {
SessionStore: "resource:///modules/sessionstore/SessionStore.jsm",
});
Different location; different approach.So I'm going to need to find some other way to do this. As it's late, it will take me a while to come up with an alternative. But my immediate thought is that maybe I can just add the missing files in to the EmbedLite build process. It looks like this is being controlled by the embedlite/moz.build file. So I've added the component folder /browser/components/sessionstore into the list of directories there:
LOCAL_INCLUDES += [
'!/build',
'/browser/components/sessionstore',
'/dom/base',
'/dom/ipc',
'/gfx/layers',
'/gfx/layers/apz/util',
'/hal',
'/js/xpconnect/src',
'/netwerk/base/',
'/toolkit/components/resistfingerprinting',
'/toolkit/xre',
'/widget',
'/xpcom/base',
'/xpcom/build',
'/xpcom/threads',
'embedhelpers',
'embedprocess',
'embedshared',
'embedthread',
'modules',
'utils',
]
I've added the directory, cleaned out the build directory and started off a fresh build to run overnight. Let's see whether that worked in the morning.If you'd like to read any of my other gecko diary entries, they're all available on my Gecko-dev Diary page.
23 Jan 2024 : Day 147 #
Last night I woke up in a mild panic. This happens sometimes, usually when I have a lot going on and I feel like I'm in danger of dropping the ball.
This seems to be my mind's (or maybe my body's?) way of telling me that I need to get my priorities straight. That there's something that I need to get done, resolved or somehow dealt with, and I need to do it urgently or I'll continue to have sleepless nights until I do.
The reason for this particular panic was my FOSDEM preparations, combined with a build up of projects at work that are coming to a head. For FOSDEM I have two talks to prepare (one about this blog, the other related to my work), the Linux on Mobile stand to help organise, the Sailfish community dinner on the Saturday to help organise, support for the HPC, Big Data & Data Science devroom on the Saturday, and also with the Python devroom on the Sunday. It's going to be a crazy busy event. But it's actually the run-up to it and the fact I've to still write my presentations, that's losing me sleep.
It's all fine: it's under control. But in order to prevent it spiralling out of control, I'm going to be taking a break from gecko development for a couple of weeks until things have calmed down. This will slow down development, which of course saddens me because more than anything else I just want ESR 91 to end up in a good, releasable, state. But as others wiser than I am have already cautioned, this also means keeping a positive and healthy state of mind.
I'll finish my last post on Day 149 (that's this Thursday). I'll start back up again on Thursday the 8th February, assuming all goes to plan!
But for the next couple of days there's still development to be done, so let's get straight back to it.
Today I'm still attempting to fix the NS_ERROR_FILE_NOT_FOUND error coming from SessionStore.jsm which I believe may be causing the Back and Forwards buttons in the browser to fail. It's become clear that the SessionStore.jsm file itself is missing (along with a bunch of other files listed in gecko-dev/browser/components/sessionstore/moz.build) but what's not clear is whether the problem is that the files should be there, or that the calls to the methods in this file shouldn't be there.
Overnight while lying in bed I came up with some kind of plan to help move things forwards. The call to the failing method is happening in updateSessionStoreForWindow() and this is only called by the exported method UpdateSessionStoreForWindow(). As far as I can tell this isn't executed by any JavaScript code, but because it has an IPDL interface it's possible for it to be called by C++ code as well.
And sure enough, it's being called twice in WindowGlobalParent.cpp. Once at the end of the WriteFormDataAndScrollToSessionStore() method on line 1260, like this:
The debugger will place it on the first line it can after the point you request. Because both of the cases I'm interested in are right at the end of the methods they're called in, when I attempt to put a breakpoint on the exact line the debugger places it instead in the next method along in the source code. That isn't much use for what I needed.
Hence I've placed them a little earlier in the code instead: on the first lines where they actually stick.
You'll notice from the output that there's another — earlier — NS_ERROR_FILE_NOT_FOUND error before the breakpoint hits. This is coming from a different spot: line 120 of SessionStoreFunctions.jsm rather than the line 105 we were looking at here.
This new error is called from line 54 of the same file (we can see from from the backtrace in the log output) which is in the UpdateSessionStoreForStorage() method in the file. So where is this being called from?
This is all good stuff. Looking through the ESR 78 code there doesn't appear to be anything equivalent in CanonicalBrowsingContext.cpp. But now that I know this is where the problem is happening, I can at least find the commit that introduced the changes and use that to find out more. Here's the output from git blame, but please forgive the terrible formatting: it's very hard to line-wrap this output cleanly.
It seems to me that, in essence, the gecko-dev/browser/components/ directory where the missing files can be found contains modules that relate to the browser chrome and Firefox user interface, rather than the rendering engine. Typically this kind of content would be replicated on Sailfish OS by adding amended versions into the embedlite-components project. If it's browser-specific material, that would make sense.
As an example, in Firefox we can find AboutRedirector.h and AboutRedirector.cpp files , whereas on Sailfish OS there's a replacement AboutRedirectory.js file in embedlite-components. Similarly Firefox has a DownloadsManager.jsm file that can be found in gecko-dev/browser/components/newtab/lib/. This seems to be replaced by EmbedliteDownloadManager.js in embedlite-components. Both have similar functionality based on the names of the methods contained in them, but the implementations are quite different.
Assuming this is correct, probably the right way to tackle the missing SessionStore.jsm and related files would be to move copies into embedlite-components. They'll need potentially quite big changes to align them with sailfish-browser, although hopefully this will largely be removing functionality that has already been implemented elsewhere (for example cookie save and restore).
I think I'll give these changes a go tomorrow.
Another thing I've pretty-much concluded while looking through this code is that it looks like it probably has nothing to do with the issue that's blocking the Back and Forward buttons from working after all. So I'll also need to make a separate task to track down the real source of that problem.
Right now I have a stack of tasks: SessionStore; Back/Forward failures; DuckDuckGo rendering. I mustn't lose site of the fact that the real goal right now is to get DuckDuckGo rendering correctly. The other tasks are secondary, albeit with DuckDuckGo rendering potentially dependent on them.
That's it for today. More tomorrow and Thursday, but then a bit of a break.
If you'd like to read any of my other gecko diary entries, they're all available on my Gecko-dev Diary page.
Comment
This seems to be my mind's (or maybe my body's?) way of telling me that I need to get my priorities straight. That there's something that I need to get done, resolved or somehow dealt with, and I need to do it urgently or I'll continue to have sleepless nights until I do.
The reason for this particular panic was my FOSDEM preparations, combined with a build up of projects at work that are coming to a head. For FOSDEM I have two talks to prepare (one about this blog, the other related to my work), the Linux on Mobile stand to help organise, the Sailfish community dinner on the Saturday to help organise, support for the HPC, Big Data & Data Science devroom on the Saturday, and also with the Python devroom on the Sunday. It's going to be a crazy busy event. But it's actually the run-up to it and the fact I've to still write my presentations, that's losing me sleep.
It's all fine: it's under control. But in order to prevent it spiralling out of control, I'm going to be taking a break from gecko development for a couple of weeks until things have calmed down. This will slow down development, which of course saddens me because more than anything else I just want ESR 91 to end up in a good, releasable, state. But as others wiser than I am have already cautioned, this also means keeping a positive and healthy state of mind.
I'll finish my last post on Day 149 (that's this Thursday). I'll start back up again on Thursday the 8th February, assuming all goes to plan!
But for the next couple of days there's still development to be done, so let's get straight back to it.
Today I'm still attempting to fix the NS_ERROR_FILE_NOT_FOUND error coming from SessionStore.jsm which I believe may be causing the Back and Forwards buttons in the browser to fail. It's become clear that the SessionStore.jsm file itself is missing (along with a bunch of other files listed in gecko-dev/browser/components/sessionstore/moz.build) but what's not clear is whether the problem is that the files should be there, or that the calls to the methods in this file shouldn't be there.
Overnight while lying in bed I came up with some kind of plan to help move things forwards. The call to the failing method is happening in updateSessionStoreForWindow() and this is only called by the exported method UpdateSessionStoreForWindow(). As far as I can tell this isn't executed by any JavaScript code, but because it has an IPDL interface it's possible for it to be called by C++ code as well.
And sure enough, it's being called twice in WindowGlobalParent.cpp. Once at the end of the WriteFormDataAndScrollToSessionStore() method on line 1260, like this:
nsresult WindowGlobalParent::WriteFormDataAndScrollToSessionStore(
const Maybe<FormData>& aFormData, const Maybe<nsPoint>& aScrollPosition,
uint32_t aEpoch) {
[...]
return funcs->UpdateSessionStoreForWindow(GetRootOwnerElement(), context, key,
aEpoch, update);
}
And another time at the end of the ResetSessionStore() method on line 1310, like this:
nsresult WindowGlobalParent::ResetSessionStore(uint32_t aEpoch) {
[...]
return funcs->UpdateSessionStoreForWindow(GetRootOwnerElement(), context, key,
aEpoch, update);
}
I've placed a breakpoint on these two locations to find out whether these are actually where it's being fired from. If you're being super-observant you'll notice I've not actually placed the breakpoints where I actually want them; I've had to place them earlier in the code (but crucially, still within the same methods). That's because it's not always possible to place breakpoints on the exact line you want.The debugger will place it on the first line it can after the point you request. Because both of the cases I'm interested in are right at the end of the methods they're called in, when I attempt to put a breakpoint on the exact line the debugger places it instead in the next method along in the source code. That isn't much use for what I needed.
Hence I've placed them a little earlier in the code instead: on the first lines where they actually stick.
bash-5.0$ EMBED_CONSOLE=1 MOZ_LOG="EmbedLite:5" gdb sailfish-browser
(gdb) b WindowGlobalParent.cpp:1260
Breakpoint 5 at 0x7fbbc8e31c: file dom/ipc/WindowGlobalParent.cpp, line 1260.
(gdb) b WindowGlobalParent.cpp:1294
Breakpoint 9 at 0x7fbbc8e688: file dom/ipc/WindowGlobalParent.cpp, line 1294.
(gdb) r
[...]
JavaScript error: resource:///modules/sessionstore/SessionStore.jsm, line 541:
NS_ERROR_FILE_NOT_FOUND:
CONSOLE message:
[JavaScript Error: "NS_ERROR_FILE_NOT_FOUND: " {file:
"resource:///modules/sessionstore/SessionStore.jsm" line: 541}]
@resource:///modules/sessionstore/SessionStore.jsm:541:3
SSF_updateSessionStoreForWindow@resource://gre/modules/
SessionStoreFunctions.jsm:120:5
UpdateSessionStoreForStorage@resource://gre/modules/
SessionStoreFunctions.jsm:54:35
Thread 10 "GeckoWorkerThre" hit Breakpoint 5, mozilla::dom::WindowGlobalParent::
WriteFormDataAndScrollToSessionStore (this=this@entry=0x7f81164520,
aFormData=..., aScrollPosition=..., aEpoch=0)
at dom/ipc/WindowGlobalParent.cpp:1260
1260 windowState.mHasChildren.Construct() = !context->Children().IsEmpty();
(gdb) n
709 ${PROJECT}/obj-build-mer-qt-xr/dist/include/mozilla/Span.h:
No such file or directory.
(gdb)
1260 windowState.mHasChildren.Construct() = !context->Children().IsEmpty();
(gdb)
1262 JS::RootedValue update(jsapi.cx());
(gdb)
1263 if (!ToJSValue(jsapi.cx(), windowState, &update)) {
(gdb)
1267 JS::RootedValue key(jsapi.cx(), context->Top()->PermanentKey());
(gdb)
1269 return funcs->UpdateSessionStoreForWindow(GetRootOwnerElement(),
context, key,
(gdb) n
1297 ${PROJECT}/obj-build-mer-qt-xr/dist/include/js/RootingAPI.h:
No such file or directory.
(gdb)
JavaScript error: resource:///modules/sessionstore/SessionStore.jsm, line 541:
NS_ERROR_FILE_NOT_FOUND:
1267 JS::RootedValue key(jsapi.cx(), context->Top()->PermanentKey());
(gdb) c
Continuing.
It's clear from the above that the WriteFormDataAndScrollToSessionStore() method is being called and is then going on to call the missing JavaScript method. We can even see the error coming from the JavaScript as we step out of the calling method.You'll notice from the output that there's another — earlier — NS_ERROR_FILE_NOT_FOUND error before the breakpoint hits. This is coming from a different spot: line 120 of SessionStoreFunctions.jsm rather than the line 105 we were looking at here.
This new error is called from line 54 of the same file (we can see from from the backtrace in the log output) which is in the UpdateSessionStoreForStorage() method in the file. So where is this being called from?
$ grep -rIn "UpdateSessionStoreForStorage" * --include="*.js" \
--include="*.jsm" --include="*.cpp" --exclude-dir="obj-build-mer-qt-xr"
gecko-dev/docshell/base/CanonicalBrowsingContext.cpp:2233:
return funcs->UpdateSessionStoreForStorage(Top()->GetEmbedderElement(), this,
gecko-dev/docshell/base/CanonicalBrowsingContext.cpp:2255:
void CanonicalBrowsingContext::UpdateSessionStoreForStorage(
gecko-dev/dom/storage/SessionStorageManager.cpp:854:
CanonicalBrowsingContext::UpdateSessionStoreForStorage(
gecko-dev/toolkit/components/sessionstore/SessionStoreFunctions.jsm:47:
function UpdateSessionStoreForStorage(
gecko-dev/toolkit/components/sessionstore/SessionStoreFunctions.jsm:66:
"UpdateSessionStoreForStorage",
From this we can see it's being called in a few places, all of them from C++ code. Again, that means we can explore them with gdb using breakpoints. Let's give this a go as well.
(gdb) break CanonicalBrowsingContext.cpp:2213
Breakpoint 7 at 0x7fbc7c6abc: file docshell/base/CanonicalBrowsingContext.cpp,
line 2213.
(gdb) r
[...]
Thread 10 "GeckoWorkerThre" hit Breakpoint 7, mozilla::dom::
CanonicalBrowsingContext::WriteSessionStorageToSessionStore
(this=0x7f80b6dee0, aSesssionStorage=..., aEpoch=0)
at docshell/base/CanonicalBrowsingContext.cpp:2213
2213 AutoJSAPI jsapi;
(gdb) bt
#0 mozilla::dom::CanonicalBrowsingContext::WriteSessionStorageToSessionStore
(this=0x7f80b6dee0, aSesssionStorage=..., aEpoch=0)
at docshell/base/CanonicalBrowsingContext.cpp:2213
#1 0x0000007fbc7c6f54 in mozilla::dom::CanonicalBrowsingContext::
<lambda(const mozilla::MozPromise<nsTArray<mozilla::dom::SSCacheCopy>,
mozilla::ipc::ResponseRejectReason, true>::ResolveOrRejectValue&)>::
operator() (valueList=..., __closure=0x7f80bd70c8)
at ${PROJECT}/obj-build-mer-qt-xr/dist/include/mozilla/Variant.h:768
#2 mozilla::MozPromise<nsTArray<mozilla::dom::SSCacheCopy>, mozilla::ipc::
ResponseRejectReason, true>::InvokeMethod<mozilla::dom::
CanonicalBrowsingContext::UpdateSessionStoreSessionStorage(const
std::function<void()>&)::<lambda(const mozilla::MozPromise<nsTArray
<mozilla::dom::SSCacheCopy>, mozilla::ipc::ResponseRejectReason, true>::
ResolveOrRejectValue&)>, void (mozilla::dom::CanonicalBrowsingContext::
UpdateSessionStoreSessionStorage(const std::function<void()>&)::
<lambda(const mozilla::MozPromise<nsTArray<mozilla::dom::SSCacheCopy>,
mozilla::ipc::ResponseRejectReason, true>::ResolveOrRejectValue&)>::*)
(const mozilla::MozPromise<nsTArray<mozilla::dom::SSCacheCopy>,
mozilla::ipc::ResponseRejectReason, true>::ResolveOrRejectValue&) const,
mozilla::MozPromise<nsTArray<mozilla::dom::SSCacheCopy>, mozilla::ipc::
ResponseRejectReason, true>::ResolveOrRejectValue>
(aValue=..., aMethod=<optimized out>,
[...]
#25 0x0000007fb78b289c in ?? () from /lib64/libc.so.6
(gdb) n
[LWP 8594 exited]
2214 if (!jsapi.Init(wrapped->GetJSObjectGlobal())) {
(gdb)
2218 JS::RootedValue key(jsapi.cx(), Top()->PermanentKey());
(gdb)
2220 Record<nsCString, Record<nsString, nsString>> storage;
(gdb)
2221 JS::RootedValue update(jsapi.cx());
(gdb)
2223 if (!aSesssionStorage.IsEmpty()) {
(gdb)
2230 update.setNull();
(gdb)
2233 return funcs->UpdateSessionStoreForStorage(Top()->
GetEmbedderElement(), this,
(gdb)
1297 ${PROJECT}/obj-build-mer-qt-xr/dist/include/js/RootingAPI.h:
No such file or directory.
(gdb)
JavaScript error: resource:///modules/sessionstore/SessionStore.jsm, line 541:
NS_ERROR_FILE_NOT_FOUND:
2221 JS::RootedValue update(jsapi.cx());
(gdb)
2220 Record<nsCString, Record<nsString, nsString>> storage;
(gdb)
This new breakpoint is hit and once again, stepping through the code shows the problem method being called and also triggering the JavaScript error we're concerned about.This is all good stuff. Looking through the ESR 78 code there doesn't appear to be anything equivalent in CanonicalBrowsingContext.cpp. But now that I know this is where the problem is happening, I can at least find the commit that introduced the changes and use that to find out more. Here's the output from git blame, but please forgive the terrible formatting: it's very hard to line-wrap this output cleanly.
$ git blame docshell/base/CanonicalBrowsingContext.cpp \
-L :WriteSessionStorageToSessionStore
dd51467 (Andreas Farre 2021-05-26 2204) nsresult CanonicalBrowsingContext::
WriteSessionStorageToSessionStore(
dd51467 (Andreas Farre 2021-05-26 2205) const nsTArray<SSCacheCopy>&
aSesssionStorage, uint32_t aEpoch) {
dd51467 (Andreas Farre 2021-05-26 2206) nsCOMPtr<nsISessionStoreFunctions> funcs =
dd51467 (Andreas Farre 2021-05-26 2207) do_ImportModule("resource://gre/
modules/SessionStoreFunctions.jsm");
dd51467 (Andreas Farre 2021-05-26 2208) if (!funcs) {
dd51467 (Andreas Farre 2021-05-26 2209) return NS_ERROR_FAILURE;
dd51467 (Andreas Farre 2021-05-26 2210) }
dd51467 (Andreas Farre 2021-05-26 2211)
dd51467 (Andreas Farre 2021-05-26 2212) nsCOMPtr<nsIXPConnectWrappedJS>
wrapped = do_QueryInterface(funcs);
dd51467 (Andreas Farre 2021-05-26 2213) AutoJSAPI jsapi;
dd51467 (Andreas Farre 2021-05-26 2214) if (!jsapi.Init(wrapped->
GetJSObjectGlobal())) {
dd51467 (Andreas Farre 2021-05-26 2215) return NS_ERROR_FAILURE;
dd51467 (Andreas Farre 2021-05-26 2216) }
dd51467 (Andreas Farre 2021-05-26 2217)
2b70b9d (Kashav Madan 2021-06-26 2218) JS::RootedValue key(jsapi.cx(),
Top()->PermanentKey());
2b70b9d (Kashav Madan 2021-06-26 2219)
dd51467 (Andreas Farre 2021-05-26 2220) Record<nsCString, Record<nsString,
nsString>> storage;
dd51467 (Andreas Farre 2021-05-26 2221) JS::RootedValue update(jsapi.cx());
dd51467 (Andreas Farre 2021-05-26 2222)
dd51467 (Andreas Farre 2021-05-26 2223) if (!aSesssionStorage.IsEmpty()) {
dd51467 (Andreas Farre 2021-05-26 2224) SessionStoreUtils::
ConstructSessionStorageValues(this,
aSesssionStorage,
dd51467 (Andreas Farre 2021-05-26 2225) storage);
dd51467 (Andreas Farre 2021-05-26 2226) if (!ToJSValue(jsapi.cx(), storage,
&update)) {
dd51467 (Andreas Farre 2021-05-26 2227) return NS_ERROR_FAILURE;
dd51467 (Andreas Farre 2021-05-26 2228) }
dd51467 (Andreas Farre 2021-05-26 2229) } else {
dd51467 (Andreas Farre 2021-05-26 2230) update.setNull();
dd51467 (Andreas Farre 2021-05-26 2231) }
dd51467 (Andreas Farre 2021-05-26 2232)
2b70b9d (Kashav Madan 2021-06-26 2233) return funcs->
UpdateSessionStoreForStorage(
Top()->GetEmbedderElement(), this,
2b70b9d (Kashav Madan 2021-06-26 2234) key, aEpoch, update);
dd51467 (Andreas Farre 2021-05-26 2235) }
dd51467 (Andreas Farre 2021-05-26 2236)
If you can get past the terrible formatting you should be able to see there are two commits of interest here. The first is dd51467c228cb from Andreas Farre and the second which was layered on top is 2b70b9d821c8e from Kashav Madan. Let's find out more about them both.
$ git log -1 dd51467c228cb
commit dd51467c228cb5c9ec9d9efbb6e0339037ec7fd5
Author: Andreas Farre <farre@mozilla.com>
Date: Wed May 26 07:14:06 2021 +0000
Part 7: Bug 1700623 - Make session storage session store work with Fission.
r=nika
Use the newly added session storage data getter to access the session
storage in the parent and store it in session store without a round
trip to content processes.
Depends on D111433
Differential Revision: https://phabricator.services.mozilla.com/D111434
For some reason the Phabricator link doesn't work for me, but we can still see the revision directly in the repository.$ git log -1 2b70b9d821c8e commit 2b70b9d821c8eaf0ecae987cfc57e354f0f9cc20 Author: Kashav Madan <kshvmdn@gmail.com> Date: Sat Jun 26 20:25:29 2021 +0000 Bug 1703692 - Store the latest embedder's permanent key on CanonicalBrowsingContext, r=nika,mccr8 And include it in Session Store flushes to avoid dropping updates in case the browser is unavailable. Differential Revision: https://phabricator.services.mozilla.com/D118385 There aren't many clues in these changes, in particular there's no hint of how the build system was changed to have these files included. However, digging around in this code has given me a better understanding of the structure and purpose of the different directories.
It seems to me that, in essence, the gecko-dev/browser/components/ directory where the missing files can be found contains modules that relate to the browser chrome and Firefox user interface, rather than the rendering engine. Typically this kind of content would be replicated on Sailfish OS by adding amended versions into the embedlite-components project. If it's browser-specific material, that would make sense.
As an example, in Firefox we can find AboutRedirector.h and AboutRedirector.cpp files , whereas on Sailfish OS there's a replacement AboutRedirectory.js file in embedlite-components. Similarly Firefox has a DownloadsManager.jsm file that can be found in gecko-dev/browser/components/newtab/lib/. This seems to be replaced by EmbedliteDownloadManager.js in embedlite-components. Both have similar functionality based on the names of the methods contained in them, but the implementations are quite different.
Assuming this is correct, probably the right way to tackle the missing SessionStore.jsm and related files would be to move copies into embedlite-components. They'll need potentially quite big changes to align them with sailfish-browser, although hopefully this will largely be removing functionality that has already been implemented elsewhere (for example cookie save and restore).
I think I'll give these changes a go tomorrow.
Another thing I've pretty-much concluded while looking through this code is that it looks like it probably has nothing to do with the issue that's blocking the Back and Forward buttons from working after all. So I'll also need to make a separate task to track down the real source of that problem.
Right now I have a stack of tasks: SessionStore; Back/Forward failures; DuckDuckGo rendering. I mustn't lose site of the fact that the real goal right now is to get DuckDuckGo rendering correctly. The other tasks are secondary, albeit with DuckDuckGo rendering potentially dependent on them.
That's it for today. More tomorrow and Thursday, but then a bit of a break.
If you'd like to read any of my other gecko diary entries, they're all available on my Gecko-dev Diary page.
22 Jan 2024 : Day 146 #
I'm still in the process of fixing the Sec-Fetch-* headers. The data I collected yesterday resulted in a few conclusions:
I do note however also notice that DuckDuckGo doesn't load correctly for these cases, so presumably there's still a problem with the headers here. I'll have to come back to that.
The inability to use the Back or Forwards buttons is also beginning to cause me trouble in day-to-day use, so now might be the time to fix that as well. Once I have I can test the remaining cases.
My suspicion is that the reason they don't work is related to this error that appears periodically when using the browser:
A different possibility is that this, at the top of the SessionStoreFunctions.jsm file, is causing the problem:
A quick search inside the omni archive suggests this file is indeed missing:
But it's late now, so I'm going to have to figure that out tomorrow.
If you'd like to read any of my other gecko diary entries, they're all available on my Gecko-dev Diary page.
Comment
- Opening a URL at the command line with a tab that was already open gives odd results.
- Opening a URL as a homepage gives odd results.
- The Back and Forwards buttons are broken so couldn't be tested.
- I didn't get time to test the JavaScript case.
- Open a URL using JavaScript simulating an HREF selection.
- Open a URL using a JavaScript redirect.
<!DOCTYPE html>
<html>
<head>
<meta http-equiv="content-type" content="text/html; charset=UTF-8">
<meta name="viewport" content="width=device-width, user-scalable=no"/>
<script type="text/javascript">
function reloadHref(url) {
setTimeout(() => window.location.href = url, 2000);
}
function reloadRedirect(url) {
setTimeout(() => window.location.replace(url), 2000);
}
</script>
</head>
<body>
<p><a href="javascript:reloadHref('https://duckduckgo.com');">
Simulate an HREF selection
</a></p>
<p><a href="javascript:reloadRedirect('https://duckduckgo.com');">
Simulate a redirect
</a></p>
</body>
</html>
Pretty straightforward stuff, but should do the trick. This allows me to test the effects of the URL being changed and record the results. In fact, let's get straight to the results. Here's what I found out by testing using this page:| Situation | Expected | Flag set |
|---|---|---|
| Open a URL using JavaScript simulating a HREF selection. | 0 | 0 |
| Open a URL using a JavaScript redirect. | 0 | 0 |
I do note however also notice that DuckDuckGo doesn't load correctly for these cases, so presumably there's still a problem with the headers here. I'll have to come back to that.
The inability to use the Back or Forwards buttons is also beginning to cause me trouble in day-to-day use, so now might be the time to fix that as well. Once I have I can test the remaining cases.
My suspicion is that the reason they don't work is related to this error that appears periodically when using the browser:
JavaScript error: resource://gre/modules/SessionStoreFunctions.jsm, line 105: NS_ERROR_FILE_NOT_FOUND:Here's the code in the file that's generating this error:
SessionStore.updateSessionStoreFromTablistener(
aBrowser,
aBrowsingContext,
aPermanentKey,
{ data: { windowstatechange: aData }, epoch: aEpoch }
);
It could be an error happening inside SessionStore.updateSessionStoreFromTablistener() but two reasons make me think this is unlikely. First the error message clearly targets the calling location and if the error were inside this method I'd expect the error message to reflect that instead. Second there isn't anything obvious in the updateSessionStoreFromTablistener() body that might be causing an error like this. No obvious file accesses or anything like that.A different possibility is that this, at the top of the SessionStoreFunctions.jsm file, is causing the problem:
XPCOMUtils.defineLazyModuleGetters(this, {
SessionStore: "resource:///modules/sessionstore/SessionStore.jsm",
});
This is a lazy getter, meaning that an attempt will be made to load the resource only at the point where a method from the module is used. Could it be that the SessionStore.jsm file is inaccessible? Then when a method from it is called the JavaScript interpreter tries to load the code in and fails, triggering the error.A quick search inside the omni archive suggests this file is indeed missing:
$ find . -iname "SessionStore.jsm" $ find . -iname "SessionStoreFunctions.jsm" ./omni/modules/SessionStoreFunctions.jsm $ find . -iname "Services.jsm" ./omni/modules/Services.jsmAs we can see, in contrast the SessionStoreFunctions.jsm and Services.jsm files are both present and correct. Well, present at least. To test out the theory that this is the problem I've parachuted the file into omni. First from my laptop:
$ scp gecko-dev/browser/components/sessionstore/SessionStore.jsm \
defaultuser@10.0.0.116:./omni/modules/sessionstore/
SessionStore.jsm 100% 209KB 1.3MB/s 00:00
[...]
And then on my phone:
$ ./omni.sh pack Omni action: pack Packing from: ./omni Packing to: /usr/lib64/xulrunner-qt5-91.9.1This hasn't fixed the Back and Forwards buttons, but it has resulted in a new error. The fact that this is error is now coming from inside SessionStore.jsm is encouraging.
JavaScript error: chrome://embedlite/content/embedhelper.js, line 259:
TypeError: sessionHistory is null
JavaScript error: resource:///modules/sessionstore/SessionStore.jsm, line 541:
NS_ERROR_FILE_NOT_FOUND:
Line 541 of SessionStore.jsm looks like this:
_globalState: new GlobalState(),This also looks lazy-getter-related, since the only other reference to GlobalState() in this file is at the top, in this chunk of lazy-getter code:
XPCOMUtils.defineLazyModuleGetters(this, {
AppConstants: "resource://gre/modules/AppConstants.jsm",
AsyncShutdown: "resource://gre/modules/AsyncShutdown.jsm",
BrowserWindowTracker: "resource:///modules/BrowserWindowTracker.jsm",
DevToolsShim: "chrome://devtools-startup/content/DevToolsShim.jsm",
E10SUtils: "resource://gre/modules/E10SUtils.jsm",
GlobalState: "resource:///modules/sessionstore/GlobalState.jsm",
HomePage: "resource:///modules/HomePage.jsm",
PrivacyFilter: "resource://gre/modules/sessionstore/PrivacyFilter.jsm",
PromiseUtils: "resource://gre/modules/PromiseUtils.jsm",
RunState: "resource:///modules/sessionstore/RunState.jsm",
SessionCookies: "resource:///modules/sessionstore/SessionCookies.jsm",
SessionFile: "resource:///modules/sessionstore/SessionFile.jsm",
SessionSaver: "resource:///modules/sessionstore/SessionSaver.jsm",
SessionStartup: "resource:///modules/sessionstore/SessionStartup.jsm",
TabAttributes: "resource:///modules/sessionstore/TabAttributes.jsm",
TabCrashHandler: "resource:///modules/ContentCrashHandlers.jsm",
TabState: "resource:///modules/sessionstore/TabState.jsm",
TabStateCache: "resource:///modules/sessionstore/TabStateCache.jsm",
TabStateFlusher: "resource:///modules/sessionstore/TabStateFlusher.jsm",
setTimeout: "resource://gre/modules/Timer.jsm",
});
Sure enough, when I check, the GlobalState.jsm file is missing. It looks like these missing files are ones referenced in gecko-dev/browser/components/sessionstore/moz.build:
EXTRA_JS_MODULES.sessionstore = [
"ContentRestore.jsm",
"ContentSessionStore.jsm",
"GlobalState.jsm",
"RecentlyClosedTabsAndWindowsMenuUtils.jsm",
"RunState.jsm",
"SessionCookies.jsm",
"SessionFile.jsm",
"SessionMigration.jsm",
"SessionSaver.jsm",
"SessionStartup.jsm",
"SessionStore.jsm",
"SessionWorker.js",
"SessionWorker.jsm",
"StartupPerformance.jsm",
"TabAttributes.jsm",
"TabState.jsm",
"TabStateCache.jsm",
"TabStateFlusher.jsm",
]
It's not at all clear to me why these files aren't being included. The problem must be arising because either they're not being included when they should be, or they're being accessed when they shouldn't be.But it's late now, so I'm going to have to figure that out tomorrow.
If you'd like to read any of my other gecko diary entries, they're all available on my Gecko-dev Diary page.
21 Jan 2024 : Day 145 #
Yesterday was a light day of gecko development (heavy on everything else but light on gecko). I managed to update the user agent overrides but not a lot else.
The one thing I did do was think about next steps, which brings us to today. To recap, the DuckDuckGo main page is now working. The search page inexplicably has no search results on it and so needs fixing. But the first thing I need to do is check whether the user interaction flags are propagating properly. My working assumption is that in the cases where they're needed they're being set. What I'm less certain about is whether they're not being set when they're not needed.
The purpose of the Sec-Fetch-* headers is to allow the browser to work in collaboration with the server. The user doesn't necessarily trust the page they're viewing and the server doesn't necessarily trust the browser. But the user should trust the browser. And the user should trust the browser to send the correct Sec-Fetch-* headers to the server. Assuming they're set correctly a trustworthy site can then act on them accordingly; for example, by only showing private data when the page isn't being displayed in an iframe, say.
Anyway, the point is, setting the value of these headers is a security feature. The implicit contract between user and browser requires that they're set correctly and the user trusts the browser will do this. The result of not doing so could make it easier for attackers to trick the user. So getting the flags set correctly is really important.
When it comes to understanding the header values and the flags that control them, the key gateway is EmbedLiteViewChild::RecvLoadURL(). The logic for deciding whether to set the flags happens before this is called and all of the logic that uses the flag happens after it. So I'll place a breakpoint on this method and check the value of the flag in various situations.
Which situations? Here are the ones I can think of where the flag should be set to true:
There are some notable entries in the table although broadly speaking the results are what I was hoping for. For example, when using D-Bus or xdg-open to open the same website that's already available, there is no effect. I hadn't expected this, but having now seen the behaviour in action, it makes perfect sense and looks correct. For the case of opening a URL via the command line with the same tab open, I'll need to look in to whether some other flag should be set instead; but on the face of it, this looks like something that may need fixing.
Similarly for opening a URL as the home page. I think the result is the reverse of what it should be, but I need to look into this more to check.
The forward and back button interactions are marked as "Unavailable". That's because the back and forward functionality are currently broken. I'm hoping that fixing Issue 1024 will also restore this functionality, after which I'll need to test this again.
Finally I didn't get time to test the JavaScript case. I'll have to do that tomorrow.
So a few things still to fix, but hopefully over the next couple of days these can all be ironed out.
If you'd like to read any of my other gecko diary entries, they're all available on my Gecko-dev Diary page.
Comment
The one thing I did do was think about next steps, which brings us to today. To recap, the DuckDuckGo main page is now working. The search page inexplicably has no search results on it and so needs fixing. But the first thing I need to do is check whether the user interaction flags are propagating properly. My working assumption is that in the cases where they're needed they're being set. What I'm less certain about is whether they're not being set when they're not needed.
The purpose of the Sec-Fetch-* headers is to allow the browser to work in collaboration with the server. The user doesn't necessarily trust the page they're viewing and the server doesn't necessarily trust the browser. But the user should trust the browser. And the user should trust the browser to send the correct Sec-Fetch-* headers to the server. Assuming they're set correctly a trustworthy site can then act on them accordingly; for example, by only showing private data when the page isn't being displayed in an iframe, say.
Anyway, the point is, setting the value of these headers is a security feature. The implicit contract between user and browser requires that they're set correctly and the user trusts the browser will do this. The result of not doing so could make it easier for attackers to trick the user. So getting the flags set correctly is really important.
When it comes to understanding the header values and the flags that control them, the key gateway is EmbedLiteViewChild::RecvLoadURL(). The logic for deciding whether to set the flags happens before this is called and all of the logic that uses the flag happens after it. So I'll place a breakpoint on this method and check the value of the flag in various situations.
Which situations? Here are the ones I can think of where the flag should be set to true:
- Open a URL at the command line with no existing tabs.
- Open a URL at the command line with existing tabs.
- Open a URL via D-Bus with no existing tabs.
- Open a URL via D-Bus with existing tabs.
- Open a URL using xdg-open with no existing tags.
- Open a URL using xdg-open with existing tags.
- Open a URL as the homepage.
- Enter a URL in the address bar.
- Open an item from the history.
- Open a bookmark.
- Select a link on a page.
- Open a URL using JavaScript.
- Open a page using the Back button.
- Open a page using the Forwards button.
- Reloading a page.
$ gdb sailfish-browser
(gdb) b EmbedLiteViewChild::RecvLoadURL
Function "EmbedLiteViewChild::RecvLoadURL" not defined.
Make breakpoint pending on future shared library load? (y or [n]) y
Breakpoint 1 (EmbedLiteViewChild::RecvLoadURL) pending.
(gdb) r https://duckduckgo.com
Thread 8 "GeckoWorkerThre" hit Breakpoint 1, mozilla::embedlite::
EmbedLiteViewChild::RecvLoadURL (this=0x7f88ad1c60, url=...,
aFromExternal=@0x7f9f3d3598: true) at mobile/sailfishos/embedshared/
EmbedLiteViewChild.cpp:482
482 {
(gdb) p aFromExternal
$2 = (const bool &) @0x7f9f3d3598: true
(gdb) n
483 LOGT("url:%s", NS_ConvertUTF16toUTF8(url).get());
(gdb) n
867 ${PROJECT}/obj-build-mer-qt-xr/dist/include/nsCOMPtr.h:
No such file or directory.
(gdb) n
487 if (Preferences::GetBool("keyword.enabled", true)) {
(gdb) n
493 if (aFromExternal) {
(gdb) n
497 LoadURIOptions loadURIOptions;
(gdb) n
498 loadURIOptions.mTriggeringPrincipal = nsContentUtils::GetSystemPrincipal();
(gdb) p /x flags
$3 = 0x341000
(gdb) p/x flags & nsIWebNavigation::LOAD_FLAGS_FIXUP_SCHEME_TYPOS
$6 = 0x200000
(gdb) p/x flags & nsIWebNavigation::LOAD_FLAGS_ALLOW_THIRD_PARTY_FIXUP
$7 = 0x100000
(gdb) p/x flags & nsIWebNavigation::LOAD_FLAGS_DISALLOW_INHERIT_PRINCIPAL
$8 = 0x40000
(gdb) p/x flags & nsIWebNavigation::LOAD_FLAGS_FROM_EXTERNAL
$9 = 0x1000
(gdb) p /x flags - (nsIWebNavigation::LOAD_FLAGS_ALLOW_THIRD_PARTY_FIXUP
| nsIWebNavigation::LOAD_FLAGS_FIXUP_SCHEME_TYPOS
| nsIWebNavigation::LOAD_FLAGS_DISALLOW_INHERIT_PRINCIPAL
| nsIWebNavigation::LOAD_FLAGS_FROM_EXTERNAL)
$10 = 0x0
(gdb)
In a couple of places (selecting links and reloading the page) the EmbedLiteViewChild::RecvLoadURL() method doesn't get called. For those cases I put a breakpoint on LoadInfo::GetLoadTriggeredFromExternal() instead. The process looks a little different:
(gdb) disable break
(gdb) break GetLoadTriggeredFromExternal
Breakpoint 2 at 0x7fb9d3430c: GetLoadTriggeredFromExternal. (2 locations)
(gdb) c
Continuing.
Thread 8 "GeckoWorkerThre" hit Breakpoint 2, mozilla::net::LoadInfo::
GetLoadTriggeredFromExternal (this=0x7f89170cf0,
aLoadTriggeredFromExternal=0x7f9f3d3150) at netwerk/base/LoadInfo.cpp:1478
1478 *aLoadTriggeredFromExternal = mLoadTriggeredFromExternal;
(gdb) p mLoadTriggeredFromExternal
$1 = false
(gdb)
I've been through and checked the majority of the cases separately. Here's a summary of the results once I apply these processes for all of the cases.| Situation | Expected | Flag set |
|---|---|---|
| Open a URL at the command line with no existing tabs. | 1 | 1 |
| Open a URL at the command line with the same tab open. | 1 | 0 |
| Open a URL at the command line with a different tab open. | 1 | 1 |
| Open a URL via D-Bus with no existing tabs. | 1 | 1 |
| Open a URL via D-Bus with the same tab open. | 1 | No effect |
| Open a URL via D-Bus with a different tab open. | 1 | 1 |
| Open a URL using xdg-open with no existing tags. | 1 | 1 |
| Open a URL using xdg-open with the same tab open. | 1 | No effect |
| Open a URL using xdg-open with a different tab open. | 1 | 1 |
| Open a URL as the homepage. | 0 | 1 |
| Enter a URL in the address bar. | 0 | 0 |
| Open an item from the history. | 0 | 0 |
| Open a bookmark. | 0 | 0 |
| Select a link on a page. | 0 | 0 |
| Open a URL using JavaScript. | 0 | Not tested |
| Open a page using the Back button. | 0 | Unavailable |
| Open a page using the Forwards button. | 0 | Unavailable |
| Reloading a page. | 0 | 0 |
There are some notable entries in the table although broadly speaking the results are what I was hoping for. For example, when using D-Bus or xdg-open to open the same website that's already available, there is no effect. I hadn't expected this, but having now seen the behaviour in action, it makes perfect sense and looks correct. For the case of opening a URL via the command line with the same tab open, I'll need to look in to whether some other flag should be set instead; but on the face of it, this looks like something that may need fixing.
Similarly for opening a URL as the home page. I think the result is the reverse of what it should be, but I need to look into this more to check.
The forward and back button interactions are marked as "Unavailable". That's because the back and forward functionality are currently broken. I'm hoping that fixing Issue 1024 will also restore this functionality, after which I'll need to test this again.
Finally I didn't get time to test the JavaScript case. I'll have to do that tomorrow.
So a few things still to fix, but hopefully over the next couple of days these can all be ironed out.
If you'd like to read any of my other gecko diary entries, they're all available on my Gecko-dev Diary page.
20 Jan 2024 : Day 144 #
It was gratifying to finally see the DuckDuckGo main search page appearing with an ESR 91 build of the browser. Even the search suggestions are working nicely. But there's trouble beneath the surface. Dig just a little further and it turns out the search results page shows no results. In terms of search engine utility, this is sub-optimal. I'll need to look in to this and fix it. But it's not the first task I need to tackle today. Although the front page at least looked like it was working yesterday, it relied on some changes that still need to be fully implemented and checked. The easy task is adding an override to the user agent string override list. What I found yesterday is that while an ESR 91 user agent string only works with the correct Sec-Fetch headers, it also has to be the mobile version of the user agent. This works:
If you'd like to read any of my other gecko diary entries, they're all available on my Gecko-dev Diary page.
Comment
Mozilla/5.0 (Mobile; rv:91.0) Gecko/91.0 Firefox/91.0This fails:
Mozilla/5.0 (X11; Linux aarch64; rv:91.0) Gecko/20100101 Firefox/91.0All of these things have to align. Updating the ua-update.json.in file in the sailfish-browser repository is straightforward. Just make the change, run the preprocess-ua-update-json batch file and copy the result into the correct folder.
$ git diff data/ua-update.json.in diff --git a/data/ua-update.json.in b/data/ua-update.json.in index 584720c0..338b8faf 100644 --- a/data/ua-update.json.in +++ b/data/ua-update.json.in @@ -116,0 +116,1 @@ + "duckduckgo.com": "Mozilla/5.0 (Mobile; rv:91.0) Gecko/91.0 Firefox/91.0" $ ./preprocess-ua-update-json [sailfishos-esr91 fbf5b15e] [user-agent] Update preprocessed user agent overrides 1 file changed, 2 insertions(+), 1 deletion(-) $ ls ua/ 38.8.0 45.9.1 52.9.1 60.0 60.9.1 78.0 91.0 $ cp ua-update.json ua/91.0/The second task is to check the code changes I made over the last couple of days. I added flags that pass certain user interaction signals on to the engine, such as whether an action was user-performed or not. Yesterday I checked using both gdb and by observing the resulting Sec-Fetch-* headers that the flags were making their way through the system correctly. However what I didn't check — and what I need to check still — is that the flags are correct when different paths are used to get there. For example, the system needs to distinguish between entering a URL in the toolbar and triggering a URL via D-Bus. The resulting request headers should be the same, but the logic for how we get to the same place is different. This is a debugging task. Unfortunately time has run away today already, so I'll have to pick up on the actual task of debugging tomorrow.
If you'd like to read any of my other gecko diary entries, they're all available on my Gecko-dev Diary page.
19 Jan 2024 : Day 143 #
Over the last couple of days now I've been building versions of gecko and its related packages that support the LOAD_FLAGS_FROM_EXTERNAL flag. According to comments in the code, when this flag is set the engine considers the request to be the result of user-interaction, so I'm hoping this change will help ensure the >Sec-Fetch headers are given the correct values.
But of course not all page loads are triggered externally. There are other flags to identify other types of user interaction which I'll need to fix as well. But one thing at a time. First of all I need to find out if the changes I've made to the code are having any effect.
The changes affect sixteen packages and comprise 771 MiB of data in all (including the debug packages), which I'm now copying over to my device so I can install and test them. Just doing this can take quite a while!
[...]
I've installed them and run them and they don't fix the problem. But as soon as I ran them I remembered that I've not yet hooked up things on the QML side to make them work. I still have a bit more coding to do before we'll see any good results.
[...]
I've updated the QML so that the flag is now passed in for the routes I could find that relate to page loads being triggered externally. There are some potential gotchas here: am I catching all of the situations in which this can happen? Are some of the paths used by other routes as well, such as entering a URL at the address bar? Once I've confirmed that these changes are having an effect I'll need to go back and check these other things as well.
First things first. Let's find out whether the flag is being applied in the case where a URL is passed on the command line.
So it's disappointing to discover that the page is still not rendering. Why is could this be?
I set the user agent to the ESR 91 value I used previously: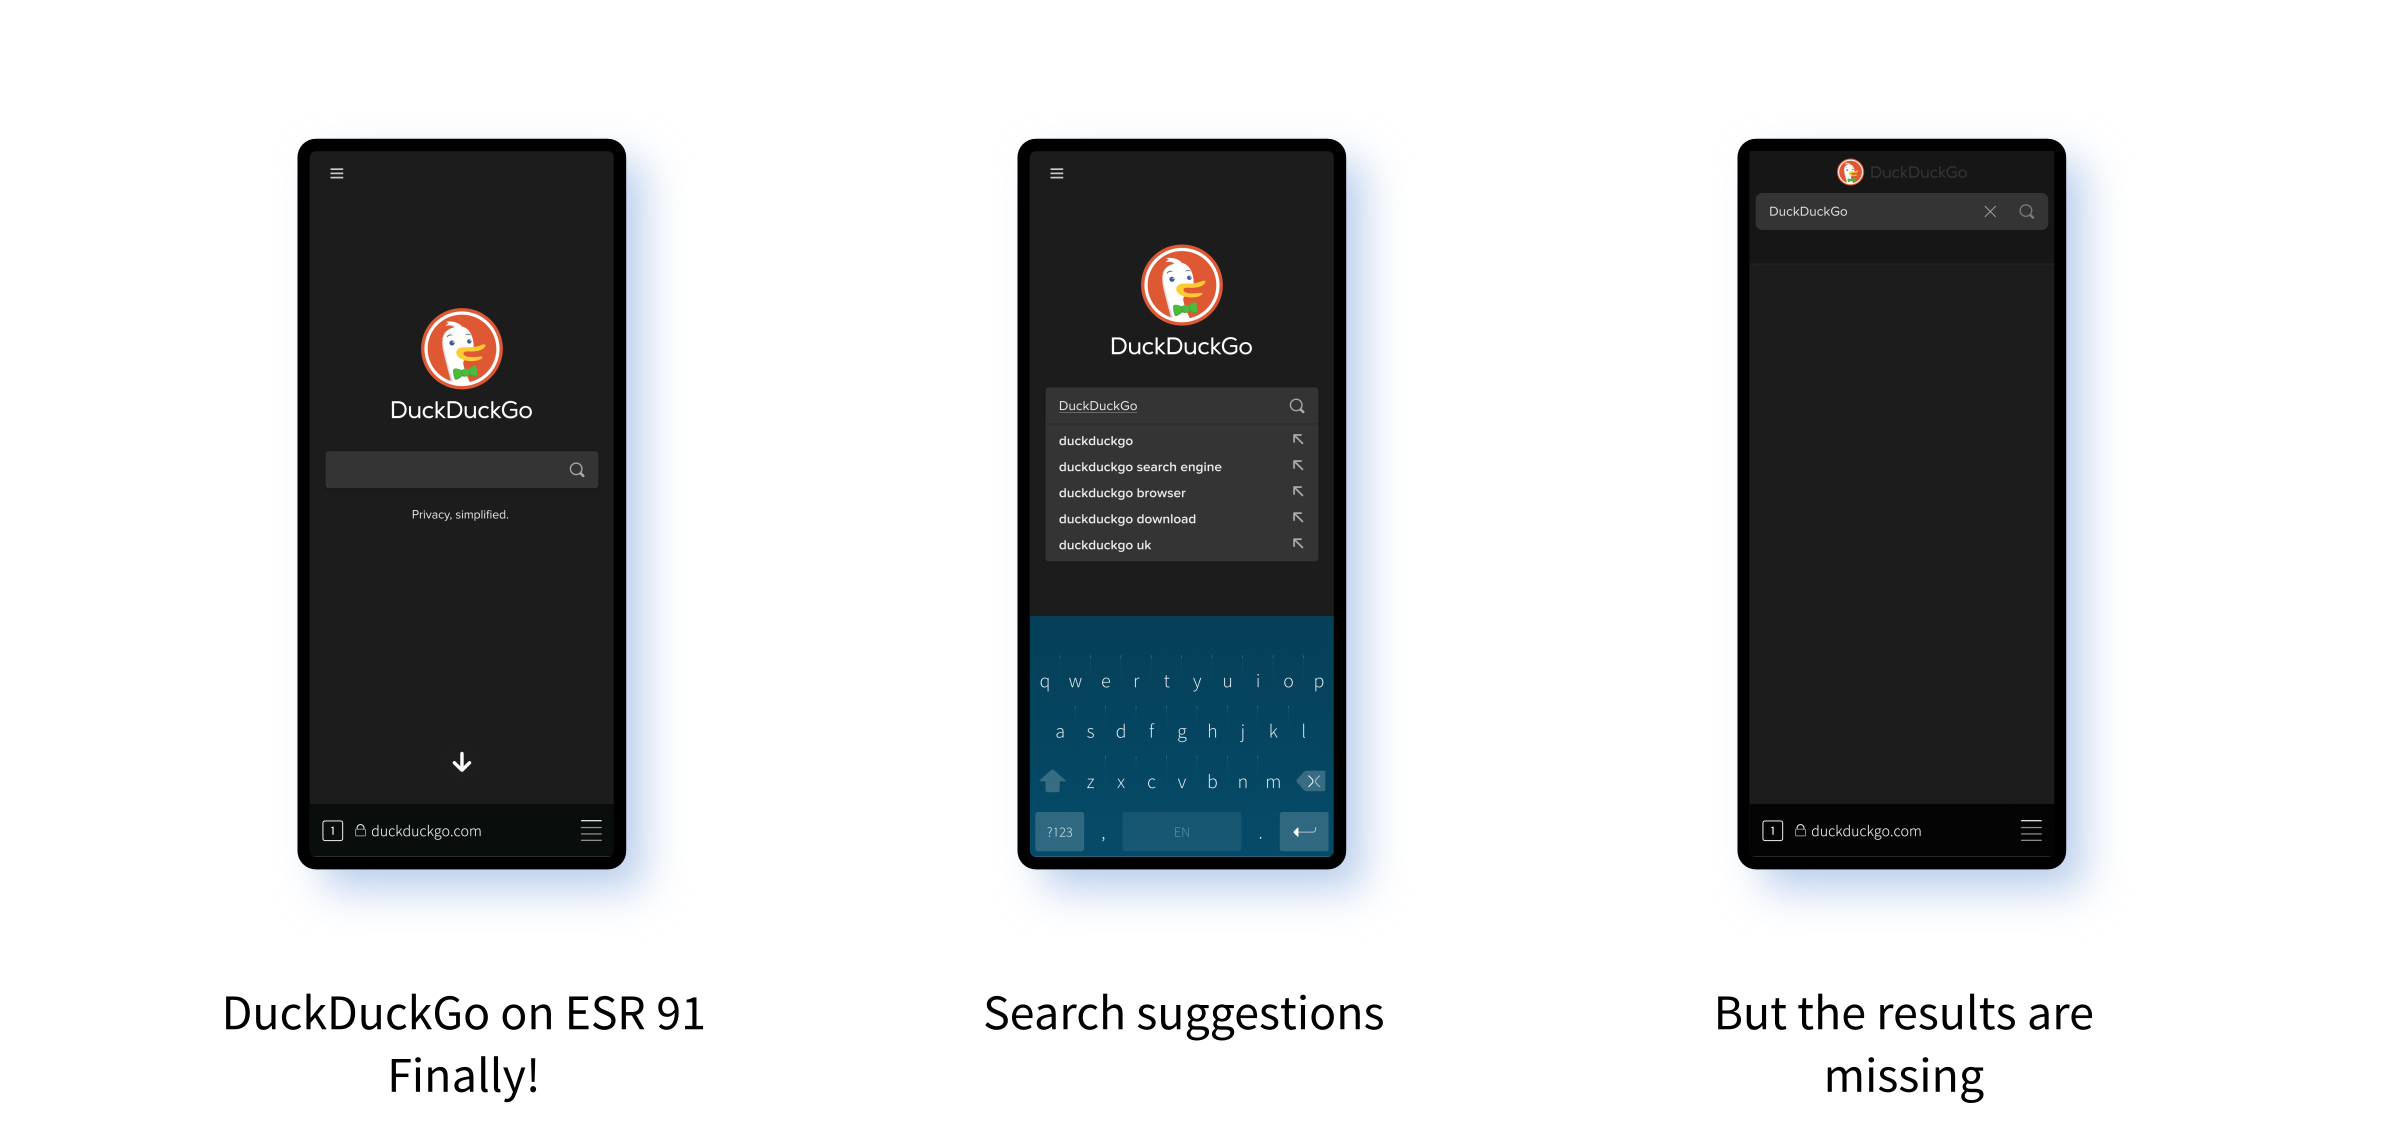
The last thing I see before I head to bed is the DuckDuckGo logo staring back at me from the screen. There is a glitch with search though. The search action works, in the sense that it takes me to the result page, but no results are shown. So there's still some more work to be done.
Nevertheless I'll sleep a lot easier tonight after this progress today.
If you'd like to read any of my other gecko diary entries, they're all available on my Gecko-dev Diary page.
Comment
But of course not all page loads are triggered externally. There are other flags to identify other types of user interaction which I'll need to fix as well. But one thing at a time. First of all I need to find out if the changes I've made to the code are having any effect.
The changes affect sixteen packages and comprise 771 MiB of data in all (including the debug packages), which I'm now copying over to my device so I can install and test them. Just doing this can take quite a while!
[...]
I've installed them and run them and they don't fix the problem. But as soon as I ran them I remembered that I've not yet hooked up things on the QML side to make them work. I still have a bit more coding to do before we'll see any good results.
[...]
I've updated the QML so that the flag is now passed in for the routes I could find that relate to page loads being triggered externally. There are some potential gotchas here: am I catching all of the situations in which this can happen? Are some of the paths used by other routes as well, such as entering a URL at the address bar? Once I've confirmed that these changes are having an effect I'll need to go back and check these other things as well.
First things first. Let's find out whether the flag is being applied in the case where a URL is passed on the command line.
$ gdb sailfish-browser
[...]
b DeclarativeTabModel::newTab
Breakpoint 1 at 0x6faf8: DeclarativeTabModel::newTab. (2 locations)
(gdb) r https://www.duckduckgo.com
[...]
Thread 1 "sailfish-browse" hit Breakpoint 1, DeclarativeTabModel::newTab
(this=0x55559d7b80, url=..., fromExternal=true)
at ../history/declarativetabmodel.cpp:196
196 return newTab(url, 0, 0, false, fromExternal);
(gdb) p fromExternal
$1 = true
(gdb) b EmbedLiteViewChild::RecvLoadURL
Breakpoint 2 at 0x7fbcb105f0: file mobile/sailfishos/embedshared/
EmbedLiteViewChild.cpp, line 482.
(gdb) n
Thread 8 "GeckoWorkerThre" hit Breakpoint 2, mozilla::embedlite::
EmbedLiteViewChild::RecvLoadURL (this=0x7f88690d50, url=...,
aFromExternal=@0x7f9f3d3598: true)
at mobile/sailfishos/embedshared/EmbedLiteViewChild.cpp:482
482 {
(gdb) n
483 LOGT("url:%s", NS_ConvertUTF16toUTF8(url).get());
(gdb) n
867 ${PROJECT}/gecko-dev/obj-build-mer-qt-xr/dist/include/nsCOMPtr.h: No such file or directory.
(gdb) n
487 if (Preferences::GetBool("keyword.enabled", true)) {
(gdb) n
493 if (aFromExternal) {
(gdb) n
497 LoadURIOptions loadURIOptions;
(gdb) p aFromExternal
$2 = (const bool &) @0x7f9f3d3598: true
(gdb) n
498 loadURIOptions.mTriggeringPrincipal = nsContentUtils::GetSystemPrincipal();
(gdb) n
499 loadURIOptions.mLoadFlags = flags;
(gdb) p /x flags
$4 = 0x341000
(gdb) p /x nsIWebNavigation::LOAD_FLAGS_FROM_EXTERNAL
$5 = 0x1000
(gdb) p /x (flags & nsIWebNavigation::LOAD_FLAGS_FROM_EXTERNAL)
$6 = 0x1000
Great! The flag is being set in the user-interface and is successfully passing through from sailfish-browser to qtmozembed and on to the EmbedLite wrapper for gecko itself. Let's see if it makes it all the way to the request header methods.
(gdb) b SecFetch::AddSecFetchUser
Breakpoint 3 at 0x7fbba7b680: file dom/security/SecFetch.cpp, line 333.
(gdb) b GetLoadTriggeredFromExternal
Breakpoint 4 at 0x7fb9d3430c: GetLoadTriggeredFromExternal. (5 locations)
(gdb) c
Continuing.
[New LWP 8921]
Thread 8 "GeckoWorkerThre" hit Breakpoint 4, nsILoadInfo::
GetLoadTriggeredFromExternal (this=0x7f88eabce0)
at ${PROJECT}/obj-build-mer-qt-xr/dist/include/nsILoadInfo.h:664
664 ${PROJECT}/obj-build-mer-qt-xr/dist/include/nsILoadInfo.h: No such file or directory.
(gdb) n
Thread 8 "GeckoWorkerThre" hit Breakpoint 4, mozilla::net::LoadInfo::
GetLoadTriggeredFromExternal (this=0x7f88eabce0,
aLoadTriggeredFromExternal=0x7f9f3d3150) at netwerk/base/LoadInfo.cpp:1478
1478 *aLoadTriggeredFromExternal = mLoadTriggeredFromExternal;
(gdb) p mLoadTriggeredFromExternal
$9 = true
(gdb) c
[...]
mozilla::dom::SecFetch::AddSecFetchUser
(aHTTPChannel=aHTTPChannel@entry=0x7f88eabed0)
at ${PROJECT}/obj-build-mer-qt-xr/dist/include/mozilla/DebugOnly.h:97
97 ${PROJECT}/obj-build-mer-qt-xr/dist/include/mozilla/DebugOnly.h:
No such file or directory.
(gdb)
350 nsAutoCString user("?1");
(gdb)
The Sec-Fetch-User flag is now being set correctly. Hooray! It's clear from this that the LOAD_FLAGS_FROM_EXTERNAL flag is making it through all the way to the place where the flag values are set. So let's check what the actual values are using the debug output on the console:
[ Request details ------------------------------------------- ]
Request: GET status: 200 OK
URL: https://duckduckgo.com/
[ Request headers --------------------------------------- ]
Host : duckduckgo.com
User-Agent : Mozilla/5.0 (X11; Linux aarch64; rv:91.0) Gecko/20100101 Firefox/91.0
Accept : text/html,application/xhtml+xml,application/xml;q=0.9,image/webp,*/*;q=0.8
Accept-Language : en-GB,en;q=0.5
Accept-Encoding : gzip, deflate, br
Connection : keep-alive
Upgrade-Insecure-Requests : 1
Sec-Fetch-Dest : document
Sec-Fetch-Mode : navigate
Sec-Fetch-Site : none
Sec-Fetch-User : ?1
If-None-Match : "65a81e81-4858"
That looks like just the set of Sec-Fetch flags we wanted.So it's disappointing to discover that the page is still not rendering. Why is could this be?
I set the user agent to the ESR 91 value I used previously:
"duckduckgo.com": "Mozilla/5.0 (Mobile; rv:91.0) Gecko/91.0 Firefox/91.0"Close the browser; clear out the cache; try again:
$ rm -rf ~/.local/share/org.sailfishos/browser/.mozilla/cache2/ \
~/.local/share/org.sailfishos/browser/.mozilla/startupCache/ \
~/.local/share/org.sailfishos/browser/.mozilla/cookies.sqlite
$ sailfish-browser https://duckduckgo.com/
The last thing I see before I head to bed is the DuckDuckGo logo staring back at me from the screen. There is a glitch with search though. The search action works, in the sense that it takes me to the result page, but no results are shown. So there's still some more work to be done.
Nevertheless I'll sleep a lot easier tonight after this progress today.
If you'd like to read any of my other gecko diary entries, they're all available on my Gecko-dev Diary page.
18 Jan 2024 : Day 142 #
Astonishingly I wake up to find the build I started last night has successfully completed this morning. That's not quite the end of the process though. It means I have a version of gecko implementing a new API. But the API is due to be accessed by qtmozembed. When I rebuild qtmozembed it installs the new gecko packages (which are named "xulrunner-qt5" for historical reasons) and then fails because it can't be built against the new interfaces.
The process of fixing this is pretty mechanical: I just have to go through and add the extra fromExternal parameter where it's missing so that it can be passed on directly to EmbedLiteView::LoadURL(). There is one small nuance, which is that on some occasions when the view hasn't been initialised yet, the URL to be loaded is cached until the view is ready. In this case I have to cache the fromExternal state as well, which I'm going to store in QMozViewPrivate::mPendingFromExternal: in the same class as where the URL is cached.
Having made these changes the package now builds successfully. But we're not quite there yet, because these changes are going to cause the exported qtmozembed interfaces to change. These will be picked up by the code in sailfish-browser.
Unlike qtmozembed the changes may not cause sailfish-browser to fail at build time, because it's possible the changes will only affect interpreted QML code rather than compiled C++ code. Let's see...
As I think I've mentioned before, sailfish-browser takes quite a while to build (we're talking tens of minutes rather than hours, but still enough time to make a coffee before it completes).
Once again the changes look pretty simple; for example here I'm adding the fromExternal parameter:
But that's still not quite enough. As we noted earlier this just tackles the compiled code. We can say that the C++ code is probably now in a pretty decent state, but the QML code is a different matter. The build process won't check the QML for inconsistencies and if there are any, it'll just fail at runtime. So we'll need to look through that next. That will have to be a task for tomorrow.
If you'd like to read any of my other gecko diary entries, they're all available on my Gecko-dev Diary page.
Comment
$ sfdk -c no-fix-version build -d -p
[...]
Loading repository data...
Reading installed packages...
Computing distribution upgrade...
Force resolution: No
The following 5 packages are going to be reinstalled:
xulrunner-qt5 91.9.1-1
xulrunner-qt5-debuginfo 91.9.1-1
xulrunner-qt5-debugsource 91.9.1-1
xulrunner-qt5-devel 91.9.1-1
xulrunner-qt5-misc 91.9.1-1
5 packages to reinstall.
[...]
qmozview_p.cpp: In member function ‘void QMozViewPrivate::load(const QString&)’:
qmozview_p.cpp:491:39: error: no matching function for call to
‘mozilla::embedlite::EmbedLiteView::LoadURL(char*)’
mView->LoadURL(url.toUtf8().data());
^
In file included from qmozview_p.h:26,
from qmozview_p.cpp:35:
usr/include/xulrunner-qt5-91.9.1/mozilla/embedlite/EmbedLiteView.h:82:16:
note: candidate: ‘virtual void mozilla::embedlite::EmbedLiteView::LoadURL
(const char*, bool)’
virtual void LoadURL(const char* aUrl, bool aFromExternal);
^~~~~~~
usr/include/xulrunner-qt5-91.9.1/mozilla/embedlite/EmbedLiteView.h:82:16:
note: candidate expects 2 arguments, 1 provided
This is entirely expected. In fact it's a good sign: it means that things are aligning as intended. The next step will be to update qtmozembed so that it matches the new interface.The process of fixing this is pretty mechanical: I just have to go through and add the extra fromExternal parameter where it's missing so that it can be passed on directly to EmbedLiteView::LoadURL(). There is one small nuance, which is that on some occasions when the view hasn't been initialised yet, the URL to be loaded is cached until the view is ready. In this case I have to cache the fromExternal state as well, which I'm going to store in QMozViewPrivate::mPendingFromExternal: in the same class as where the URL is cached.
Having made these changes the package now builds successfully. But we're not quite there yet, because these changes are going to cause the exported qtmozembed interfaces to change. These will be picked up by the code in sailfish-browser.
Unlike qtmozembed the changes may not cause sailfish-browser to fail at build time, because it's possible the changes will only affect interpreted QML code rather than compiled C++ code. Let's see...
As I think I've mentioned before, sailfish-browser takes quite a while to build (we're talking tens of minutes rather than hours, but still enough time to make a coffee before it completes).
$ sfdk -c no-fix-version build -d -p
[...]
Loading repository data...
Reading installed packages...
Computing distribution upgrade...
Force resolution: No
The following 2 packages are going to be reinstalled:
qtmozembed-qt5 1.53.9-1
qtmozembed-qt5-devel 1.53.9-1
2 packages to reinstall.
[...]
../../../apps/qtmozembed/declarativewebpage.cpp: In member function
‘void DeclarativeWebPage::loadTab(const QString&, bool)’:
../../../apps/qtmozembed/declarativewebpage.cpp:247:20: error: no matching
function for call to ‘DeclarativeWebPage::load(const QString&)’
load(newUrl);
^
compilation terminated due to -Wfatal-errors.
As we can see, there are some errors coming from the C++ build relating to the API changes. This is good, but it doesn't negate the fact that some changes will still be needed in the QML as well and these won't be flagged as errors during compilation. So we need to take care, but fixing these C++ errors will be a good start.Once again the changes look pretty simple; for example here I'm adding the fromExternal parameter:
void DeclarativeWebPage::loadTab(const QString &newUrl, bool force,
bool fromExternal)
{
// Always enable chrome when load is called.
setChrome(true);
QString oldUrl = url().toString();
if ((!newUrl.isEmpty() && oldUrl != newUrl) || force) {
load(newUrl, fromExternal);
}
}
These changes have some cascading effects and it takes five or six build cycles to get everything straightened out. But eventually it gets there and the build goes through.But that's still not quite enough. As we noted earlier this just tackles the compiled code. We can say that the C++ code is probably now in a pretty decent state, but the QML code is a different matter. The build process won't check the QML for inconsistencies and if there are any, it'll just fail at runtime. So we'll need to look through that next. That will have to be a task for tomorrow.
If you'd like to read any of my other gecko diary entries, they're all available on my Gecko-dev Diary page.
17 Jan 2024 : Day 141 #
Preparations are well underway for FOSDEM'24 and I spent this morning putting together a slide template for my talk on Gecko Development. There's not much content yet, but I still have a bit of time to fill that out. It'll be taking up a bit of time between now and then though, so gecko development may slow down a little.
Continuing on though, yesterday we were looking at the Sec-Fetch headers. With the updated browser these are now added as request headers and it turned out this was the reason DuckDuckGo was serving up broken pages. If the headers are skipped a good version of the page is served. But if an ESR 91 user agent is used then the headers are needed and DuckDuckGo expects them to be set to sensible values.
Right now they don't provide sensible values because the context needed isn't available. For example, the browser isn't distinguishing between pages opened at the command line versus those entered as URLs or through clicking on links. We need to pass that info down from the front-end and into the engine.
The flag we need to set in the case of the page being triggered via command line or D-Bus is LOAD_FLAGS_FROM_EXTERNAL:
I'm reminded of the fact that back on Day 47 I made amendments to the API to add an aUserActivation parameter to the GoBack() and GoForward() methods of PEmbedLiteView.ipdl and that these probably aren't currently being set properly:
Go back to focus on LOAD_FLAGS_FROM_EXTERNAL. To accommodate this I've made some simple changes to EmbedLiteViewChild:
So for the first time in a long time I've set the gecko-dev building once again.
Tomorrow I'll find out what sort of mess I've caused.
If you'd like to read any of my other gecko diary entries, they're all available on my Gecko-dev Diary page.
Comment
Continuing on though, yesterday we were looking at the Sec-Fetch headers. With the updated browser these are now added as request headers and it turned out this was the reason DuckDuckGo was serving up broken pages. If the headers are skipped a good version of the page is served. But if an ESR 91 user agent is used then the headers are needed and DuckDuckGo expects them to be set to sensible values.
Right now they don't provide sensible values because the context needed isn't available. For example, the browser isn't distinguishing between pages opened at the command line versus those entered as URLs or through clicking on links. We need to pass that info down from the front-end and into the engine.
The flag we need to set in the case of the page being triggered via command line or D-Bus is LOAD_FLAGS_FROM_EXTERNAL:
/** * A hint this load was prompted by an external program: take care! */ const unsigned long LOAD_FLAGS_FROM_EXTERNAL = 0x1000;Once this is set it will end up being used in the following conditional inside SecFetch.cpp:
if (!loadInfo->GetLoadTriggeredFromExternal() &&
!loadInfo->GetHasValidUserGestureActivation()) {
For the GetHasValidUserGestureActivation() portion of this the logic ends up looking like this:
bool WindowContext::HasValidTransientUserGestureActivation() {
MOZ_ASSERT(IsInProcess());
if (GetUserActivationState() != UserActivation::State::FullActivated) {
MOZ_ASSERT(mUserGestureStart.IsNull(),
"mUserGestureStart should be null if the document hasn't ever "
"been activated by user gesture");
return false;
}
MOZ_ASSERT(!mUserGestureStart.IsNull(),
"mUserGestureStart shouldn't be null if the document has ever "
"been activated by user gesture");
TimeDuration timeout = TimeDuration::FromMilliseconds(
StaticPrefs::dom_user_activation_transient_timeout());
return timeout <= TimeDuration() ||
(TimeStamp::Now() - mUserGestureStart) <= timeout;
}
Clearly GetUserActivationState() is critical here. This leads back to WindowContext::NotifyUserGestureActivation() and it looks like this is handled automatically inside the gecko code, so not something to worry about. At least, whether we need to worry about it will become clearer as we progress.I'm reminded of the fact that back on Day 47 I made amendments to the API to add an aUserActivation parameter to the GoBack() and GoForward() methods of PEmbedLiteView.ipdl and that these probably aren't currently being set properly:
async GoBack(bool aRequireUserInteraction, bool aUserActivation);
async GoForward(bool aRequireUserInteraction, bool aUserActivation);
It's quite possible these will need fixing as well, although right now I can't see any execution path that runs from either of these down to HasValidTransientUserGestureActivation(). This is looking for one path amongst a thousand meandering paths though, so it would be easy to miss it.Go back to focus on LOAD_FLAGS_FROM_EXTERNAL. To accommodate this I've made some simple changes to EmbedLiteViewChild:
--- a/embedding/embedlite/embedshared/EmbedLiteViewChild.cpp
+++ b/embedding/embedlite/embedshared/EmbedLiteViewChild.cpp
@@ -478,7 +478,7 @@ EmbedLiteViewChild::WebWidget()
/*----------------------------TabChildIface-----------------------------------------------------*/
-mozilla::ipc::IPCResult EmbedLiteViewChild::RecvLoadURL(const nsString &url)
+mozilla::ipc::IPCResult EmbedLiteViewChild::RecvLoadURL(const nsString &url, const bool& aFromExternal)
{
LOGT("url:%s", NS_ConvertUTF16toUTF8(url).get());
NS_ENSURE_TRUE(mWebNavigation, IPC_OK());
@@ -490,6 +490,10 @@ mozilla::ipc::IPCResult EmbedLiteViewChild::RecvLoadURL(const nsString &url)
}
flags |= nsIWebNavigation::LOAD_FLAGS_DISALLOW_INHERIT_PRINCIPAL;
+ if (aFromExternal) {
+ flags |= nsIWebNavigation::LOAD_FLAGS_FROM_EXTERNAL;
+ }
+
LoadURIOptions loadURIOptions;
loadURIOptions.mTriggeringPrincipal = nsContentUtils::GetSystemPrincipal();
loadURIOptions.mLoadFlags = flags;
This change will have a cascading effect through qtmozembed and potentially all the way to sailfish-browser. But the easiest way for me to figure out what's missing or needs changing is for me to build the package find find out what breaks.So for the first time in a long time I've set the gecko-dev building once again.
Tomorrow I'll find out what sort of mess I've caused.
If you'd like to read any of my other gecko diary entries, they're all available on my Gecko-dev Diary page.
16 Jan 2024 : Day 140 #
I'm up early today in the hope of finding evidence of why DuckDuckGo is serving ESR 91 a completely different — and quite broken — version of the search site. Yesterday we established, pretty convincingly I think, that the page being served is different and that it's not the ESR 91 renderer that's the problem. If I view the exact same pages on ESR 78 or a desktop browser I get the same blank page.
Today I plan to look into the request and response headers, and especially the user agent in more detail. Maybe there's something in the request headers which differs between ESR 78 and ESR 91 that I've not noticed.
But I have to warn you: it's a long one today. I recommend skipping the response headers and backtraces if you're in a rush.
And before getting in to the headers I also want to thank Simon (simonschmeisser) and Adrian (amcewen) for their helpful interjections on the Sailfish Forum and Mastodon respectively.
Both of you correctly noticed that one of the files was broken on the copy I made of DuckDuckGo built from the data downloaded using the ESR 91 library. This shows up quite clearly a desktop browser using the dev console (as in Adrian's picture below) and if you try to download the file directly.
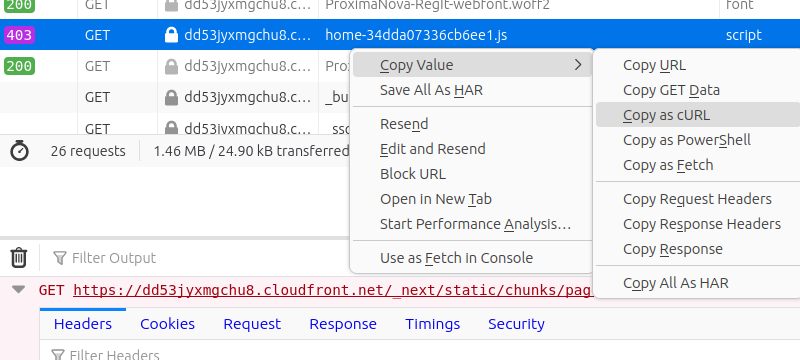
The broken URL is the following:
Interestingly it still doesn't render with ESR 91. Which makes me wonder if the issue is related to the locale. But I'm going to have to come back to this because I've committed myself to looking at request headers today. Nevertheless, a big thank you to both Simon and Adrian. Not only is it reassuring to know my work is being checked, but this could also provide a critical piece of the puzzle.
We have a lot to get through today though, so let's now move on to request headers. We're particularly interested in the index.html file because, as anyone who's worked with webservers before will know, this is the first file to get downloaded and the one that kicks off all of the other downloads. Only files referenced in index.html, or where there's a reference chain back to index.html are going to get downloaded.
Here are the request headers for the index page sent to DuckDuckGo when using ESR 78.
The emphasis here is theirs. In our case we're sending document as the value, which from the docs means:
This feels pretty accurate. How about Sec-Fetch-Mode and its value of navigate?
Again, this all looks pretty unexceptional. Finally the Sec-Fetch-Site header and its value cross-site? According to the docs...
This last one looks suspicious to me. ESR 91 is sending a cross-site value, which is the most risky of all the options, because it's essentially telling DuckDuckGo that the request is happening across different domains. From the docs, it looks like none would be a more appropriate value for this:
Checking the code I notice there's also a fourth Sec-Fetch header in the set which is the Sec-Fetch-User header. This isn't being sent and this might also be important, because the request we're making is user-initiated, so it might be reasonable to expect this header to be included. The docs say this about the header:
In effect, by omitting the header the browser is telling the site that the request isn't initiated by the user, but rather by something else, such as being a document referenced inside some other document.
An obvious thing to test would be to remove these headers and see whether that makes any difference. But before getting on to that let's take a look at the response headers as well.
First the response headers when using ESR 78:
Next the response headers when using ESR 91 and the standard user agent:
If there's nothing particularly interesting to see in the response headers it means we can go back to experimenting with the three Sec-Fetch headers discussed earlier.
Digging through the code and the SecFetch.cpp file in particular, I can see that the headers are added in this method:
This time the headers no longer have any of the Sec-Fetch headers included:
But then I try with the ESR 78 user agent and Sec-Fetch headers disabled... and it works! The site shows correctly, just as it does in ESR 78.
It's a little hard to express the strange mix of jubilation and frustration that I'm feeling right now. Jubilation because we've finally reached the point where it's certain that it will be possible to fix this. Frustration because it's taken quite so long to reach this point.
This feeling pretty much sums up my experience of software development in general. Despite the frustration, this is what I really love about it!
Before claiming that this is fixed, it's worth focusing a little on what the real problem is here. There is a user-agent issue for sure. And arguably DuckDuckGo is trying to frustrate certain users (bots, essentially) by serving different pages to different clients. But the real issue here is that these Sec-Fetch headers are actually broken in our version of gecko ESR 91. That's not the fault of the upstream code: it's a failure of the way the front-end is interacting with the backend code.
So the correct way to fix this issue (at least from the client-side) is to fix those headers. Fixing it for DuckDuckGo is likely to have a positive effect on other sites as well, so fixing it will be worthwhile effort.
That's what I'll now move on to.
As noted above the current (incorrect) values set for the headers are the following:
I'm going to use the debugger to try to find out how these values get set.
That'll have to change now. But it looks like this will be just one of many such flags that will need adding in to the Sailfish code.
Let's focus on LOAD_FLAGS_FROM_EXTERNAL first. This is set in browser.js when a call is made to getContentWindowOrOpenURI(). This ends up running this piece of code:
What's the equivalent for Sailfish Browser? There are three ways it may end up opening an external URL that I can think of. The first is if the application is executed with a URL on the command line:
Let's follow the path in the case of the D-Bus call. The entry point for this is in browserservice.cpp where the D-Bus object is registered. The call looks like this:
Trying to follow all these routes is like trying to follow a droplet of water down a waterfall. I think I've reached the limit of my indirection capacity here; I'm going to need to pick this up again tomorrow.
But, so that I don't lose my thread, a note about two further things I need to do with this.
First I need to follow the process through until I hit the point at which the EmbedLiteViewParent::SendLoadURL() is called. This is the point at which the flag needs to be set. It looks like the common way for this to get called is through the following call:
Second I need to ensure the flag gets passed from the point at which we know what its value needs to be (which is the D-Bus interface) to this call to SendLoadURL(), so that EmbedLiteViewChild::RecvLoadURL() can set it appropriately.
Once I have those two pieces everything will tie together and at that point it will be possible to set the LOAD_FLAGS_FROM_EXTERNAL flag appropriately.
That's it for today. Tomorrow, onwards.
If you'd like to read any of my other gecko diary entries, they're all available on my Gecko-dev Diary page.
Comment
Today I plan to look into the request and response headers, and especially the user agent in more detail. Maybe there's something in the request headers which differs between ESR 78 and ESR 91 that I've not noticed.
But I have to warn you: it's a long one today. I recommend skipping the response headers and backtraces if you're in a rush.
And before getting in to the headers I also want to thank Simon (simonschmeisser) and Adrian (amcewen) for their helpful interjections on the Sailfish Forum and Mastodon respectively.
Both of you correctly noticed that one of the files was broken on the copy I made of DuckDuckGo built from the data downloaded using the ESR 91 library. This shows up quite clearly a desktop browser using the dev console (as in Adrian's picture below) and if you try to download the file directly.
The broken URL is the following:
https://duckduckgo.com/_next/static/chunks/pages/%5Blocale%5D/home-74b6f93f10631d81.jsIt's broken because of the %5B and %5D in the path. These are characters encoded using "URL" or "percent" encoding as originally codified in RFC 3986. The actually represent the left and right square brackets respectively. What's happened is that the Python script I used back on Day 135 has quite correctly output the URL in this encoded format. When I uploaded it to S3 I should have decoded it so that the file was stored in a folder called [locale] like this:
https://duckduckgo.com/_next/static/chunks/pages/[locale]/home-74b6f93f10631d81.jsInstead I left the encoded form in. Oh dear! The file itself is tiny, containing just the following text:
(self.webpackChunk_N_E=self.webpackChunk_N_E||[]).push([[43803],{98387:function
(n,_,u){(window.__NEXT_P=window.__NEXT_P||[]).push(["/[locale]/home",function()
{return u(39265)}])}},function(n){n.O(0,[41966,93432,18040,81125,39337,94623,
95665,55015,61754,55672,38407,49774,92888,40179],(function(){return _=98387,
n(n.s=_);var _}));var _=n.O();_N_E=_}]);
On hearing about my mistake from Simon and Adrian I thought this error would be too small to make any real difference. How wrong I was! Now that I've fixed this the page actually renders now, both in the Sailfish Browser on ESR 78 and on desktop Firefox.Interestingly it still doesn't render with ESR 91. Which makes me wonder if the issue is related to the locale. But I'm going to have to come back to this because I've committed myself to looking at request headers today. Nevertheless, a big thank you to both Simon and Adrian. Not only is it reassuring to know my work is being checked, but this could also provide a critical piece of the puzzle.
We have a lot to get through today though, so let's now move on to request headers. We're particularly interested in the index.html file because, as anyone who's worked with webservers before will know, this is the first file to get downloaded and the one that kicks off all of the other downloads. Only files referenced in index.html, or where there's a reference chain back to index.html are going to get downloaded.
Here are the request headers for the index page sent to DuckDuckGo when using ESR 78.
[ Request details ------------------------------------------- ]
Request: GET status: 200 OK
URL: https://duckduckgo.com/
[ Request headers --------------------------------------- ]
Host : duckduckgo.com
User-Agent : Mozilla/5.0 (Mobile; rv:78.0) Gecko/78.0 Firefox/78.0
Accept : text/html,application/xhtml+xml,application/xml;
q=0.9,image/webp,*/*;q=0.8
Accept-Language : en-GB,en;q=0.5
Accept-Encoding : gzip, deflate, br
Connection : keep-alive
Upgrade-Insecure-Requests : 1
And here are the equivalent headers when accessing the same page of DuckDuckGo when using ESR 91 using the default user agent.
[ Request details ------------------------------------------- ]
Request: GET status: 200 OK
URL: https://duckduckgo.com/
[ Request headers --------------------------------------- ]
Host : duckduckgo.com
User-Agent : Mozilla/5.0 (X11; Linux aarch64; rv:91.0) Gecko/20100101
Firefox/91.0
Accept : text/html,application/xhtml+xml,application/xml;q=0.9,
image/webp,*/*;q=0.8
Accept-Language : en-GB,en;q=0.5
Accept-Encoding : gzip, deflate, br
Connection : keep-alive
Upgrade-Insecure-Requests : 1
Sec-Fetch-Dest : document
Sec-Fetch-Mode : navigate
Sec-Fetch-Site : cross-site
Finally, when setting the user agent to match that of the iPhone the request headers look like this:
[ Request details ------------------------------------------- ]
Request: GET status: 200 OK
URL: https://duckduckgo.com/
[ Request headers --------------------------------------- ]
Host : duckduckgo.com
User-Agent : Mozilla/5.0 (iPhone12,1; U; CPU iPhone OS 13_0 like
Mac OS X) AppleWebKit/602.1.50 (KHTML, like Gecko) Version/10.0
Mobile/15E148 Safari/602.1
Accept : text/html,application/xhtml+xml,application/xml;q=0.9,
image/webp,*/*;q=0.8
Accept-Language : en-GB,en;q=0.5
Accept-Encoding : gzip, deflate, br
Connection : keep-alive
Upgrade-Insecure-Requests : 1
Sec-Fetch-Dest : document
Sec-Fetch-Mode : navigate
Sec-Fetch-Site : cross-site
What do we notice from these? Obviously the user agents are different. The standard ESR 91 user agent isn't identifying itself as a Mobile variant and that's something that needs to be fixed for all sites. The remaining fields in the ESR 78 list are identical to those in ESR 91. However ESR 91 does have some additional fields:
Sec-Fetch-Dest : document
Sec-Fetch-Mode : navigate
Sec-Fetch-Site : cross-site
Let's find out what these do. According to the Mozilla docs, Sec-Fetch-Dest......allows servers determine whether to service a request based on whether it is appropriate for how it is expected to be used. For example, a request with an audio destination should request audio data, not some other type of resource (for example, a document that includes sensitive user information).
The emphasis here is theirs. In our case we're sending document as the value, which from the docs means:
The destination is a document (HTML or XML), and the request is the result of a user-initiated top-level navigation (e.g. resulting from a user clicking a link).
This feels pretty accurate. How about Sec-Fetch-Mode and its value of navigate?
Broadly speaking, this allows a server to distinguish between: requests originating from a user navigating between HTML pages, and requests to load images and other resources. For example, this header would contain navigate for top level navigation requests, while no-cors is used for loading an image. For example, this header would contain navigate for top level navigation requests, while no-cors is used for loading an image.
navigate: The request is initiated by navigation between HTML documents.
navigate: The request is initiated by navigation between HTML documents.
Again, this all looks pretty unexceptional. Finally the Sec-Fetch-Site header and its value cross-site? According to the docs...
...this header tells a server whether a request for a resource is coming from the same origin, the same site, a different site, or is a "user initiated" request. The server can then use this information to decide if the request should be allowed.
cross-site: The request initiator and the server hosting the resource have a different site (i.e. a request by "potentially-evil.com" for a resource at "example.com").
cross-site: The request initiator and the server hosting the resource have a different site (i.e. a request by "potentially-evil.com" for a resource at "example.com").
This last one looks suspicious to me. ESR 91 is sending a cross-site value, which is the most risky of all the options, because it's essentially telling DuckDuckGo that the request is happening across different domains. From the docs, it looks like none would be a more appropriate value for this:
none: This request is a user-originated operation. For example: entering a URL into the address bar, opening a bookmark, or dragging-and-dropping a file into the browser window.
Checking the code I notice there's also a fourth Sec-Fetch header in the set which is the Sec-Fetch-User header. This isn't being sent and this might also be important, because the request we're making is user-initiated, so it might be reasonable to expect this header to be included. The docs say this about the header:
The Sec-Fetch-User fetch metadata request header is only sent for requests initiated by user activation, and its value will always be ?1.
A server can use this header to identify whether a navigation request from a document, iframe, etc., was originated by the user.
A server can use this header to identify whether a navigation request from a document, iframe, etc., was originated by the user.
In effect, by omitting the header the browser is telling the site that the request isn't initiated by the user, but rather by something else, such as being a document referenced inside some other document.
An obvious thing to test would be to remove these headers and see whether that makes any difference. But before getting on to that let's take a look at the response headers as well.
First the response headers when using ESR 78:
[ Response headers -------------------------------------- ]
server : nginx
date : Sun, 07 Jan 2024 16:07:57 GMT
content-type : text/html; charset=UTF-8
content-length : 2357
vary : Accept-Encoding
etag : "65983d82-935"
content-encoding : br
strict-transport-security : max-age=31536000
permissions-policy : interest-cohort=()
content-security-policy : [...] ;
x-frame-options : SAMEORIGIN
x-xss-protection : 1;mode=block
x-content-type-options : nosniff
referrer-policy : origin
expect-ct : max-age=0
expires : Sun, 07 Jan 2024 16:07:56 GMT
cache-control : no-cache
X-Firefox-Spdy : h2
I've removed the content-security-policy value for brevity in all of these responses. They all happen to be the same.Next the response headers when using ESR 91 and the standard user agent:
[ Response headers -------------------------------------- ]
server : nginx
date : Sun, 07 Jan 2024 16:09:35 GMT
content-type : text/html; charset=UTF-8
content-length : 18206
vary : Accept-Encoding
etag : "65983d80-471e"
content-encoding : br
strict-transport-security : max-age=31536000
permissions-policy : interest-cohort=()
content-security-policy : [...] ;
x-frame-options : SAMEORIGIN
x-xss-protection : 1;mode=block
x-content-type-options : nosniff
referrer-policy : origin
expect-ct : max-age=0
expires : Sun, 07 Jan 2024 16:09:34 GMT
cache-control : no-cache
X-Firefox-Spdy : h2
And finally the response headers when using ESR 91 and the iPhone user agent:
[ Response headers -------------------------------------- ]
server : nginx
date : Sat, 13 Jan 2024 22:20:49 GMT
content-type : text/html; charset=UTF-8
content-length : 18221
vary : Accept-Encoding
etag : "65a1788c-472d"
content-encoding : br
strict-transport-security : max-age=31536000
permissions-policy : interest-cohort=()
content-security-policy : [...] ;
x-frame-options : SAMEORIGIN
x-xss-protection : 1;mode=block
x-content-type-options : nosniff
referrer-policy : origin
expect-ct : max-age=0
expires : Sat, 13 Jan 2024 22:20:48 GMT
cache-control : no-cache
X-Firefox-Spdy : h2
All three share the same response header keys and values apart from the following three which have different values across all three responses:
date : Sun, 07 Jan 2024 16:07:57 GMT
content-length : 2357
etag : "65983d82-935"
expires : Sun, 07 Jan 2024 16:07:56 GMT
It's not surprising these are different across the three. In fact, if they weren't, that might suggest something more sinister. The only one that's really problematic is the content-length value, not because it's incorrect, but because the three different values highlights the fact we're being served three different pages depending on the request.If there's nothing particularly interesting to see in the response headers it means we can go back to experimenting with the three Sec-Fetch headers discussed earlier.
Digging through the code and the SecFetch.cpp file in particular, I can see that the headers are added in this method:
void mozilla::dom::SecFetch::AddSecFetchHeader(nsIHttpChannel* aHTTPChannel) {
// if sec-fetch-* is prefed off, then there is nothing to do
if (!StaticPrefs::dom_security_secFetch_enabled()) {
return;
}
nsCOMPtr<nsIURI> uri;
nsresult rv = aHTTPChannel->GetURI(getter_AddRefs(uri));
if (NS_WARN_IF(NS_FAILED(rv))) {
return;
}
// if we are not dealing with a potentially trustworthy URL, then
// there is nothing to do here
if (!nsMixedContentBlocker::IsPotentiallyTrustworthyOrigin(uri)) {
return;
}
AddSecFetchDest(aHTTPChannel);
AddSecFetchMode(aHTTPChannel);
AddSecFetchSite(aHTTPChannel);
AddSecFetchUser(aHTTPChannel);
}
The bit I'm interested in is the first condition which bails out of the method if a specific preference is disabled. Happily this preference was easy to establish as being exposed through about:config as dom.security.secFetch.enabled. I've now disabled it and can try loading the site again.This time the headers no longer have any of the Sec-Fetch headers included:
[ Request details ------------------------------------------- ]
Request: GET status: 200 OK
URL: https://duckduckgo.com/
[ Request headers --------------------------------------- ]
Host : duckduckgo.com
User-Agent : Mozilla/5.0 (X11; Linux aarch64; rv:91.0) Gecko/20100101
Firefox/91.0
Accept : text/html,application/xhtml+xml,application/xml;q=0.9,
image/webp,*/*;q=0.8
Accept-Language : en-GB,en;q=0.5
Accept-Encoding : gzip, deflate, br
Connection : keep-alive
Upgrade-Insecure-Requests : 1
Sadly this doesn't fix the issue, I still get the same blank screen. I try again with the iPhone user agent, same result.But then I try with the ESR 78 user agent and Sec-Fetch headers disabled... and it works! The site shows correctly, just as it does in ESR 78.
It's a little hard to express the strange mix of jubilation and frustration that I'm feeling right now. Jubilation because we've finally reached the point where it's certain that it will be possible to fix this. Frustration because it's taken quite so long to reach this point.
This feeling pretty much sums up my experience of software development in general. Despite the frustration, this is what I really love about it!
Before claiming that this is fixed, it's worth focusing a little on what the real problem is here. There is a user-agent issue for sure. And arguably DuckDuckGo is trying to frustrate certain users (bots, essentially) by serving different pages to different clients. But the real issue here is that these Sec-Fetch headers are actually broken in our version of gecko ESR 91. That's not the fault of the upstream code: it's a failure of the way the front-end is interacting with the backend code.
So the correct way to fix this issue (at least from the client-side) is to fix those headers. Fixing it for DuckDuckGo is likely to have a positive effect on other sites as well, so fixing it will be worthwhile effort.
That's what I'll now move on to.
As noted above the current (incorrect) values set for the headers are the following:
Sec-Fetch-Dest : document
Sec-Fetch-Mode : navigate
Sec-Fetch-Site : cross-site
What we'd expect and want to see for a user-triggered access to DuckDuckGo is this:
Sec-Fetch-Dest : document
Sec-Fetch-Mode : navigate
Sec-Fetch-Site : none
Sec-Fetch-User : ?1
Let's check the code for the two incorrect values. First the site value:
void mozilla::dom::SecFetch::AddSecFetchSite(nsIHttpChannel* aHTTPChannel) {
nsAutoCString site("same-origin");
bool isSameOrigin = IsSameOrigin(aHTTPChannel);
if (!isSameOrigin) {
bool isSameSite = IsSameSite(aHTTPChannel);
if (isSameSite) {
site = "same-site"_ns;
} else {
site = "cross-site"_ns;
}
}
if (IsUserTriggeredForSecFetchSite(aHTTPChannel)) {
site = "none"_ns;
}
nsresult rv =
aHTTPChannel->SetRequestHeader("Sec-Fetch-Site"_ns, site, false);
mozilla::Unused << NS_WARN_IF(NS_FAILED(rv));
}
We can infer that isSameOrigin and isSameSite are both set to false. This is a bit strange but it's actually not the bit we have to worry about. The result of going through the initial condition will be overwritten if IsUserTriggeredForSecFetchSite() returns true so that's where we should focus.I'm going to use the debugger to try to find out how these values get set.
$ rm -rf ~/.local/share/org.sailfishos/browser/.mozilla/cache2/ \
~/.local/share/org.sailfishos/browser/.mozilla/startupCache/ ~/.local/share/org.sailfishos/browser/.mozilla/cookies.sqlite
$ gdb sailfish-browser
[...]
(gdb) r
[...]
(gdb) b LoadInfo::SetHasValidUserGestureActivation
Breakpoint 4 at 0x7fb9d34424: file netwerk/base/LoadInfo.cpp, line 1609.
(gdb) b LoadInfo::SetLoadTriggeredFromExternal
Breakpoint 5 at 0x7fb9d34300: file netwerk/base/LoadInfo.cpp, line 1472.
(gdb) c
Thread 8 "GeckoWorkerThre" hit Breakpoint 4, mozilla::net::LoadInfo::
SetHasValidUserGestureActivation (this=this@entry=0x7f89b00da0,
aHasValidUserGestureActivation=false) at netwerk/base/LoadInfo.cpp:1609
1609 mHasValidUserGestureActivation = aHasValidUserGestureActivation;
(gdb) bt
#0 mozilla::net::LoadInfo::SetHasValidUserGestureActivation
(this=this@entry=0x7f89b00da0, aHasValidUserGestureActivation=false)
at netwerk/base/LoadInfo.cpp:1609
#1 0x0000007fb9ffd86c in mozilla::net::CreateDocumentLoadInfo
(aBrowsingContext=aBrowsingContext@entry=0x7f88c6dde0,
aLoadState=aLoadState@entry=0x7f894082d0)
at netwerk/ipc/DocumentLoadListener.cpp:149
#2 0x0000007fb9ffd9b8 in mozilla::net::DocumentLoadListener::OpenDocument
(this=0x7f89a8c3e0, aLoadState=0x7f894082d0, aCacheKey=0, aChannelId=...,
aAsyncOpenTime=..., aTiming=0x0, aInfo=..., aUriModified=...,
aIsXFOError=..., aPid=aPid@entry=0, aRv=aRv@entry=0x7f9f3eda34)
at netwerk/ipc/DocumentLoadListener.cpp:744
#3 0x0000007fb9ffe88c in mozilla::net::ParentProcessDocumentChannel::AsyncOpen
(this=0x7f89bf02e0, aListener=0x7f895a7770)
at ${PROJECT}/obj-build-mer-qt-xr/dist/include/mozilla/MaybeStorageBase.h:80
#4 0x0000007fba4663bc in nsURILoader::OpenURI (this=0x7f887b46c0,
channel=0x7f89bf02e0, aFlags=0, aWindowContext=0x7f886044f0)
at ${PROJECT}/obj-build-mer-qt-xr/dist/include/nsCOMPtr.h:859
#5 0x0000007fbc7fa824 in nsDocShell::OpenInitializedChannel
(this=this@entry=0x7f886044c0, aChannel=0x7f89bf02e0,
aURILoader=0x7f887b46c0, aOpenFlags=0)
at docshell/base/nsDocShell.cpp:10488
#6 0x0000007fbc7fb5e4 in nsDocShell::DoURILoad (this=this@entry=0x7f886044c0,
aLoadState=aLoadState@entry=0x7f894082d0, aCacheKey=...,
aRequest=aRequest@entry=0x7f9f3edf90)
at ${PROJECT}/obj-build-mer-qt-xr/dist/include/nsCOMPtr.h:859
#7 0x0000007fbc7fc1a4 in nsDocShell::InternalLoad
(this=this@entry=0x7f886044c0, aLoadState=aLoadState@entry=0x7f894082d0,
aCacheKey=...)
at ${PROJECT}/obj-build-mer-qt-xr/dist/include/nsCOMPtr.h:1363
#8 0x0000007fbc801c20 in nsDocShell::ReloadDocument
(aDocShell=aDocShell@entry=0x7f886044c0, aDocument=<optimized out>,
aLoadType=aLoadType@entry=2, aBrowsingContext=0x7f88c6dde0,
aCurrentURI=0x7f887e62c0, aReferrerInfo=0x0,
aNotifiedBeforeUnloadListeners=aNotifiedBeforeUnloadListeners@entry=false)
at ${PROJECT}/obj-build-mer-qt-xr/dist/include/mozilla/MaybeStorageBase.h:79
#9 0x0000007fbc803984 in nsDocShell::Reload (this=0x7f886044c0, aReloadFlags=0)
at ${PROJECT}/obj-build-mer-qt-xr/dist/include/nsCOMPtr.h:859
#10 0x0000007fbc94d05c in nsWebBrowser::Reload (this=<optimized out>,
aReloadFlags=<optimized out>)
at toolkit/components/browser/nsWebBrowser.cpp:507
#11 0x0000007fbcb0ab70 in mozilla::embedlite::EmbedLiteViewChild::RecvReload
(this=<optimized out>, aHardReload=<optimized out>)
at mobile/sailfishos/embedshared/EmbedLiteViewChild.cpp:533
#12 0x0000007fba1915d0 in mozilla::embedlite::PEmbedLiteViewChild::
OnMessageReceived (this=0x7f88767020, msg__=...)
at PEmbedLiteViewChild.cpp:1152
#13 0x0000007fba17f05c in mozilla::embedlite::PEmbedLiteAppChild::
OnMessageReceived (this=<optimized out>, msg__=...)
at ${PROJECT}/obj-build-mer-qt-xr/dist/include/mozilla/ipc/ProtocolUtils.h:675
#14 0x0000007fba06b85c in mozilla::ipc::MessageChannel::DispatchAsyncMessage
(this=this@entry=0x7f88b3e8a8, aProxy=aProxy@entry=0x7ebc003140, aMsg=...)
at ${PROJECT}/obj-build-mer-qt-xr/dist/include/mozilla/ipc/ProtocolUtils.h:675
[...]
#40 0x0000007fb78b289c in ?? () from /lib64/libc.so.6
(gdb) c
Continuing.
Thread 8 "GeckoWorkerThre" hit Breakpoint 5, mozilla::net::LoadInfo::
SetLoadTriggeredFromExternal (this=this@entry=0x7f89b00da0,
aLoadTriggeredFromExternal=false) at netwerk/base/LoadInfo.cpp:1472
1472 mLoadTriggeredFromExternal = aLoadTriggeredFromExternal;
(gdb) bt
#0 mozilla::net::LoadInfo::SetLoadTriggeredFromExternal
(this=this@entry=0x7f89b00da0, aLoadTriggeredFromExternal=false)
at netwerk/base/LoadInfo.cpp:1472
#1 0x0000007fbc7f20f8 in nsDocShell::CreateAndConfigureRealChannelForLoadState
(aBrowsingContext=aBrowsingContext@entry=0x7f88c6dde0,
aLoadState=aLoadState@entry=0x7f894082d0,
aLoadInfo=aLoadInfo@entry=0x7f89b00da0,
aCallbacks=aCallbacks@entry=0x7f89724110,
aDocShell=aDocShell@entry=0x0, aOriginAttributes=...,
aLoadFlags=aLoadFlags@entry=2689028, aCacheKey=aCacheKey@entry=0,
aRv=@0x7f9f3eda34: nsresult::NS_OK, aChannel=aChannel@entry=0x7f89a8c438)
at docshell/base/nsDocShellLoadState.cpp:709
#2 0x0000007fb9ff9c4c in mozilla::net::DocumentLoadListener::Open
(this=this@entry=0x7f89a8c3e0, aLoadState=aLoadState@entry=0x7f894082d0,
aLoadInfo=aLoadInfo@entry=0x7f89b00da0, aLoadFlags=2689028,
aCacheKey=aCacheKey@entry=0, aChannelId=..., aAsyncOpenTime=...,
aTiming=aTiming@entry=0x0, aInfo=..., aUrgentStart=aUrgentStart@entry=false,
aPid=aPid@entry=0, aRv=aRv@entry=0x7f9f3eda34)
at ${PROJECT}/obj-build-mer-qt-xr/dist/include/nsCOMPtr.h:359
#3 0x0000007fb9ffda34 in mozilla::net::DocumentLoadListener::OpenDocument
(this=0x7f89a8c3e0, aLoadState=0x7f894082d0, aCacheKey=0, aChannelId=...,
aAsyncOpenTime=..., aTiming=0x0, aInfo=..., aUriModified=...,
aIsXFOError=..., aPid=aPid@entry=0, aRv=aRv@entry=0x7f9f3eda34)
at netwerk/ipc/DocumentLoadListener.cpp:750
#4 0x0000007fb9ffe88c in mozilla::net::ParentProcessDocumentChannel::AsyncOpen
(this=0x7f89bf02e0, aListener=0x7f895a7770)
at ${PROJECT}/obj-build-mer-qt-xr/dist/include/mozilla/MaybeStorageBase.h:80
#5 0x0000007fba4663bc in nsURILoader::OpenURI (this=0x7f887b46c0,
channel=0x7f89bf02e0, aFlags=0, aWindowContext=0x7f886044f0)
at ${PROJECT}/obj-build-mer-qt-xr/dist/include/nsCOMPtr.h:859
#6 0x0000007fbc7fa824 in nsDocShell::OpenInitializedChannel
(this=this@entry=0x7f886044c0, aChannel=0x7f89bf02e0,
aURILoader=0x7f887b46c0, aOpenFlags=0)
at docshell/base/nsDocShell.cpp:10488
#7 0x0000007fbc7fb5e4 in nsDocShell::DoURILoad (this=this@entry=0x7f886044c0,
aLoadState=aLoadState@entry=0x7f894082d0, aCacheKey=...,
aRequest=aRequest@entry=0x7f9f3edf90)
at ${PROJECT}/obj-build-mer-qt-xr/dist/include/nsCOMPtr.h:859
#8 0x0000007fbc7fc1a4 in nsDocShell::InternalLoad (this=this@entry=0x7f886044c0,
aLoadState=aLoadState@entry=0x7f894082d0, aCacheKey=...)
at ${PROJECT}/obj-build-mer-qt-xr/dist/include/nsCOMPtr.h:1363
#9 0x0000007fbc801c20 in nsDocShell::ReloadDocument
(aDocShell=aDocShell@entry=0x7f886044c0, aDocument=<optimized out>,
aLoadType=aLoadType@entry=2, aBrowsingContext=0x7f88c6dde0,
aCurrentURI=0x7f887e62c0, aReferrerInfo=0x0,
aNotifiedBeforeUnloadListeners=aNotifiedBeforeUnloadListeners@entry=false)
at ${PROJECT}/obj-build-mer-qt-xr/dist/include/mozilla/MaybeStorageBase.h:79
#10 0x0000007fbc803984 in nsDocShell::Reload (this=0x7f886044c0, aReloadFlags=0)
at ${PROJECT}/obj-build-mer-qt-xr/dist/include/nsCOMPtr.h:859
#11 0x0000007fbc94d05c in nsWebBrowser::Reload (this=<optimized out>,
aReloadFlags=<optimized out>)
at toolkit/components/browser/nsWebBrowser.cpp:507
#12 0x0000007fbcb0ab70 in mozilla::embedlite::EmbedLiteViewChild::RecvReload
(this=<optimized out>, aHardReload=<optimized out>)
at mobile/sailfishos/embedshared/EmbedLiteViewChild.cpp:533
#13 0x0000007fba1915d0 in mozilla::embedlite::PEmbedLiteViewChild::
OnMessageReceived (this=0x7f88767020, msg__=...)
at PEmbedLiteViewChild.cpp:1152
#14 0x0000007fba17f05c in mozilla::embedlite::PEmbedLiteAppChild::
OnMessageReceived (this=<optimized out>, msg__=...)
at ${PROJECT}/obj-build-mer-qt-xr/dist/include/mozilla/ipc/ProtocolUtils.h:675
#15 0x0000007fba06b85c in mozilla::ipc::MessageChannel::DispatchAsyncMessage
(this=this@entry=0x7f88b3e8a8, aProxy=aProxy@entry=0x7ebc003140, aMsg=...)
at ${PROJECT}/obj-build-mer-qt-xr/dist/include/mozilla/ipc/ProtocolUtils.h:675
[...]
#41 0x0000007fb78b289c in ?? () from /lib64/libc.so.6
(gdb) c
[...]
Digging deeper to find out where the value for mHasValidUserGestureActivation is coming from. It's being set to false and we need to know why.
(gdb) disable break
(gdb) break nsDocShell.cpp:4108
Breakpoint 6 at 0x7fbc801bec: file docshell/base/nsDocShell.cpp, line 4108.
(gdb) c
Continuing.
[Switching to LWP 29933]
Thread 8 "GeckoWorkerThre" hit Breakpoint 6, nsDocShell::ReloadDocument
(aDocShell=aDocShell@entry=0x7f886044c0, aDocument=<optimized out>,
aLoadType=aLoadType@entry=2, aBrowsingContext=0x7f88c6dde0,
aCurrentURI=0x7f887e62c0, aReferrerInfo=0x0,
aNotifiedBeforeUnloadListeners=aNotifiedBeforeUnloadListeners@entry=false)
at docshell/base/nsDocShell.cpp:4108
4108 loadState->SetHasValidUserGestureActivation(
(gdb) p context
$14 = {mRawPtr = 0x7ed4009980}
(gdb) p context.mRawPtr
$15 = (mozilla::dom::WindowContext *) 0x7ed4009980
(gdb) p *(context.mRawPtr)
$16 = {<nsISupports> = {_vptr.nsISupports = 0x7fbf75c7a0 <vtable for
mozilla::dom::WindowGlobalParent+16>}, <nsWrapperCache> = {
[...]
mInnerWindowId = 16, mOuterWindowId = 1, mBrowsingContext = { mRawPtr =
0x7f88c6dde0}, mWindowGlobalChild = {mRef = {mRawPtr = 0x7f895aa790}},
mChildren = {<nsTArray_Impl<RefPtr<mozilla::dom::BrowsingContext>,
nsTArrayInfallibleAllocator>> = {
<nsTArray_base<nsTArrayInfallibleAllocator,
nsTArray_RelocateUsingMemutils>> = { mHdr = 0x7fbe0c86b8
<sEmptyTArrayHeader>},
<nsTArray_TypedBase<RefPtr<mozilla::dom::BrowsingContext>,
nsTArray_Impl<RefPtr<mozilla::dom::BrowsingContext>,
nsTArrayInfallibleAllocator> >> = {
<nsTArray_SafeElementAtHelper<RefPtr<mozilla::dom::BrowsingContext>,
nsTArray_Impl<RefPtr<mozilla::dom::BrowsingContext>,
nsTArrayInfallibleAllocator> >> =
{<nsTArray_SafeElementAtSmartPtrHelper<RefPtr<mozilla::dom::BrowsingContext>,
nsTArray_Impl<RefPtr<mozilla::dom::BrowsingContext>,
nsTArrayInfallibleAllocator> >> = {<detail::nsTArray_CopyDisabler> =
{<No data fields>}, <No data fields>}, <No data fields>},
<No data fields>}, static NoIndex = 18446744073709551615},
<No data fields>}, mIsDiscarded = false, mIsInProcess = true,
mCanExecuteScripts = true,
mUserGestureStart = {mValue = {mUsedCanonicalNow = 0, mTimeStamp = 0}}}
(gdb)
I eventually end up here in nsDocShell.cpp:
aLoadInfo->SetLoadTriggeredFromExternal(
aLoadState->HasLoadFlags(LOAD_FLAGS_FROM_EXTERNAL));
This is important because of external are considered user triggered as mentioned in the comments in SecFetch::AddSecFetchUser():
// sec-fetch-user only applies if the request is user triggered.
// requests triggered by an external application are considerd user triggered.
if (!loadInfo->GetLoadTriggeredFromExternal() &&
!loadInfo->GetHasValidUserGestureActivation()) {
return;
}
These load flags are set all over the place, although the LOAD_FLAGS_FROM_EXTERNAL specifically is only set in tabbrowser.js in the upstream code, which I believe is code we don't use for the Sailfish Browser. Instead we set these flags in EmbedLiteViewChild.cpp. It's possible there are some new flags which we need to add there. Let's check the history using git blame. I happen to see from the source code that the flag is being set on line 1798 of the tabbrowser.js file:
$ git blame browser/base/content/tabbrowser.js -L1798,1798
f9f59140398bc (Victor Porof 2019-07-05 09:48:57 +0200 1798)
flags |= Ci.nsIWebNavigation.LOAD_FLAGS_FROM_EXTERNAL;
$ git log -1 --oneline f9f59140398bc
f9f59140398b Bug 1561435 - Format browser/base/, a=automatic-formatting
$ git log -1 f9f59140398bc
commit f9f59140398bc4d04d840e8217c04e0d7eafafb9
Author: Victor Porof <vporof@mozilla.com>
Date: Fri Jul 5 09:48:57 2019 +0200
Bug 1561435 - Format browser/base/, a=automatic-formatting
# ignore-this-changeset
Differential Revision: https://phabricator.services.mozilla.com/D36041
--HG--
extra : source : 96b3895a3b2aa2fcb064c85ec5857b7216884556
This commit is just reformatting the file so we need to look at the change prior to this one. Checking the diff of the automatic formatting I can see that before this the relevant line of code was line 1541 in the same file.
$ git blame f9f59140398bc~ browser/base/content/tabbrowser.js -L1541,1541
082b6eb1e7ed2 (James Willcox 2019-03-12 20:20:58 +0000 1541)
flags |= Ci.nsIWebNavigation.LOAD_FLAGS_FROM_EXTERNAL;
$ git log -1 082b6eb1e7ed2
commit 082b6eb1e7ed20de7424aea94fb7ce40b1b39c36
Author: James Willcox <snorp@snorp.net>
Date: Tue Mar 12 20:20:58 2019 +0000
Bug 1524992 - Treat command line URIs as external r=mconley
Differential Revision: https://phabricator.services.mozilla.com/D20890
--HG--
extra : moz-landing-system : lando
This is the important change. It added the flag specifically for URIs triggered at the command line. As it happens that's currently one of the ways I've been testing, so I should fix this. It's worth noting that this flag was introduced in ESR 67 so has actually been around for a while. But I guess skipping it didn't have any obvious negative effects, so nobody noticed it needed to be handled.That'll have to change now. But it looks like this will be just one of many such flags that will need adding in to the Sailfish code.
Let's focus on LOAD_FLAGS_FROM_EXTERNAL first. This is set in browser.js when a call is made to getContentWindowOrOpenURI(). This ends up running this piece of code:
default:
// OPEN_CURRENTWINDOW or an illegal value
browsingContext = window.gBrowser.selectedBrowser.browsingContext;
if (aURI) {
let loadFlags = Ci.nsIWebNavigation.LOAD_FLAGS_NONE;
if (isExternal) {
loadFlags |= Ci.nsIWebNavigation.LOAD_FLAGS_FROM_EXTERNAL;
} else if (!aTriggeringPrincipal.isSystemPrincipal) {
// XXX this code must be reviewed and changed when bug 1616353
// lands.
loadFlags |= Ci.nsIWebNavigation.LOAD_FLAGS_FIRST_LOAD;
}
gBrowser.loadURI(aURI.spec, {
triggeringPrincipal: aTriggeringPrincipal,
csp: aCsp,
loadFlags,
referrerInfo,
});
}
We end up here when there's a call made to handURIToExistingBrowser() in BrowserContentHandler.jsm which then calls browserDOMWindow.openURI() with the aFlags parameter set to Ci.nsIBrowserDOMWindow.OPEN_EXTERNAL.What's the equivalent for Sailfish Browser? There are three ways it may end up opening an external URL that I can think of. The first is if the application is executed with a URL on the command line:
$ sailfish-browser https://www.flypig.co.uk/geckoAnother is if xdg-open is called:
$ xdg-open https://www.flypig.co.uk/geckoThe third is if the browser is called via its D-Bus interface:
$ gdbus call --session --dest org.sailfishos.browser.ui --object-path /ui \
--method org.sailfishos.browser.ui.openUrl \
"['https://www.flypig.co.uk/gecko']"
All of these should end up setting the LOAD_FLAGS_FROM_EXTERNAL flag.Let's follow the path in the case of the D-Bus call. The entry point for this is in browserservice.cpp where the D-Bus object is registered. The call looks like this:
void BrowserUIService::openUrl(const QStringList &args)
{
if(args.count() > 0) {
emit openUrlRequested(args.first());
} else {
emit openUrlRequested(QString());
}
}
This gets picked up by the browser object via a connection in main.cpp:
browser->connect(uiService, &BrowserUIService::openUrlRequested,
browser, &Browser::openUrl);
Which triggers the following method:
void Browser::openUrl(const QString &url)
{
Q_D(Browser);
DeclarativeWebUtils::instance()->openUrl(url);
}
The version of the method in DeclarativeWebUtils sanitises the url before sending it on its way by emitting a signal:
emit openUrlRequested(tmpUrl);
Finally this is picked up by BrowserPage.qml which ends up doing one of three things with it:
Connections {
target: WebUtils
onOpenUrlRequested: {
[...]
if (webView.tabModel.activateTab(url)) {
webView.releaseActiveTabOwnership()
} else if (!webView.tabModel.loaded) {
webView.load(url)
} else {
webView.clearSelection()
webView.tabModel.newTab(url)
overlay.dismiss(true, !Qt.application.active /* immadiate */)
}
So it either activates an existing tab, calls the user interface to create the very first tab, or adds a new tab to the existing list. This approach contrasts with the route taken when the user enters a URL. In this case the process is handled in Overlay.qml and the loadPage() function there. This does a bunch of checks before calling this:
webView.load(pageUrl)
Notice that this is also one of the methods that's called in the case of the D-Bus trigger as well. That's important, because we need to distinguish between these two routes. The WebView component inherits load() from DeclarativeWebContainer where the method looks like this:
void DeclarativeWebContainer::load(const QString &url, bool force)
{
QString tmpUrl = url;
if (tmpUrl.isEmpty() || !browserEnabled()) {
tmpUrl = ABOUT_BLANK;
}
if (!canInitialize()) {
m_initialUrl = tmpUrl;
} else if (m_webPage && m_webPage->completed()) {
if (m_loading) {
m_webPage->stop();
}
m_webPage->loadTab(tmpUrl, force);
Tab *tab = m_model->getTab(m_webPage->tabId());
if (tab) {
tab->setRequestedUrl(tmpUrl);
}
} else if (m_model && m_model->count() == 0) {
// Browser running all tabs are closed.
m_model->newTab(tmpUrl);
}
}
Notice that this mimics the D-Bus route with there being three options: record the URL in case there's a failure, load the URL into an existing tab or create a new tab if there are none already available.Trying to follow all these routes is like trying to follow a droplet of water down a waterfall. I think I've reached the limit of my indirection capacity here; I'm going to need to pick this up again tomorrow.
But, so that I don't lose my thread, a note about two further things I need to do with this.
First I need to follow the process through until I hit the point at which the EmbedLiteViewParent::SendLoadURL() is called. This is the point at which the flag needs to be set. It looks like the common way for this to get called is through the following call:
void
EmbedLiteView::LoadURL(const char* aUrl)
{
LOGT("url:%s", aUrl);
Unused << mViewParent->SendLoadURL(NS_ConvertUTF8toUTF16(nsDependentCString(aUrl)));
}
I should check this with the debugger to make sure.Second I need to ensure the flag gets passed from the point at which we know what its value needs to be (which is the D-Bus interface) to this call to SendLoadURL(), so that EmbedLiteViewChild::RecvLoadURL() can set it appropriately.
Once I have those two pieces everything will tie together and at that point it will be possible to set the LOAD_FLAGS_FROM_EXTERNAL flag appropriately.
That's it for today. Tomorrow, onwards.
If you'd like to read any of my other gecko diary entries, they're all available on my Gecko-dev Diary page.
15 Jan 2024 : Day 139 #
This morning I transferred the DuckDuckGo testing website from S3 where we had it yesterday to Amazon CloudFront. This still uses the S3 bucket to serve the pages as a static site, but now with a cloudfront.net URL (which shouldn't make any difference for the tests) and using HTTPS (which might make a difference). I want to use HTTPS not because I'm worried about the integrity of the site, but because I want to eliminate differences between how I'm accessing the real DuckDuckGo and the test page version I'm using.
A small, overly-optimistic, bit of me was hoping that the switch to HTTPS might cause the site to break when using ESR 91, but it didn't. The DuckDuckGo logo shows just fine, the page looks sensible, albeit still showing the peculiar differences in functionality that I described yesterday.
The next steps are to capture the full output from accessing the original site using ESR 91, followed by the same process accessing the test site using ESR 91. In order to do this I'll need to build and run the recent changes I made to the EmbedLiteConsoleListener.js code so that it can be installed on my ESR 91 device. I made the changes manually on my ESR 78 device, and although I did already manually copy those changes over to the local repository on my development machine, I've not yet built and installed them for my other phone.
Having done that, I now need to capture a copy of the site using the ESR 91 version of the browser. I'll capture both a copy of the real site and a copy of the replicated version of the site (the version downloaded using ESR 78):
I also tried downloading a copy using ESR 91 and the iPhone user agent string from yesterday. But the site downloaded was the same.
What I want to do now is create a copy of the site downloaded when I use ESR 91. This is the site that's broken (showing just a blank page) when rendered using the ESR 91 renderer. But although the page is blank it is still downloading a bunch of files, so there's definitely something to replicate.
Having done this process before I'm getting quite proficient at it now. The process goes like this:
There's one final check to make and that's to access the copy of the site originally downloaded using ESR 91 and now being served on CloudFront (the ddg9 version of the site), but using ESR 91. Why do this? Once I've got this I can compare the files downloaded this way with the files downloaded directly from DuckDuckGo using ESR 91.
If the copy is good, the files downloaded should be very similar, if not identical.
I've done this now, so have two copies of the log output. Let's compare them using the comparison command I put together a few days back.
Visiting this copy of the site in other browsers, including ESR 78 and the desktop version of Firefox, shows that the site doesn't render there either.
It's been a long journey to get to this point, but this is clear evidence that the problem is the site being served to ESR 91, rather than the ESR 91 rendering engine or JavaScript interpreter getting stuck after the site has been received.
This means I have to concentrate on persuading DuckDuckGo to serve the same version of the page that it's serving to ESR 78. It's taken far too long to get here, but at least I feel I've learnt something in the process about how to perform these checks, how to download accurate copies of a website and how to serve them using CloudFront so that they don't have to go in a sub-directory.
I've already tried with multiple different user agents and that hasn't been enough to persuade DuckDuckGo to serve the correct version of the page, so I'm not quite sure how to get around this issue. One possibility is that I'm not actually using the user agents I think I am. So this will be something to check tomorrow.
If you'd like to read any of my other gecko diary entries, they're all available on my Gecko-dev Diary page.
Comment
A small, overly-optimistic, bit of me was hoping that the switch to HTTPS might cause the site to break when using ESR 91, but it didn't. The DuckDuckGo logo shows just fine, the page looks sensible, albeit still showing the peculiar differences in functionality that I described yesterday.
The next steps are to capture the full output from accessing the original site using ESR 91, followed by the same process accessing the test site using ESR 91. In order to do this I'll need to build and run the recent changes I made to the EmbedLiteConsoleListener.js code so that it can be installed on my ESR 91 device. I made the changes manually on my ESR 78 device, and although I did already manually copy those changes over to the local repository on my development machine, I've not yet built and installed them for my other phone.
Having done that, I now need to capture a copy of the site using the ESR 91 version of the browser. I'll capture both a copy of the real site and a copy of the replicated version of the site (the version downloaded using ESR 78):
$ rm -rf ~/.local/share/org.sailfishos/browser
$ EMBED_CONSOLE="network" sailfish-browser \
https://d3gf5xld99gmbj.cloudfront.net/ 2>&1 > esr91-ddg-copy.txt
[...]
$ rm -rf ~/.local/share/org.sailfishos/browser
$ EMBED_CONSOLE="network" sailfish-browser \
https://duckduckgo.com/ 2>&1 > esr91-ddg-orig.txt
[...]
Looking through the output of both it's clear that they're quite different. Just starting with the index.html page, the very first line of each differ significantly. So it really does seem to be the case that DuckDuckGo is serving a different version of the page.I also tried downloading a copy using ESR 91 and the iPhone user agent string from yesterday. But the site downloaded was the same.
What I want to do now is create a copy of the site downloaded when I use ESR 91. This is the site that's broken (showing just a blank page) when rendered using the ESR 91 renderer. But although the page is blank it is still downloading a bunch of files, so there's definitely something to replicate.
Having done this process before I'm getting quite proficient at it now. The process goes like this:
- Take the log output from loading the page, with the full network dump enabled
- Work through this log file and whenever there's some text content in the log, cut and paste this out into its own file. This is then a copy of the file as it was downloaded by the Sailfish Browser.
- Carefully save this file out using the same file structure as served by the server (matching the suffix of the URL of the file downloaded).
- Having recreated all of these files, create an S3 bucket on AWS and copy all of these files in to it.
- Create a CloudFront distribution of the bucket. To reiterate, I do it this way rather than just serving the bucket as a static site so that I can offer the site with HTTPS access.
- ddg8: the original DuckDuckGo site as downloaded by ESR 78: https://d3gf5xld99gmbj.cloudfront.net/.
- ddg9: the original DuckDuckGo site as downloaded by ESR 91: https://dd53jyxmgchu8.cloudfront.net/.
There's one final check to make and that's to access the copy of the site originally downloaded using ESR 91 and now being served on CloudFront (the ddg9 version of the site), but using ESR 91. Why do this? Once I've got this I can compare the files downloaded this way with the files downloaded directly from DuckDuckGo using ESR 91.
If the copy is good, the files downloaded should be very similar, if not identical.
I've done this now, so have two copies of the log output. Let's compare them using the comparison command I put together a few days back.
$ diff --side-by-side <(sed -e 's/^.*\/\(.*\)/\1/g' <(grep "duckduckgo" esr91-ddg-orig-urls.txt) | sort) \ <(sed -e 's/^.*\/\(.*\)/\1/g' <(grep "cloudfront" esr91-ddg-esr91-urls.txt) | sort) 18040-1287342b1f839f70.js 18040-1287342b1f839f70.js 38407-070351ade350c8e4.js 38407-070351ade350c8e4.js 39337-cd8caeeff0afb1c4.js 39337-cd8caeeff0afb1c4.js 41966-c9d76895b4f9358f.js 41966-c9d76895b4f9358f.js 55015-29fec414530c2cf6.js 55015-29fec414530c2cf6.js 55672-0a2c33e517ba92f5.js 55672-0a2c33e517ba92f5.js 61754-cfebc3ba4c97208e.js 61754-cfebc3ba4c97208e.js 6a4833195509cc3d.css 6a4833195509cc3d.css 703c9a9a057785a9.css 703c9a9a057785a9.css 81125-b74d1b6f4908497b.js 81125-b74d1b6f4908497b.js 93432-ebd443fe69061b19.js 93432-ebd443fe69061b19.js 94623-d5bfa67fc3bada59.js 94623-d5bfa67fc3bada59.js 95665-f2a003aa56f899b0.js 95665-f2a003aa56f899b0.js a2a29f84956f2aac.css a2a29f84956f2aac.css _app-a1aac13e30ca1ed6.js _app-a1aac13e30ca1ed6.js _buildManifest.js _buildManifest.js c89114cfe55133c4.css c89114cfe55133c4.css ed8494aa71104fdc.css ed8494aa71104fdc.css f0b3f7da285c9dbd.css f0b3f7da285c9dbd.css framework-f8115f7fae64930e.js framework-f8115f7fae64930e.js home-34dda07336cb6ee1.js home-34dda07336cb6ee1.js main-17a05b704438cdd6.js main-17a05b704438cdd6.js ProximaNova-Bold-webfont.woff2 ProximaNova-Bold-webfont.woff2 ProximaNova-ExtraBold-webfont.woff2 ProximaNova-ExtraBold-webfont.woff2 ProximaNova-RegIt-webfont.woff2 ProximaNova-RegIt-webfont.woff2 ProximaNova-Reg-webfont.woff2 ProximaNova-Reg-webfont.woff2 ProximaNova-Sbold-webfont.woff2 ProximaNova-Sbold-webfont.woff2 _ssgManifest.js _ssgManifest.js webpack-96503cdd116848e8.js webpack-96503cdd116848e8.jsThe two sets of downloaded files are identical. This is really good, because it means that the ddg9 version of the site is an accurate reflection of what's being served to ESR 91 when Sailfish Browser accesses the real DuckDuckGo site using the ESR 91 engine.
Visiting this copy of the site in other browsers, including ESR 78 and the desktop version of Firefox, shows that the site doesn't render there either.
It's been a long journey to get to this point, but this is clear evidence that the problem is the site being served to ESR 91, rather than the ESR 91 rendering engine or JavaScript interpreter getting stuck after the site has been received.
This means I have to concentrate on persuading DuckDuckGo to serve the same version of the page that it's serving to ESR 78. It's taken far too long to get here, but at least I feel I've learnt something in the process about how to perform these checks, how to download accurate copies of a website and how to serve them using CloudFront so that they don't have to go in a sub-directory.
I've already tried with multiple different user agents and that hasn't been enough to persuade DuckDuckGo to serve the correct version of the page, so I'm not quite sure how to get around this issue. One possibility is that I'm not actually using the user agents I think I am. So this will be something to check tomorrow.
If you'd like to read any of my other gecko diary entries, they're all available on my Gecko-dev Diary page.
14 Jan 2024 : Day 138 #
Finally, after much meandering and misdirected effort, an important reason for my copied version of DuckDuckGo failing became clear yesterday. I admit I'm a bit embarrassed that I didn't spot it earlier, but there's no hiding here.
Simply put, DuckDuckGo uses paths with a preceding / in the site HTML file rather than fully relative URLs. So by placing the files in a "tests/ddg8" folder on my server, I was breaking most of the links.
Now, admittedly, I've not yet had a chance to see what happens when this is fixed, so there could well be other issues as well. But what's for sure is that without fixing this, the copied site will remain broken.
My plan is to make use of the HTML base element to try to work around the issue. This can be added to the head of an HTML file to direct the browser to the root of the site, so that all relative URLs are resolved relative the the base address.
I should also check for URLs that start with https://duckduckgo.com/ or similar as these won't be fixed by this change.
Since the location of my test site is https://www.flypig.co.uk/tests/ddg8/ the addition I need to make is a line inside the head element of the index.html file like this:
So I'm going to have to make more intrusive changes, removing these preceding slashes from all instances of the URL in the page and all files that get loaded with it. I was hoping to avoid that.
There are alternatives to this intrusive fix though. Here are the three alternatives I can think of:
So this is what I've done. I didn't end up spinning up a server but rather copied the files over to an S3 bucket no Amazon Web Services. There's an option to serve static files from an S3 bucket as a website, which is exactly what I need.
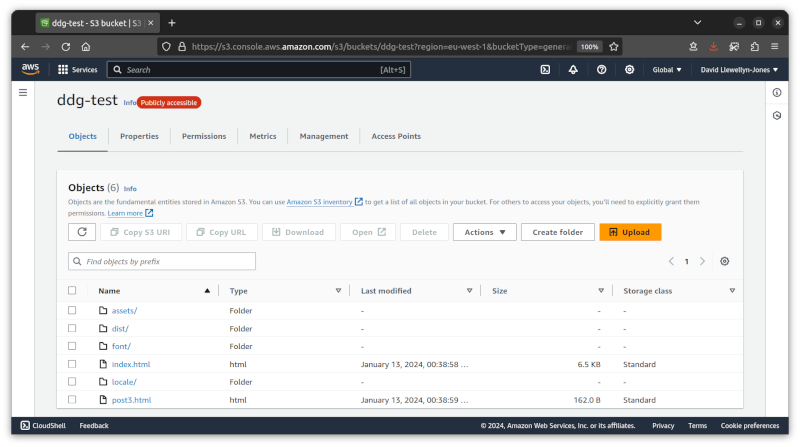
Testing the site using desktop Firefox shows a much better result than before. It's not perfect: there are still some missing images, but the copy I made to the bucket is the mobile version, so that's to be expected. Nevertheless it makes for a pretty reasonable facsimile of the real DuckDuckGo site.
But what about if I try it on mobile?
Using ESR 78 it's uncannily similar to the real DuckDuckGo site. Even the menu on the left hand side works. Search suggestions and search itself are of course both broken, but again this is entirely to be expected since these features require dynamic aspects of the site which can't be replicated using an S3 bucket.
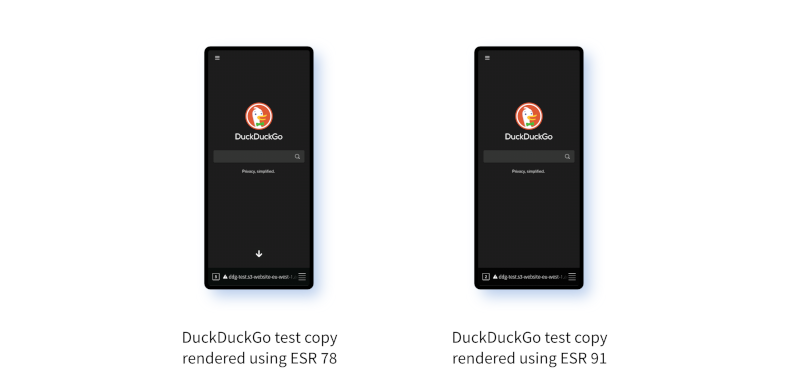
But the real test is ESR 91. When I try it there... I also get a good rendition of the DuckDuckGo site. This is both good and bad. If it had failed to render that would have been ideal, because then I'd immediately have a comparison to work with. But the fact that it works well means I can now compare it with the real version of the site and try to figure out what's different.
It's also worth noting that the results aren't the same. On ESR 78 I can scroll down to view all the "bathroomguy" images telling me how great the site is. On ESR 91 the rendered down arrow is missing and I'm not able to scroll, as you can see in the screenshots if you peer closely.
So, what's the difference? That'll be my task for tomorrow!
This lends more weight to the claim that the problem here DuckDuckGo serving different pages rather than the ESR 91 renderer or JavaScript engine choking on something. I have a plan for how to test this categorically tomorrow.
If you'd like to read any of my other gecko diary entries, they're all available on my Gecko-dev Diary page.
Comment
Simply put, DuckDuckGo uses paths with a preceding / in the site HTML file rather than fully relative URLs. So by placing the files in a "tests/ddg8" folder on my server, I was breaking most of the links.
Now, admittedly, I've not yet had a chance to see what happens when this is fixed, so there could well be other issues as well. But what's for sure is that without fixing this, the copied site will remain broken.
My plan is to make use of the HTML base element to try to work around the issue. This can be added to the head of an HTML file to direct the browser to the root of the site, so that all relative URLs are resolved relative the the base address.
I should also check for URLs that start with https://duckduckgo.com/ or similar as these won't be fixed by this change.
Since the location of my test site is https://www.flypig.co.uk/tests/ddg8/ the addition I need to make is a line inside the head element of the index.html file like this:
<base href="https://www.flypig.co.uk/tests/ddg8/" />On trying this, in practice and contrary to what I'd expected, it turns out that when a URL has a preceding / it's considered an absolute URL as well. The spec wasn't clear on this point for me, but it means it's resolved relative to the domain name, not relative to the base. That's rubbish, but observable behaviour. Rubbish because it means I can't use this as my solution after all.
So I'm going to have to make more intrusive changes, removing these preceding slashes from all instances of the URL in the page and all files that get loaded with it. I was hoping to avoid that.
There are alternatives to this intrusive fix though. Here are the three alternatives I can think of:
- Move the site to the root of the URL. This will get it mixed up with the rest of my site so I'd rather not do that.
- Move it to a completely new URL. This is definitely an option. I could spin up a Cloud server for this pretty easily.
- Configure the server so that it serves the directory from the root URL. The would be cheaper than using a Cloud service.
So this is what I've done. I didn't end up spinning up a server but rather copied the files over to an S3 bucket no Amazon Web Services. There's an option to serve static files from an S3 bucket as a website, which is exactly what I need.

Testing the site using desktop Firefox shows a much better result than before. It's not perfect: there are still some missing images, but the copy I made to the bucket is the mobile version, so that's to be expected. Nevertheless it makes for a pretty reasonable facsimile of the real DuckDuckGo site.
But what about if I try it on mobile?
Using ESR 78 it's uncannily similar to the real DuckDuckGo site. Even the menu on the left hand side works. Search suggestions and search itself are of course both broken, but again this is entirely to be expected since these features require dynamic aspects of the site which can't be replicated using an S3 bucket.
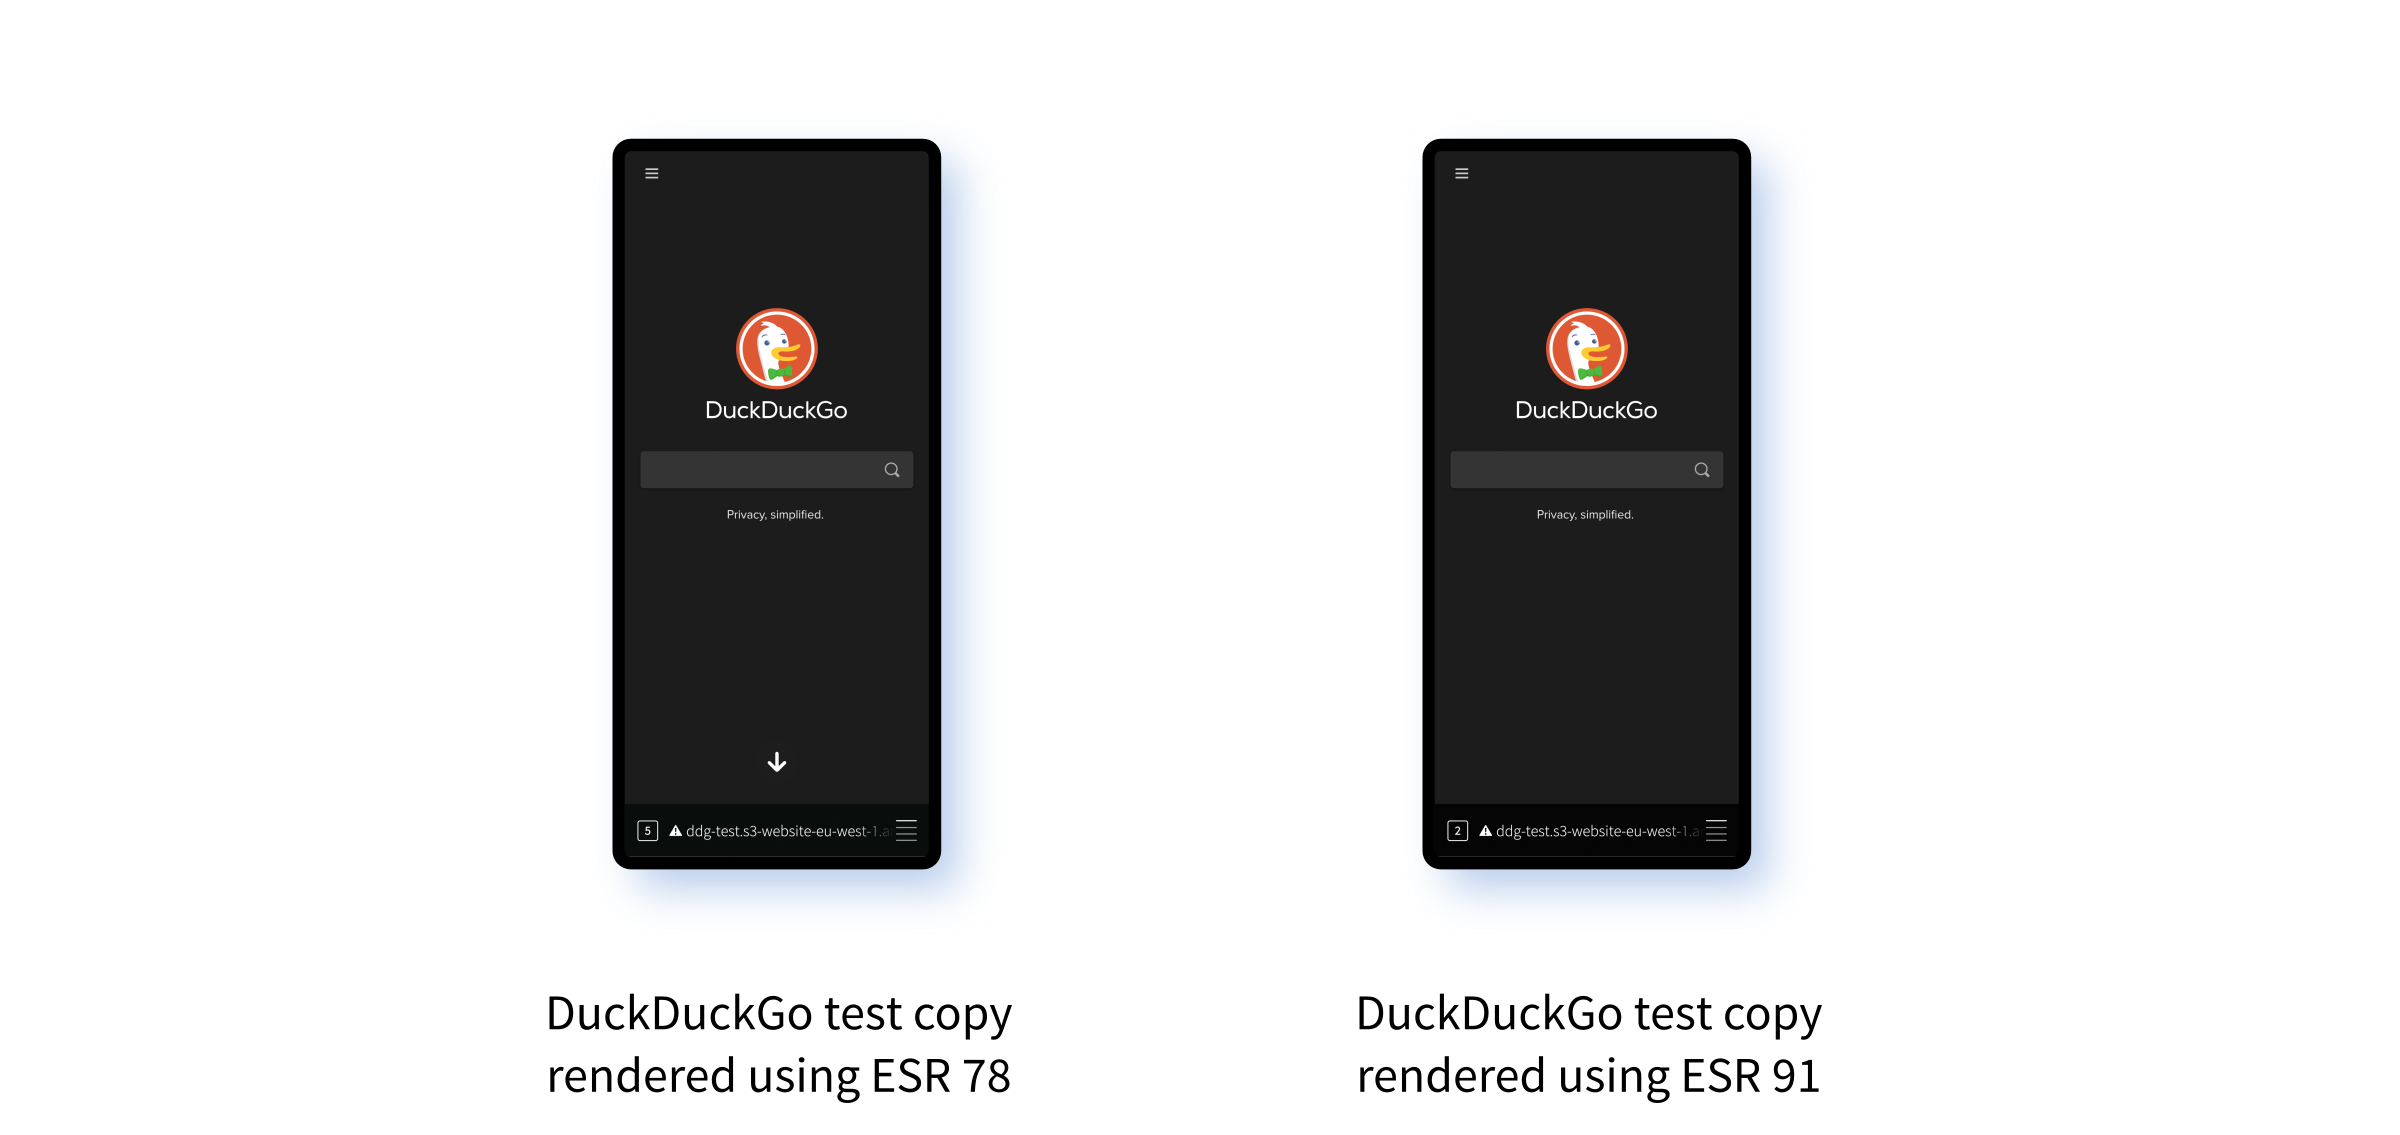
But the real test is ESR 91. When I try it there... I also get a good rendition of the DuckDuckGo site. This is both good and bad. If it had failed to render that would have been ideal, because then I'd immediately have a comparison to work with. But the fact that it works well means I can now compare it with the real version of the site and try to figure out what's different.
It's also worth noting that the results aren't the same. On ESR 78 I can scroll down to view all the "bathroomguy" images telling me how great the site is. On ESR 91 the rendered down arrow is missing and I'm not able to scroll, as you can see in the screenshots if you peer closely.
So, what's the difference? That'll be my task for tomorrow!
This lends more weight to the claim that the problem here DuckDuckGo serving different pages rather than the ESR 91 renderer or JavaScript engine choking on something. I have a plan for how to test this categorically tomorrow.
If you'd like to read any of my other gecko diary entries, they're all available on my Gecko-dev Diary page.
13 Jan 2024 : Day 137 #
I'm still trying to get myself a copy of the DuckDuckGo website. To recap the latest situation, I still want a copy I can serve from my personal server, but which triggers the same errors as when accessing DuckDuckGo from the real website using ESR 91.
I feel confident that yesterday I got myself a full verbatim copy of the site. The catch is that it's woven into the logging output from ESR 91. My task today is to disentangle it.
The log file is 1.3 MiB of data. That's not crazy quantities, but it would work better if the text files used line-wrapping, rather than including massively long lines that seemingly go on for ever... my text editor really doesn't like having to deal with them and just hangs up for tens of minutes at a time.
[...]
Nevertheless, and although it took an age, I have managed to get it all done. The file structure is very similar to the one I showed yesterday:
The result is also the same when viewing the page with either ESR 78 or the desktop browser: just a blank page.
Once again we find ourselves in an unsatisfactory position. But I will persevere and we will get to the bottom of this!
The next step is to check the network output from opening the page in the browser. And there's something important in there! There are many entries that look a bit like this:
If you'd like to read any of my other gecko diary entries, they're all available on my Gecko-dev Diary page.
Comment
I feel confident that yesterday I got myself a full verbatim copy of the site. The catch is that it's woven into the logging output from ESR 91. My task today is to disentangle it.
The log file is 1.3 MiB of data. That's not crazy quantities, but it would work better if the text files used line-wrapping, rather than including massively long lines that seemingly go on for ever... my text editor really doesn't like having to deal with them and just hangs up for tens of minutes at a time.
[...]
Nevertheless, and although it took an age, I have managed to get it all done. The file structure is very similar to the one I showed yesterday:
$ tree ddg8/ ddg8/ ├── assets │ ├── logo_homepage.alt.v109.svg │ ├── logo_homepage.normal.v109.svg │ └── onboarding │ ├── arrow.svg │ └── bathroomguy │ ├── 1-monster-v2--no-animation.svg │ ├── 2-ghost-v2.svg │ ├── 3-bathtub-v2--no-animation.svg │ ├── 4-alpinist-v2.svg │ └── teaser-2@2x.png ├── dist │ ├── b.9e45618547aaad15b744.js │ ├── d.01ff355796b8725c8dad.js │ ├── h.2d6522d4f29f5b108aed.js │ ├── lib │ │ └── l.656ceb337d61e6c36064.js │ ├── o.2988a52fdfb14b7eff16.css │ ├── p.f5b58579149e7488209f.js │ ├── s.b49dcfb5899df4f917ee.css │ ├── ti.b07012e30f6971ff71d3.js │ ├── tl.3db2557c9f124f3ebf92.js │ └── util │ └── u.a3c3a6d4d7bf9244744d.js ├── font │ ├── ProximaNova-ExtraBold-webfont.woff2 │ ├── ProximaNova-Reg-webfont.woff2 │ └── ProximaNova-Sbold-webfont.woff2 ├── index.html ├── locale │ └── en_GB │ └── duckduckgo85.js └── post3.html 9 directories, 24 filesAnd not just that, but in fact the contents are very similar overall:
$ diff -q ddg ddg8/ Only in ddg: 3.html Common subdirectories: ddg/assets and ddg8/assets Common subdirectories: ddg/dist and ddg8/dist Common subdirectories: ddg/font and ddg8/font Files ddg/index.html and ddg8/index.html differ Common subdirectories: ddg/locale and ddg8/locale Only in ddg8/: post3.htmlAlthough the index.html file is quite different to the equivalent one I downloaded earlier, it is similar to a previous one that was downloaded using the python script:
$ diff ddg5/index.html ddg8/index.html 2,7c2,7 < <!--[if IEMobile 7 ]> <html lang="en-US" class="no-js iem7"> <![endif]--> < <!--[if lt IE 7]> <html class="ie6 lt-ie10 lt-ie9 lt-ie8 lt-ie7 no-js" lang="en-US"> <![endif]--> < <!--[if IE 7]> <html class="ie7 lt-ie10 lt-ie9 lt-ie8 no-js" lang="en-US"> <![endif]--> < <!--[if IE 8]> <html class="ie8 lt-ie10 lt-ie9 no-js" lang="en-US"> <![endif]--> < <!--[if IE 9]> <html class="ie9 lt-ie10 no-js" lang="en-US"> <![endif]--> < <!--[if (gte IE 9)|(gt IEMobile 7)|!(IEMobile)|!(IE)]><!--><html class="no-js" lang="en-US" data-ntp-features="tracker-stats-widget:off"><!--<![endif]--> --- > <!--[if IEMobile 7 ]> <html lang="en-GB" class="no-js iem7"> <![endif]--> > <!--[if lt IE 7]> <html class="ie6 lt-ie10 lt-ie9 lt-ie8 lt-ie7 no-js" lang="en-GB"> <![endif]--> > <!--[if IE 7]> <html class="ie7 lt-ie10 lt-ie9 lt-ie8 no-js" lang="en-GB"> <![endif]--> > <!--[if IE 8]> <html class="ie8 lt-ie10 lt-ie9 no-js" lang="en-GB"> <![endif]--> > <!--[if IE 9]> <html class="ie9 lt-ie10 no-js" lang="en-GB"> <![endif]--> > <!--[if (gte IE 9)|(gt IEMobile 7)|!(IEMobile)|!(IE)]><!--><html class="no-js" lang="en-GB" data-ntp-features="tracker-stats-widget:off"><!--<![endif]--> 48,49c48,49 < <title>DuckDuckGo — Privacy, simplified.</title> < <meta property="og:title" content="DuckDuckGo — Privacy, simplified." /> --- > <title>DuckDuckGo â Privacy, simplified.</title> > <meta property="og:title" content="DuckDuckGo â Privacy, simplified." /> 64c64 < <script type="text/javascript" src="/locale/en_US/duckduckgo14.js" onerror="handleScriptError(this)"></script> --- > <script type="text/javascript" src="/locale/en_GB/duckduckgo85.js" onerror="handleScriptError(this)"></script> 107c107 < <!-- en_US All Settings --> --- > <!-- en_GB All Settings --> 146a147,148 > >As you can see, the only real difference is the switch from en-US to en-GB, a one-character difference to the title of the page and the name of the locale file.
The result is also the same when viewing the page with either ESR 78 or the desktop browser: just a blank page.
Once again we find ourselves in an unsatisfactory position. But I will persevere and we will get to the bottom of this!
The next step is to check the network output from opening the page in the browser. And there's something important in there! There are many entries that look a bit like this:
[ Request details ------------------------------------------- ]
Request: GET status: 404 Not Found
URL: https://www.flypig.co.uk/dist/o.2988a52fdfb14b7eff16.css
And now the penny drops: the page is expecting to be in the root of the domain. So while the location it's expecting to find the file is this:
https://www.flypig.co.uk/dist/o.2988a52fdfb14b7eff16.cssI've instead been storing the file in this location:
https://www.flypig.co.uk/tests/ddg8/dist/o.2988a52fdfb14b7eff16.cssChecking inside the index.html file the reason is clear. The paths are being given as absolute paths from the root of the domain, with a preceding slash, like this:
<link rel="stylesheet" href="/dist/o.2988a52fdfb14b7eff16.css" type="text/css">That / in front of the dist is causing all the trouble. It frustrates me that I didn't notice this before. But at least now I have something clear to fix. That'll be my task for tomorrow. Thankfully it should be really easy to fix. I feel a bit silly now.
If you'd like to read any of my other gecko diary entries, they're all available on my Gecko-dev Diary page.
12 Jan 2024 : Day 136 #
Downloading all of the files served by DuckDuckGo individually didn't work: I end up with a site that simply triggers multiple "404 Not Found" errors due to files being requested but not available.
But I'm not giving up on this approach just yet. On the Sailfish Forum attah today made a nice suggestion in relation to this:
There are actually two points here, the first or which relates to DuckDuckGo and the second of which relates to the issue of the build hanging when using more than one process using scratchbox2, part of the Sailfish SDK. Let me leave the compile query to one side for now, because, although it's a good point, I unfortunately don't know the answer (but it sounds like an interesting point to investigate).
Going back to DuckDuckGo, so far I've tried the ESR 78 user agent and the Firefox user agent, but I admit I've not tried anything else. It's a good idea — thank you attah — definitely worth trying. So let's see what happens.
I don't have an iPhone to compare with, but of course there are plenty of places on the Web that claim to list it. I'm going to use this one from the DeviceAtlas blog:
I already have the means to do this, in theory. The EMBED_CONSOLE="network" setting gives a preview of any text files it downloads. But by default that's restricted to showing the first 32 KiB of data. That's not enough for everything and some files get truncated. So I've spent a bit of time improving the output.
First I've increased this value to 32 MiB. In practice I really want it to be set to have no limit, but 32 MiB should be more than enough (and if it isn't it should be obvious and can easily be bumped up). But when I first wrote this component I was always disappointed that the request and response headers could be output at a different time to the document content. That meant that it wasn't always possible to tie the content to the request headers (and in particular, the URL the content was downloaded from).
The reason the two can get separated is that the headers are output as soon as they've been received. And the content is output as soon as it's received in full. But between the headers being output and the content being received it's quite possible for some smaller file to be received in full. In this case, the smaller file would get printed out between the headers and content of the larger file.
My solution has been to store a copy of the URL in the content receiver callback object. That way, the URL can be output at the same time as the content. Now the headers and the content can be tied together since the URL is output with them both.
Here's an example (slightly abridged to keep things manageable):
After downloading the mobile version of DuckDuckGo using the ESR 78 engine and these changes I can see they've made a difference when I compare the previous and newly collected data:
The log file is a bit unwieldy, but it should hopefully contain all the data we need: every bit of textual data that was downloaded. Tomorrow I'll try to disentangle the output and turn them into files again. With a bit of luck, I'll end up with a working copy of the DuckDuckGo site (famous last words!).
If you'd like to read any of my other gecko diary entries, they're all available on my Gecko-dev Diary page.
Comment
But I'm not giving up on this approach just yet. On the Sailfish Forum attah today made a nice suggestion in relation to this:
Finally remembering to post thoughts i have accumulated after the last weeks of following the blog: Have you tried with a wildly different User Agent override for DucDuckGo, like iPhone or something? The hanging parallel compile - could that be related to some syscall that gets used in synchronization, but which is stubbed in sb2?
There are actually two points here, the first or which relates to DuckDuckGo and the second of which relates to the issue of the build hanging when using more than one process using scratchbox2, part of the Sailfish SDK. Let me leave the compile query to one side for now, because, although it's a good point, I unfortunately don't know the answer (but it sounds like an interesting point to investigate).
Going back to DuckDuckGo, so far I've tried the ESR 78 user agent and the Firefox user agent, but I admit I've not tried anything else. It's a good idea — thank you attah — definitely worth trying. So let's see what happens.
I don't have an iPhone to compare with, but of course there are plenty of places on the Web that claim to list it. I'm going to use this one from the DeviceAtlas blog:
Mozilla/5.0 (iPhone12,1; U; CPU iPhone OS 13_0 like Mac OS X) AppleWebKit/602.1.50 (KHTML, like Gecko) Version/10.0 Mobile/15E148 Safari/602.1I used the Python script from yesterday to download the files twice, first using the ESR 78 user agent (stored to the ddg-esr78 directory) and then again using the iPhone user agent above (and stored to the ddg-iphone directory). Each directory contains 34 files and here's what I get when I diff them:
$ find ddg-esr78/ | wc -l 34 $ find ddg-iphone12 | wc -l 34 $ diff --brief ddg-esr78/ ddg-iphone12/ Common subdirectories: ddg-esr78/assets and ddg-iphone12/assets Common subdirectories: ddg-esr78/font and ddg-iphone12/font Common subdirectories: ddg-esr78/ist and ddg-iphone12/ist Common subdirectories: ddg-esr78/locale and ddg-iphone12/localeSo they resulting downloads are identical. That's too bad (although also a little reassuring). It's hard not to conclude that the user agent isn't the important factor here then. Nevertheless, I'm still concerned that I'm not getting the right files when I download using this Python script. If the problem is that DuckDuckGo is recognising a different browser when I download the files with my Python script — even if I've set the User Agent string to match — the the solution will have to be to download the files with the Sailfish Browser itself. It could be another issue entirely, but, well, this is a process of elimination.
I already have the means to do this, in theory. The EMBED_CONSOLE="network" setting gives a preview of any text files it downloads. But by default that's restricted to showing the first 32 KiB of data. That's not enough for everything and some files get truncated. So I've spent a bit of time improving the output.
First I've increased this value to 32 MiB. In practice I really want it to be set to have no limit, but 32 MiB should be more than enough (and if it isn't it should be obvious and can easily be bumped up). But when I first wrote this component I was always disappointed that the request and response headers could be output at a different time to the document content. That meant that it wasn't always possible to tie the content to the request headers (and in particular, the URL the content was downloaded from).
The reason the two can get separated is that the headers are output as soon as they've been received. And the content is output as soon as it's received in full. But between the headers being output and the content being received it's quite possible for some smaller file to be received in full. In this case, the smaller file would get printed out between the headers and content of the larger file.
My solution has been to store a copy of the URL in the content receiver callback object. That way, the URL can be output at the same time as the content. Now the headers and the content can be tied together since the URL is output with them both.
Here's an example (slightly abridged to keep things manageable):
[ Request details ------------------------------------------- ]
Request: GET status: 200 OK
URL: https://duckduckgo.com/dist/p.f5b58579149e7488209f.js
[ Request headers --------------------------------------- ]
Host : duckduckgo.com
User-Agent : Mozilla/5.0 (Mobile; rv:78.0) Gecko/78.0 Firefox/78.0
Accept : */*
Accept-Language : en-GB,en;q=0.5
Accept-Encoding : gzip, deflate, br
Referer : https://duckduckgo.com/
Connection : keep-alive
TE : Trailers
[ Response headers -------------------------------------- ]
server : nginx
date : Wed, 10 Jan 2024 22:27:17 GMT
content-type : application/x-javascript
content-length : 157
last-modified : Fri, 27 Oct 2023 12:03:07 GMT
vary : Accept-Encoding
etag : "653ba6fb-9d"
content-encoding : br
strict-transport-security : max-age=31536000
permissions-policy : interest-cohort=()
content-security-policy : [...] ;
x-frame-options : SAMEORIGIN
x-xss-protection : 1;mode=block
x-content-type-options : nosniff
referrer-policy : origin
expect-ct : max-age=0
expires : Thu, 09 Jan 2025 22:27:17 GMT
cache-control : max-age=31536000
vary : Accept-Encoding
X-Firefox-Spdy : h2
[ Document URL ------------------------------------------ ]
URL: https://duckduckgo.com/dist/p.f5b58579149e7488209f.js
Charset:
ContentType: application/x-javascript
[ Document content -------------------------------------- ]
function post(t){if(t.source===parent&&t.origin===location.protocol+"//"+
location.hostname&&"string"==typeof t.data){var o=t.data.indexOf(":"),
a=t.data.substr(0,o),n=t.data.substr(o+1);"ddg"===a&&(parent.window.
location.href=n)}}window.addEventListener&&window.addEventListener
("message",post,!1);
[ Document content ends --------------------------------- ]
Notice how the actual document content (which is only a few lines of text in this case) is right at the end. But directly beforehand the URL is output, which as a result can now be tied to the URL at the start of the request.After downloading the mobile version of DuckDuckGo using the ESR 78 engine and these changes I can see they've made a difference when I compare the previous and newly collected data:
$ ls -lh ddg-urls-esr78-mobile-*.txt -rw-rw-r-- 1 flypig flypig 2.5K Jan 8 19:04 ddg-urls-esr78-mobile-01.txt -rw-rw-r-- 1 flypig flypig 1.3M Jan 10 22:27 ddg-urls-esr78-mobile-02.txtPreviously 2.5 KiB of data was collected, but with these changes that goes up to 1.3 MiB.
The log file is a bit unwieldy, but it should hopefully contain all the data we need: every bit of textual data that was downloaded. Tomorrow I'll try to disentangle the output and turn them into files again. With a bit of luck, I'll end up with a working copy of the DuckDuckGo site (famous last words!).
If you'd like to read any of my other gecko diary entries, they're all available on my Gecko-dev Diary page.
11 Jan 2024 : Day 135 #
After collecting together and comparing the lists of files downloaded yesterday, today I'm actually downloading those files from the server.
I've created a very simply Python script that will take each line from the output, then reconstruct a local copy of each of the files, using the same relative directory hierarchy. The script is short and simple enough to show here in full.
We'll end up with a directory structure that should match the root directory structure of DuckDuckGo:
That's no guarantee that the server will identify us as that — servers use all sorts of nasty tricks to try to identify misidentified browsers — but it's probably the best we can reasonably do.
Once I've got a local copy of the site structure I copy this over to my server and get the browser to render it.
But unfortunately without success. For reasons I can't figure out, when I attempt to open the page, the browser requests a wholly different set of files to download. And not just different leafnames, but a totally different file structure as well. So rather than it downloading the files I've collected together, I just get a bunch of "404 File Not Found" errors.
Frustrating. But the nature of me writing this up daily is that I can't just summarise all the things that work. As anyone who's been following along will no doubt have noticed by now, often things I try just don't work. But from the comments I've been getting from others, it's reassuring to know it's not just me. Sometimes failure is still progress.
Maybe I'll have better luck with a new approach tomorrow.
If you'd like to read any of my other gecko diary entries, they're all available on my Gecko-dev Diary page.
Comment
I've created a very simply Python script that will take each line from the output, then reconstruct a local copy of each of the files, using the same relative directory hierarchy. The script is short and simple enough to show here in full.
#!/bin/python3
import os
import urllib.request
BASE_DIR = 'ddg'
USER_AGENT = 'Mozilla/5.0 (Android 8.1.0; Mobile; rv:78.0) Gecko/78.0 Firefox/78.8'
def split_url(url):
url = url.rstrip()
path = url.lstrip('https://duckduckgo.com/')
path, leaf = os.path.split(path)
leaf = 'index.html' if not leaf else leaf
path = os.path.join(BASE_DIR, path)
filename = os.path.join(path, leaf)
return path, filename, url
def make_dir(directory):
print('Dir: {}'.format(directory))
os.makedirs(directory, exist_ok=True)
def download_file(url, filename):
print('URL: {}'.format(url))
print('File: {}'.format(filename))
opener = urllib.request.build_opener()
opener.addheaders = [('User-agent', USER_AGENT)]
urllib.request.install_opener(opener)
urllib.request.urlretrieve(url, filename)
with open('download.txt') as fp:
for line in fp:
directory, filepath, url = split_url(line)
make_dir(directory)
download_file(url, filepath)
It really is a very linear process; they don't get much simpler than this. All it does is read in a file line by line. Each line is interpreted as a URL. For example suppose the line was the following:
https://duckduckgo.com/dist/lib/l.656ceb337d61e6c36064.jsThen the file will extract the directory dist/lib/, create a local directory ddg/dist/lib/, then download the file from the URL and save it in the directory with the filename l.656ceb337d61e6c36064.js.
We'll end up with a directory structure that should match the root directory structure of DuckDuckGo:
$ tree ddg
ddg
├── 3.html
├── assets
│ ├── logo_homepage.alt.v109.svg
│ ├── logo_homepage.normal.v109.svg
│ └── onboarding
│ ├── arrow.svg
│ └── bathroomguy
│ ├── 1-monster-v2--no-animation.svg
│ ├── 2-ghost-v2.svg
│ ├── 3-bathtub-v2--no-animation.svg
│ ├── 4-alpinist-v2.svg
│ └── teaser-2@2x.png
├── dist
│ ├── b.9e45618547aaad15b744.js
│ ├── d.01ff355796b8725c8dad.js
│ ├── h.2d6522d4f29f5b108aed.js
│ ├── lib
│ │ └── l.656ceb337d61e6c36064.js
│ ├── o.2988a52fdfb14b7eff16.css
│ ├── p.f5b58579149e7488209f.js
│ ├── s.b49dcfb5899df4f917ee.css
│ ├── ti.b07012e30f6971ff71d3.js
│ ├── tl.3db2557c9f124f3ebf92.js
│ └── util
│ └── u.a3c3a6d4d7bf9244744d.js
├── font
│ ├── ProximaNova-ExtraBold-webfont.woff2
│ ├── ProximaNova-Reg-webfont.woff2
│ └── ProximaNova-Sbold-webfont.woff2
├── index.html
└── locale
└── en_GB
└── duckduckgo85.js
9 directories, 24 files
The intention is that this will make a verbatim copy of all the files that the browser used when rendering the page. Unfortunately servers don't always serve the same file every time, but to try to avoid it serving up the wrong file, I've also set the user agent to be the same as for ESR 78.That's no guarantee that the server will identify us as that — servers use all sorts of nasty tricks to try to identify misidentified browsers — but it's probably the best we can reasonably do.
Once I've got a local copy of the site structure I copy this over to my server and get the browser to render it.
But unfortunately without success. For reasons I can't figure out, when I attempt to open the page, the browser requests a wholly different set of files to download. And not just different leafnames, but a totally different file structure as well. So rather than it downloading the files I've collected together, I just get a bunch of "404 File Not Found" errors.
Frustrating. But the nature of me writing this up daily is that I can't just summarise all the things that work. As anyone who's been following along will no doubt have noticed by now, often things I try just don't work. But from the comments I've been getting from others, it's reassuring to know it's not just me. Sometimes failure is still progress.
Maybe I'll have better luck with a new approach tomorrow.
If you'd like to read any of my other gecko diary entries, they're all available on my Gecko-dev Diary page.
10 Jan 2024 : Day 134 #
I was getting a little despondent trying to fix DuckDuckGo on ESR 91, but the tests I performed yesterday have invigorated me somewhat. It's now clear that there's a decent quantity of accesses being made when using ESR 91 and that wouldn't be happening unless at least some of the data was being interpreted as HTML.
But it's also clear that not everything is as it should be: on ESR 78 there are a mixture of SVG and PNG files being downloaded to provide the images on the page. In contrast, on ESR 91, there are no images being downloaded at all. There are two possible reasons for this I can think of:
First, there are some extraneous accesses in the list that have nothing to do with DuckDuckGo but are a consequence of gecko collecting settings data after the profile was wiped; lines like this:
Second, I noticed that some files appear to be the same but located at different URLs. For example, this can be found in the ERS 78 list:
Third, it then sorts the results alphabetically so that any identical lines in both files will appear in the same order. If there are any matching lines, this will make any diff of the two much cleaner.
Finally the command then performs a side-by-side diff on the result. Here's all of that put together:
Let's concentrate on the mobile version of the page first. Here's the diff:
For completeness let's do the same for the desktop collections:
There might be something in this, but initially I'm more interested in the mobile version of the site and there the overlap is far less. However, now that that I have the URLs, one thing I can do is download all of the files and try to use them to recreate the site on my own server. It's possible this will give better results than saving out the files from the desktop browser, so I'll be giving that a go tomorrow.
If you'd like to read any of my other gecko diary entries, they're all available on my Gecko-dev Diary page.
Comment
But it's also clear that not everything is as it should be: on ESR 78 there are a mixture of SVG and PNG files being downloaded to provide the images on the page. In contrast, on ESR 91, there are no images being downloaded at all. There are two possible reasons for this I can think of:
- DuckDuckGo is serving pages that don't contain any images. Seems unlikely, but nevertheless a possibility.
- There are images but ESR 91 isn't turning them in to access requests. I have no idea why this might happen, yet it still feels the more likely of the two scenarios.
First, there are some extraneous accesses in the list that have nothing to do with DuckDuckGo but are a consequence of gecko collecting settings data after the profile was wiped; lines like this:
https://firefox.settings.services.mozilla.com/v1/buckets/monitor/collections/
changes/records?collection=hijack-blocklists&bucket=main
So the command filters all of the lines that don't include duckduckgo.Second, I noticed that some files appear to be the same but located at different URLs. For example, this can be found in the ERS 78 list:
https://duckduckgo.com/font/ProximaNova-ExtraBold-webfont.woff2While this can be found in the ESR 91 list:
https://duckduckgo.com/static-assets/font/ProximaNova-Reg-webfont.woff2These are both font files; they must surely be the same file, right? But they're located in different folders. So the command then strips the URLs down to the leafnames.
Third, it then sorts the results alphabetically so that any identical lines in both files will appear in the same order. If there are any matching lines, this will make any diff of the two much cleaner.
Finally the command then performs a side-by-side diff on the result. Here's all of that put together:
$ diff --side-by-side \
<(sed -e 's/^.*\/\(.*\)/\1/g' <(grep "duckduckgo" log1.txt) | sort) \
<(sed -e 's/^.*\/\(.*\)/\1/g' <(grep "duckduckgo" log2.txt) | sort)
When I came up with this approach I thought it would give amazing results, but in practice it's not as exciting as I was hoping for.Let's concentrate on the mobile version of the page first. Here's the diff:
$ diff --side-by-side \
<(sed -e 's/^.*\/\(.*\)/\1/g' <(grep "duckduckgo" ddg-urls-esr78-mobile.txt) | sort) \
<(sed -e 's/^.*\/\(.*\)/\1/g' <(grep "duckduckgo" ddg-urls-esr91-mobile.txt) | sort)
1-monster-v2--no-animation.svg | 18040-1287342b1f839f70.js
2-ghost-v2.svg | 38407-070351ade350c8e4.js
3-bathtub-v2--no-animation.svg | 39337-cd8caeeff0afb1c4.js
4-alpinist-v2.svg | 41966-c9d76895b4f9358f.js
arrow.svg | 55015-29fec414530c2cf6.js
b.9e45618547aaad15b744.js | 55672-19856920a309aea5.js
d.01ff355796b8725c8dad.js | 61754-29df12bb83d71c7b.js
duckduckgo85.js | 6a4833195509cc3d.css
h.2d6522d4f29f5b108aed.js | 703c9a9a057785a9.css
hi?7857271&b=firefox&ei=true&i=false&[...] | 81125-b74d1b6f4908497b.js
l.656ceb337d61e6c36064.js | 93432-ebd443fe69061b19.js
logo_homepage.alt.v109.svg | 94623-d5bfa67fc3bada59.js
logo_homepage.normal.v109.svg | 95665-30dd494bea911abd.js
o.2988a52fdfb14b7eff16.css | a2a29f84956f2aac.css
p.f5b58579149e7488209f.js | _app-ce0b94ea69138577.js
post3.html | _buildManifest.js
> c89114cfe55133c4.css
> ed8494aa71104fdc.css
> f0b3f7da285c9dbd.css
> framework-f8115f7fae64930e.js
> home-34dda07336cb6ee1.js
> main-17a05b704438cdd6.js
> ProximaNova-Bold-webfont.woff2
ProximaNova-ExtraBold-webfont.woff2 ProximaNova-ExtraBold-webfont.woff2
> ProximaNova-RegIt-webfont.woff2
ProximaNova-Reg-webfont.woff2 ProximaNova-Reg-webfont.woff2
ProximaNova-Sbold-webfont.woff2 ProximaNova-Sbold-webfont.woff2
s.b49dcfb5899df4f917ee.css | _ssgManifest.js
teaser-2@2x.png | webpack-7358ea7cdec0aecf.js
ti.b07012e30f6971ff71d3.js <
tl.3db2557c9f124f3ebf92.js <
u.a3c3a6d4d7bf9244744d.js <
Only three files are shared across the two collections. The remaining 22 and 27 files respectively are apparently different. I was honestly hoping for there to be more similarity.For completeness let's do the same for the desktop collections:
$ diff --side-by-side \
<(sed -e 's/^.*\/\(.*\)/\1/g' <(grep "duckduckgo" ddg-urls-esr78-desktop.txt) | sort) \
<(sed -e 's/^.*\/\(.*\)/\1/g' <(grep "duckduckgo" ddg-urls-esr91-d.txt) | sort)
18040-1287342b1f839f70.js 18040-1287342b1f839f70.js
38407-070351ade350c8e4.js 38407-070351ade350c8e4.js
39337-cd8caeeff0afb1c4.js 39337-cd8caeeff0afb1c4.js
41966-c9d76895b4f9358f.js 41966-c9d76895b4f9358f.js
48292.8c8d6cb394d25a15.js <
55015-29fec414530c2cf6.js 55015-29fec414530c2cf6.js
55672-19856920a309aea5.js 55672-19856920a309aea5.js
61754-29df12bb83d71c7b.js 61754-29df12bb83d71c7b.js
6a4833195509cc3d.css 6a4833195509cc3d.css
703c9a9a057785a9.css 703c9a9a057785a9.css
81125-b74d1b6f4908497b.js 81125-b74d1b6f4908497b.js
93432-ebd443fe69061b19.js 93432-ebd443fe69061b19.js
94623-d5bfa67fc3bada59.js 94623-d5bfa67fc3bada59.js
95665-30dd494bea911abd.js 95665-30dd494bea911abd.js
a2a29f84956f2aac.css a2a29f84956f2aac.css
add-firefox.f0890a6c.svg <
_app-ce0b94ea69138577.js _app-ce0b94ea69138577.js
app-protection-back-dark.png <
app-protection-front-dark.png <
app-protection-ios-dark.png <
app-store.501fe17a.png <
atb_home_impression?9836955&b=firefox[...] <
_buildManifest.js _buildManifest.js
burn@2x.be0bd36d.png <
c89114cfe55133c4.css c89114cfe55133c4.css
chrome-lg.a4859fb2.png <
CNET-DARK.e3fd496e.png <
dark-mode@2x.3e150d01.png <
devices-dark.png <
ed8494aa71104fdc.css ed8494aa71104fdc.css
edge-lg.36af7682.png <
email-protection-back-dark.png <
email-protection-front-light.png <
email-protection-ios-dark.png <
f0b3f7da285c9dbd.css f0b3f7da285c9dbd.css
firefox-lg.8efad702.png <
flame.1241f020.png <
flame@2x.40e1cfa0.png <
flame-narrow.70589b7c.png <
framework-f8115f7fae64930e.js framework-f8115f7fae64930e.js
home-34dda07336cb6ee1.js home-34dda07336cb6ee1.js
legacy-homepage-btf-dark.png <
legacy-homepage-btf-mobile-dark.png <
macos.61889438.png <
main-17a05b704438cdd6.js main-17a05b704438cdd6.js
night@2x.4ca79636.png <
opera-lg.237c4418.png <
page_home_commonImpression?2448534&[...] <
play-store.e5d5ed36.png <
ProximaNova-Bold-webfont.woff2 ProximaNova-Bold-webfont.woff2
ProximaNova-ExtraBold-webfont.woff2 ProximaNova-ExtraBold-webfont.woff2
ProximaNova-RegIt-webfont.woff2 ProximaNova-RegIt-webfont.woff2
ProximaNova-Reg-webfont.woff2 ProximaNova-Reg-webfont.woff2
ProximaNova-Sbold-webfont.woff2 ProximaNova-Sbold-webfont.woff2
safari-lg.8406694a.png <
search-protection-back-light.png <
search-protection-front-dark.png <
search-protection-ios-dark.png <
set-as-default.d95c3465.svg <
_ssgManifest.js _ssgManifest.js
UT-DARK-DEFAULT.6cd0020d.png <
VERGE-DARK-DEFAULT.8850a2d2.png <
webpack-7358ea7cdec0aecf.js webpack-7358ea7cdec0aecf.js
web-protection-back-dark.png <
web-protection-front-dark.png <
web-protection-ios-dark.png <
widget-big@2x.a260ccf6.png <
widget-small@2x.07c865df.png <
windows.477fa143.png <
WIRED-DARK-DEFAULT.b4d48a49.png <
Here we see something more interesting. There are 30 files the same across the two collections with 43 and 0 files being different respectively. In other words, the ESR 91 collection is a subset of the ESR 78 collection.There might be something in this, but initially I'm more interested in the mobile version of the site and there the overlap is far less. However, now that that I have the URLs, one thing I can do is download all of the files and try to use them to recreate the site on my own server. It's possible this will give better results than saving out the files from the desktop browser, so I'll be giving that a go tomorrow.
If you'd like to read any of my other gecko diary entries, they're all available on my Gecko-dev Diary page.
9 Jan 2024 : Day 133 #
It's time to pick up from where we left off yesterday, hanging on a couple of breakpoints on two different phones, one running ESR 78 and the other running ESR 91.
It feels weird leaving the phones in this state of limbo overnight. Astonishingly, even though I put my laptop to sleep, the SSH connections weren't dropped. Returning to discover things in exactly the same state I left them in is disconcerting. But in a good way.
Before I get on to the next steps I also want to take the time to acknowledge the help of TrickyPR who sent this helpful message via Mastodon:
This is really helpful. I've not had a chance to look into the remote debugging (I think it'll be something for the weekend) so please bear with me, but it looks like this info will definitely make for reference material.
To recap, yesterday we were stepping through nsDisplayBackgroundImage::AppendBackgroundItemsToTop() because we know that on ESR 78 we eventually reach a call to nsDisplayBackgroundImage::GetInitData(), whereas on ESR 91 this method is never called. The two versions of AppendBackgroundItemsToTop() have changed between ESR 78 and ESR 91, but they're close enough to be able to follow them both side-by-side.
But stepping through didn't work as well as I'd hoped because for the first time the breakpoint is hit on both devices, the method returns early in both cases. The AppendBackgroundItemsToTop() method gets called multiple times during a render, so it's not surprising that in some cases it returns early and in others it goes all the way through to GetInitData(). I need a call on ESR 78 that goes all the way to GetInitData() and — and here's the tricky bit — I need the same call on ESR 91 that returns early.
To get closer to this situation I'm going to move the breakpoints closer to the call to GetInitData() on both systems.
Here's the relevant bit of code, which is pretty similar on both ESR 78 and ESR 91, but this copy happens to come from ESR 91:
The following line is the last statement before the loop around the image layers is entered.
However, if I leave the breakpoint on the start of the condition I notice that during rendering the breakpoint is hit precisely four times on ESR 91.
In contrast, when rendering the page on ESR 78 the breakpoint is hit 108 times. That's a red flag, because it really suggests that there are a lot of background images being rendered on ESR 78, and almost no attempt to even render backgrounds on ESR 91.
What's more, on ESR 91, even though we can't place a breakpoint on the return lines, we can infer the value that's being returned by looking at the values of the variables going in to the condition. Here's the condition again on ESR 91 for reference:
The method will then return with a value of AppendedBackgroundType::None.
In contrast we know that on ESR 78 execution gets beyond this condition in order to actually render background images, just as we would expect for any relatively complex page.
Given all of the above it looks to me very much like the problem isn't happening in the render loop. Rendering is happening, there just isn't anything to render. There could be multiple reasons for this. One possibility is that the page is being received but somehow lost or dropped. The other is that the page isn't being sent in full. It could be JavaScript related.
To return to something discussed earlier, this behaviour distinguishes the problem from the issue we experience with Amazon on ESR 78. In that case, rendering most definitely occurs because we briefly see a copy of the page. The page visibly disappears in front of our eyes. In that case we'd expect there to be many breakpoint hits with rendering of multiple background images all prior to the page disappearing.
To make more sense of what's going on I need to go back down to the other end of the stack: the networking end. I realised after some thought that the experiments I ran earlier with EMBED_CONSOLE="network" set were not very effective. What I really want is a list of all the network access requests made from the browser in order to understand where the problem is happening. For example, are there any images being downloaded?
The last time I did this there weren't any images downloaded, but in retrospect that might have been because they were being cached. I should do this more robustly, and because I'm really only interested in the URLs, I can filter out all of the other details to make my life easier.
There are two reasons for doing this. First to compare with the URLs accessed using ESR 78, which is something I also failed to do previously. Second because if I have all the URLs, that might also help me piece together a full version of the page without all of the mysterious transformations that happen when I save the page manually from the desktop browser.
So to kick things off, here are all of the URLs accessed for ESR 78 when requesting the mobile version of the site. Note that the first thing I do is delete the profile entirely. That's to avoid anything being cached.
Mobile version of the site on ESR 78
It's also worth noting that some of the requests are to Mozilla servers rather than DuckDuckGo servers. I suspect that's a consequence of having wiped the profile: the browser is making accesses to retrieve some of the data that I deleted. We should ignore those requests.
Next up the desktop version of the same site. These were generated by selecting the "Desktop Mode" button in the browser immediately after downloading the mobile site. Consequently it's possible some data was cached.
Desktop version of the site on ESR 78
So now using ESR 91, here are the URLs accessed with an empty profile and the mobile version of the site.
Mobile version of the site on ESR 91
Desktop version of the site on ESR 91
If you'd like to read any of my other gecko diary entries, they're all available on my Gecko-dev Diary page.
Comment
It feels weird leaving the phones in this state of limbo overnight. Astonishingly, even though I put my laptop to sleep, the SSH connections weren't dropped. Returning to discover things in exactly the same state I left them in is disconcerting. But in a good way.
Before I get on to the next steps I also want to take the time to acknowledge the help of TrickyPR who sent this helpful message via Mastodon:
my knowledge of the fancy debugger is a lot more modern, but here are some tips. For the server:
- make sure you are building devtools/ (you probably already are)
- you can launch the devtools server through js: https://github.com/ajvincent/motherhen/blob/main/cleanroom/source/modules/DevtoolsServer.jsm
- you will have better luck with about:debugging on a similar version browser
- you need to set MOZ_DEVTOOLS to all
- you will need to implement a command line handler for -chrome (you can steal this, but it’s esm (needs esr +100?): https://github.com/ajvincent/motherhen/pull/34 ) Feel free to ping if you want clarification or get stuck.
This is really helpful. I've not had a chance to look into the remote debugging (I think it'll be something for the weekend) so please bear with me, but it looks like this info will definitely make for reference material.
To recap, yesterday we were stepping through nsDisplayBackgroundImage::AppendBackgroundItemsToTop() because we know that on ESR 78 we eventually reach a call to nsDisplayBackgroundImage::GetInitData(), whereas on ESR 91 this method is never called. The two versions of AppendBackgroundItemsToTop() have changed between ESR 78 and ESR 91, but they're close enough to be able to follow them both side-by-side.
But stepping through didn't work as well as I'd hoped because for the first time the breakpoint is hit on both devices, the method returns early in both cases. The AppendBackgroundItemsToTop() method gets called multiple times during a render, so it's not surprising that in some cases it returns early and in others it goes all the way through to GetInitData(). I need a call on ESR 78 that goes all the way to GetInitData() and — and here's the tricky bit — I need the same call on ESR 91 that returns early.
To get closer to this situation I'm going to move the breakpoints closer to the call to GetInitData() on both systems.
Here's the relevant bit of code, which is pretty similar on both ESR 78 and ESR 91, but this copy happens to come from ESR 91:
if (!bg || !drawBackgroundImage) {
if (!bgItemList.IsEmpty()) {
aList->AppendToTop(&bgItemList);
return AppendedBackgroundType::Background;
}
return AppendedBackgroundType::None;
}
const ActiveScrolledRoot* asr = aBuilder->CurrentActiveScrolledRoot();
bool needBlendContainer = false;
// Passing bg == nullptr in this macro will result in one iteration with
// i = 0.
NS_FOR_VISIBLE_IMAGE_LAYERS_BACK_TO_FRONT(i, bg->mImage) {
if (bg->mImage.mLayers[i].mImage.IsNone()) {
continue;
}
[...]
nsDisplayList thisItemList;
nsDisplayBackgroundImage::InitData bgData =
nsDisplayBackgroundImage::GetInitData(aBuilder, aFrame, i, bgOriginRect,
bgSC);
I've chopped a bit out, but there's no way for the method to return in the part I've removed, so the bits shown here are the important pieces for our purposes today.The following line is the last statement before the loop around the image layers is entered.
bool needBlendContainer = false;If I place a breakpoint on this line, on ESR 91 the breakpoint remains untouched:
(gdb) info break
Num Type Disp Enb Address What
1 breakpoint keep n 0x0000007fbc3511d4 in nsDisplayBackgroundImage::
GetInitData(nsDisplayListBuilder*, nsIFrame*, unsigned short,
nsRect const&, mozilla::ComputedStyle*)
at layout/painting/nsDisplayList.cpp:3409
2 breakpoint keep y 0x0000007fbc3a8730 in nsDisplayBackgroundImage::
AppendBackgroundItemsToTop(nsDisplayListBuilder*, nsIFrame*,
nsRect const&, nsDisplayList*, bool, mozilla::ComputedStyle*,
nsRect const&, nsIFrame*,
mozilla::Maybe<nsDisplayListBuilder::AutoBuildingDisplayList>*)
at layout/painting/nsDisplayList.cpp:3632
breakpoint already hit 2 times
(gdb) handle SIGPIPE nostop
Signal Stop Print Pass to program Description
SIGPIPE No Yes Yes Broken pipe
(gdb) disable break 2
(gdb) break nsDisplayList.cpp:3766
Breakpoint 3 at 0x7fbc3a9344: file layout/painting/nsDisplayList.cpp, line 3766.
(gdb) c
[...]
So the method must be being exited — in all cases — before this line occurs. From my recollection of stepping through the method earlier I'm pretty sure we reached this condition:
if (!bg || !drawBackgroundImage) {
So I'll put a breakpoint there and try again.
(gdb) disable break 3
(gdb) break nsDisplayList.cpp:3755
Breakpoint 4 at 0x7fbc3a8dac: file layout/painting/nsDisplayList.cpp, line 3755.
(gdb) c
Continuing.
[New LWP 28203]
[LWP 27764 exited]
[LWP 28203 exited]
[Switching to LWP 31016]
Thread 10 "GeckoWorkerThre" hit Breakpoint 4, nsDisplayBackgroundImage::
AppendBackgroundItemsToTop (aBuilder=0x7f9efa2378, aFrame=0x7f803c9eb8,
aBackgroundRect=..., aList=0x7f9ef9ff08, aAllowWillPaintBorderOptimization=
<optimized out>, aComputedStyle=<optimized out>, aBackgroundOriginRect=...,
aSecondaryReferenceFrame=0x0, aAutoBuildingDisplayList=0x0)
at layout/painting/nsDisplayList.cpp:3755
3755 if (!bg || !drawBackgroundImage) {
(gdb)
Now it hits. Let's try putting some breakpoints on the return calls.
(gdb) disable break 4 (gdb) break nsDisplayList.cpp:3758 Note: breakpoint 3 (disabled) also set at pc 0x7fbc3a9344. Breakpoint 5 at 0x7fbc3a9344: file layout/painting/nsDisplayList.cpp, line 3766. (gdb) break nsDisplayList.cpp:3761 Note: breakpoints 3 (disabled) and 5 also set at pc 0x7fbc3a9344. Breakpoint 6 at 0x7fbc3a9344: file layout/painting/nsDisplayList.cpp, line 3766. (gdb)That's not helpful: the debugger won't let me place a breakpoint on either of these lines, presumably because after compilation to machine code it's no longer possible to distinguish between the lines properly.
However, if I leave the breakpoint on the start of the condition I notice that during rendering the breakpoint is hit precisely four times on ESR 91.
In contrast, when rendering the page on ESR 78 the breakpoint is hit 108 times. That's a red flag, because it really suggests that there are a lot of background images being rendered on ESR 78, and almost no attempt to even render backgrounds on ESR 91.
What's more, on ESR 91, even though we can't place a breakpoint on the return lines, we can infer the value that's being returned by looking at the values of the variables going in to the condition. Here's the condition again on ESR 91 for reference:
if (!bg || !drawBackgroundImage) {
if (!bgItemList.IsEmpty()) {
aList->AppendToTop(&bgItemList);
return AppendedBackgroundType::Background;
}
return AppendedBackgroundType::None;
}
And here are the values the debugger will give us access to:
Thread 10 "GeckoWorkerThre" hit Breakpoint 9, nsDisplayBackgroundImage::
AppendBackgroundItemsToTop (aBuilder=0x7f9efa2378, aFrame=0x7f80b5fa48,
aBackgroundRect=..., aList=0x7f9ef9ff08, aAllowWillPaintBorderOptimization=
<optimized out>, aComputedStyle=<optimized out>, aBackgroundOriginRect=...,
aSecondaryReferenceFrame=0x0, aAutoBuildingDisplayList=0x0)
at layout/painting/nsDisplayList.cpp:3755
3755 if (!bg || !drawBackgroundImage) {
(gdb) p bg
$8 = <optimized out>
(gdb) p drawBackgroundImage
$9 = false
(gdb) p bgItemList.mLength
$19 = 0
(gdb) c
Continuing.
I get the same results for all four cases and working through the logic, if drawBackgroundImage is set to false then !drawBackgroundImage will be set to true, hence (!bg || !drawBackgroundImage) will be set to true, hence the condition will be entered into. At that point we know that bgItemList has no members and so will be empty, so the nested condition won't be entered.The method will then return with a value of AppendedBackgroundType::None.
In contrast we know that on ESR 78 execution gets beyond this condition in order to actually render background images, just as we would expect for any relatively complex page.
Given all of the above it looks to me very much like the problem isn't happening in the render loop. Rendering is happening, there just isn't anything to render. There could be multiple reasons for this. One possibility is that the page is being received but somehow lost or dropped. The other is that the page isn't being sent in full. It could be JavaScript related.
To return to something discussed earlier, this behaviour distinguishes the problem from the issue we experience with Amazon on ESR 78. In that case, rendering most definitely occurs because we briefly see a copy of the page. The page visibly disappears in front of our eyes. In that case we'd expect there to be many breakpoint hits with rendering of multiple background images all prior to the page disappearing.
To make more sense of what's going on I need to go back down to the other end of the stack: the networking end. I realised after some thought that the experiments I ran earlier with EMBED_CONSOLE="network" set were not very effective. What I really want is a list of all the network access requests made from the browser in order to understand where the problem is happening. For example, are there any images being downloaded?
The last time I did this there weren't any images downloaded, but in retrospect that might have been because they were being cached. I should do this more robustly, and because I'm really only interested in the URLs, I can filter out all of the other details to make my life easier.
There are two reasons for doing this. First to compare with the URLs accessed using ESR 78, which is something I also failed to do previously. Second because if I have all the URLs, that might also help me piece together a full version of the page without all of the mysterious transformations that happen when I save the page manually from the desktop browser.
So to kick things off, here are all of the URLs accessed for ESR 78 when requesting the mobile version of the site. Note that the first thing I do is delete the profile entirely. That's to avoid anything being cached.
Mobile version of the site on ESR 78
$ rm -rf ~/.local/share/org.sailfishos/browser
$ EMBED_CONSOLE="network" sailfish-browser https://duckduckgo.com/ 2>&1 | grep "URL: "
URL: https://duckduckgo.com/
URL: https://duckduckgo.com/dist/s.b49dcfb5899df4f917ee.css
URL: https://duckduckgo.com/dist/o.2988a52fdfb14b7eff16.css
URL: https://duckduckgo.com/dist/tl.3db2557c9f124f3ebf92.js
URL: https://duckduckgo.com/dist/b.9e45618547aaad15b744.js
URL: https://duckduckgo.com/dist/lib/l.656ceb337d61e6c36064.js
URL: https://firefox.settings.services.mozilla.com/v1/buckets/monitor/
collections/changes/records?collection=hijack-blocklists&bucket=main
URL: https://duckduckgo.com/locale/en_GB/duckduckgo85.js
URL: https://firefox.settings.services.mozilla.com/v1/buckets/monitor/
collections/changes/records?collection=anti-tracking-url-decoration&bucket=main
URL: https://firefox.settings.services.mozilla.com/v1/buckets/monitor/
collections/changes/records?collection=url-classifier-skip-urls&bucket=main
URL: https://duckduckgo.com/dist/util/u.a3c3a6d4d7bf9244744d.js
URL: https://duckduckgo.com/dist/d.01ff355796b8725c8dad.js
URL: https://firefox.settings.services.mozilla.com/v1/buckets/main/
collections/hijack-blocklists/changeset?_expected=1605801189258
URL: https://firefox.settings.services.mozilla.com/v1/buckets/main/
collections/url-classifier-skip-urls/changeset?_expected=1701090424142
URL: https://firefox.settings.services.mozilla.com/v1/buckets/main/
collections/anti-tracking-url-decoration/changeset?_expected=1564511755134
URL: https://duckduckgo.com/dist/h.2d6522d4f29f5b108aed.js
URL: https://duckduckgo.com/dist/ti.b07012e30f6971ff71d3.js
URL: https://duckduckgo.com/font/ProximaNova-Reg-webfont.woff2
URL: https://content-signature-2.cdn.mozilla.net/chains/
remote-settings.content-signature.mozilla.org-2024-02-08-20-06-04.chain
URL: https://duckduckgo.com/post3.html
URL: https://duckduckgo.com/assets/logo_homepage.normal.v109.svg
URL: https://duckduckgo.com/font/ProximaNova-Sbold-webfont.woff2
URL: https://duckduckgo.com/assets/onboarding/bathroomguy/teaser-2@2x.png
URL: https://duckduckgo.com/assets/onboarding/arrow.svg
URL: https://duckduckgo.com/assets/logo_homepage.alt.v109.svg
URL: https://duckduckgo.com/font/ProximaNova-ExtraBold-webfont.woff2
URL: https://duckduckgo.com/assets/onboarding/bathroomguy/
1-monster-v2--no-animation.svg
URL: https://duckduckgo.com/assets/onboarding/bathroomguy/2-ghost-v2.svg
URL: https://duckduckgo.com/assets/onboarding/bathroomguy/
3-bathtub-v2--no-animation.svg
URL: https://duckduckgo.com/assets/onboarding/bathroomguy/4-alpinist-v2.svg
URL: https://duckduckgo.com/dist/p.f5b58579149e7488209f.js
URL: https://improving.duckduckgo.com/t/hi?7857271&b=firefox&ei=true&i=false&
d=m&l=en-GB&p=other&pre_atb=v411-5&ax=false&ak=false&pre_va=_&pre_atbva=_
Now that's a lot more accesses than I had last time, which is a good sign. That's 32 URL accesses in total. Interestingly all bar one of the images are SVG format: all vector apart from a single bitmap.It's also worth noting that some of the requests are to Mozilla servers rather than DuckDuckGo servers. I suspect that's a consequence of having wiped the profile: the browser is making accesses to retrieve some of the data that I deleted. We should ignore those requests.
Next up the desktop version of the same site. These were generated by selecting the "Desktop Mode" button in the browser immediately after downloading the mobile site. Consequently it's possible some data was cached.
Desktop version of the site on ESR 78
URL: https://duckduckgo.com/
URL: https://duckduckgo.com/_next/static/css/c89114cfe55133c4.css
URL: https://duckduckgo.com/_next/static/css/6a4833195509cc3d.css
URL: https://duckduckgo.com/_next/static/css/a2a29f84956f2aac.css
URL: https://duckduckgo.com/_next/static/css/f0b3f7da285c9dbd.css
URL: https://duckduckgo.com/_next/static/css/ed8494aa71104fdc.css
URL: https://duckduckgo.com/_next/static/css/703c9a9a057785a9.css
URL: https://duckduckgo.com/_next/static/chunks/webpack-7358ea7cdec0aecf.js
URL: https://duckduckgo.com/_next/static/chunks/framework-f8115f7fae64930e.js
URL: https://duckduckgo.com/_next/static/chunks/main-17a05b704438cdd6.js
URL: https://duckduckgo.com/_next/static/chunks/pages/_app-ce0b94ea69138577.js
URL: https://duckduckgo.com/_next/static/chunks/41966-c9d76895b4f9358f.js
URL: https://duckduckgo.com/_next/static/chunks/93432-ebd443fe69061b19.js
URL: https://duckduckgo.com/_next/static/chunks/18040-1287342b1f839f70.js
URL: https://duckduckgo.com/_next/static/chunks/81125-b74d1b6f4908497b.js
URL: https://duckduckgo.com/_next/static/chunks/39337-cd8caeeff0afb1c4.js
URL: https://duckduckgo.com/_next/static/chunks/94623-d5bfa67fc3bada59.js
URL: https://duckduckgo.com/_next/static/chunks/95665-30dd494bea911abd.js
URL: https://duckduckgo.com/_next/static/chunks/55015-29fec414530c2cf6.js
URL: https://duckduckgo.com/_next/static/chunks/61754-29df12bb83d71c7b.js
URL: https://duckduckgo.com/_next/static/chunks/55672-19856920a309aea5.js
URL: https://duckduckgo.com/_next/static/chunks/38407-070351ade350c8e4.js
URL: https://duckduckgo.com/_next/static/chunks/pages/%5Blocale%5D/
home-34dda07336cb6ee1.js
URL: https://duckduckgo.com/_next/static/ZNJGkb3SCV-nLlzz3kvNx/_buildManifest.js
URL: https://duckduckgo.com/_next/static/ZNJGkb3SCV-nLlzz3kvNx/_ssgManifest.js
URL: https://improving.duckduckgo.com/t/page_home_commonImpression?2448534&
b=firefox&d=d&l=en-GB&p=linux&atb=v411-5&pre_va=_&pre_atbva=_&atbi=true&
i=false&ak=false&ax=false
URL: https://duckduckgo.com/_next/static/media/set-as-default.d95c3465.svg
URL: https://duckduckgo.com/static-assets/image/pages/legacy-home/
devices-dark.png
URL: https://duckduckgo.com/static-assets/backgrounds/
legacy-homepage-btf-mobile-dark.png
URL: https://duckduckgo.com/_next/static/media/macos.61889438.png
URL: https://duckduckgo.com/_next/static/media/windows.477fa143.png
URL: https://duckduckgo.com/_next/static/media/app-store.501fe17a.png
URL: https://duckduckgo.com/_next/static/media/play-store.e5d5ed36.png
URL: https://duckduckgo.com/_next/static/media/chrome-lg.a4859fb2.png
URL: https://duckduckgo.com/_next/static/media/edge-lg.36af7682.png
URL: https://duckduckgo.com/_next/static/media/firefox-lg.8efad702.png
URL: https://duckduckgo.com/_next/static/media/opera-lg.237c4418.png
URL: https://duckduckgo.com/_next/static/media/safari-lg.8406694a.png
URL: https://duckduckgo.com/_next/static/chunks/48292.8c8d6cb394d25a15.js
URL: https://duckduckgo.com/static-assets/backgrounds/legacy-homepage-btf-dark.png
URL: https://duckduckgo.com/static-assets/font/ProximaNova-Reg-webfont.woff2
URL: https://duckduckgo.com/static-assets/font/ProximaNova-ExtraBold-webfont.woff2
URL: https://duckduckgo.com/static-assets/font/ProximaNova-Bold-webfont.woff2
URL: https://duckduckgo.com/static-assets/font/ProximaNova-Sbold-webfont.woff2
URL: https://duckduckgo.com/static-assets/font/ProximaNova-RegIt-webfont.woff2
URL: https://duckduckgo.com/static-assets/image/pages/home/devices/how-it-works/
desktop/search-protection-back-light.png
URL: https://duckduckgo.com/static-assets/image/pages/home/devices/how-it-works/
desktop/search-protection-front-dark.png
URL: https://duckduckgo.com/_next/static/media/flame.1241f020.png
URL: https://duckduckgo.com/_next/static/media/burn@2x.be0bd36d.png
URL: https://duckduckgo.com/_next/static/media/flame@2x.40e1cfa0.png
URL: https://duckduckgo.com/_next/static/media/widget-big@2x.a260ccf6.png
URL: https://duckduckgo.com/_next/static/media/night@2x.4ca79636.png
URL: https://duckduckgo.com/_next/static/media/dark-mode@2x.3e150d01.png
URL: https://duckduckgo.com/static-assets/image/pages/home/devices/how-it-works/
desktop/email-protection-front-light.png
URL: https://duckduckgo.com/static-assets/image/pages/home/devices/how-it-works/
desktop/app-protection-back-dark.png
URL: https://duckduckgo.com/static-assets/image/pages/home/devices/how-it-works/
desktop/app-protection-front-dark.png
URL: https://duckduckgo.com/_next/static/media/flame-narrow.70589b7c.png
URL: https://duckduckgo.com/_next/static/media/widget-small@2x.07c865df.png
URL: https://duckduckgo.com/static-assets/image/pages/home/devices/how-it-works/
search-protection-ios-dark.png
URL: https://duckduckgo.com/static-assets/image/pages/home/devices/how-it-works/
web-protection-ios-dark.png
URL: https://duckduckgo.com/static-assets/image/pages/home/devices/how-it-works/
email-protection-ios-dark.png
URL: https://duckduckgo.com/static-assets/image/pages/home/devices/how-it-works/
desktop/web-protection-back-dark.png
URL: https://duckduckgo.com/static-assets/image/pages/home/devices/how-it-works/
desktop/web-protection-front-dark.png
URL: https://duckduckgo.com/static-assets/image/pages/home/devices/how-it-works/
desktop/email-protection-back-dark.png
URL: https://duckduckgo.com/static-assets/image/pages/home/devices/how-it-works/
app-protection-ios-dark.png
URL: https://duckduckgo.com/_next/static/media/add-firefox.f0890a6c.svg
URL: https://duckduckgo.com/_next/static/media/WIRED-DARK-DEFAULT.b4d48a49.png
URL: https://duckduckgo.com/_next/static/media/VERGE-DARK-DEFAULT.8850a2d2.png
URL: https://duckduckgo.com/_next/static/media/UT-DARK-DEFAULT.6cd0020d.png
URL: https://duckduckgo.com/_next/static/media/CNET-DARK.e3fd496e.png
URL: https://improving.duckduckgo.com/t/atb_home_impression?9836955&b=firefox&
d=d&l=en-GB&p=linux&atb=v411-5&pre_va=_&pre_atbva=_&atbi=true&i=false&
ak=false&ax=false
The desktop version generates many more access requests, 71 in total, including a large number of PNG files (I count 36 in total). These are the results for ESR 78, so that's a working copy of the site. On the face of it there shouldn't be any reason for ESR 91 to be served anything different to this.So now using ESR 91, here are the URLs accessed with an empty profile and the mobile version of the site.
Mobile version of the site on ESR 91
$ rm -rf ~/.local/share/org.sailfishos/browser
$ EMBED_CONSOLE="network" sailfish-browser https://duckduckgo.com/ 2>&1 | grep "URL: "
URL: http://detectportal.firefox.com/success.txt?ipv4
URL: https://duckduckgo.com/
URL: https://location.services.mozilla.com/v1/country?key=no-mozilla-api-key
URL: https://duckduckgo.com/static-assets/font/ProximaNova-RegIt-webfont.woff2
URL: https://duckduckgo.com/static-assets/font/ProximaNova-ExtraBold-webfont.woff2
URL: https://duckduckgo.com/static-assets/font/ProximaNova-Reg-webfont.woff2
URL: https://duckduckgo.com/static-assets/font/ProximaNova-Sbold-webfont.woff2
URL: https://duckduckgo.com/static-assets/font/ProximaNova-Bold-webfont.woff2
URL: https://duckduckgo.com/_next/static/css/c89114cfe55133c4.css
URL: https://duckduckgo.com/_next/static/css/6a4833195509cc3d.css
URL: https://duckduckgo.com/_next/static/css/a2a29f84956f2aac.css
URL: https://duckduckgo.com/_next/static/css/f0b3f7da285c9dbd.css
URL: https://duckduckgo.com/_next/static/css/ed8494aa71104fdc.css
URL: https://duckduckgo.com/_next/static/css/703c9a9a057785a9.css
URL: https://duckduckgo.com/_next/static/chunks/webpack-7358ea7cdec0aecf.js
URL: https://duckduckgo.com/_next/static/chunks/framework-f8115f7fae64930e.js
URL: https://firefox.settings.services.mozilla.com/v1/buckets/monitor/
collections/changes/changeset?collection=anti-tracking-url-decoration&
bucket=main&_expected=0
URL: https://firefox.settings.services.mozilla.com/v1/buckets/monitor/
collections/changes/changeset?collection=query-stripping&bucket=main&
_expected=0
URL: https://firefox.settings.services.mozilla.com/v1/buckets/monitor/
collections/changes/changeset?collection=hijack-blocklists&
bucket=main&_expected=0
URL: https://firefox.settings.services.mozilla.com/v1/buckets/monitor/
collections/changes/changeset?collection=url-classifier-skip-urls&
bucket=main&_expected=0
URL: https://duckduckgo.com/_next/static/chunks/main-17a05b704438cdd6.js
URL: https://duckduckgo.com/_next/static/chunks/pages/_app-ce0b94ea69138577.js
URL: https://duckduckgo.com/_next/static/chunks/41966-c9d76895b4f9358f.js
URL: https://duckduckgo.com/_next/static/chunks/93432-ebd443fe69061b19.js
URL: https://firefox.settings.services.mozilla.com/v1/buckets/monitor/
collections/changes/changeset?collection=password-recipes&bucket=main&
_expected=0
URL: https://duckduckgo.com/_next/static/chunks/18040-1287342b1f839f70.js
URL: https://duckduckgo.com/_next/static/chunks/81125-b74d1b6f4908497b.js
URL: https://duckduckgo.com/_next/static/chunks/39337-cd8caeeff0afb1c4.js
URL: https://duckduckgo.com/_next/static/chunks/94623-d5bfa67fc3bada59.js
URL: https://duckduckgo.com/_next/static/chunks/95665-30dd494bea911abd.js
URL: https://duckduckgo.com/_next/static/chunks/55015-29fec414530c2cf6.js
URL: https://duckduckgo.com/_next/static/chunks/61754-29df12bb83d71c7b.js
URL: https://duckduckgo.com/_next/static/chunks/55672-19856920a309aea5.js
URL: https://duckduckgo.com/_next/static/chunks/38407-070351ade350c8e4.js
URL: https://duckduckgo.com/_next/static/chunks/pages/%5Blocale%5D/
home-34dda07336cb6ee1.js
URL: https://duckduckgo.com/_next/static/ZNJGkb3SCV-nLlzz3kvNx/_buildManifest.js
URL: https://duckduckgo.com/_next/static/ZNJGkb3SCV-nLlzz3kvNx/_ssgManifest.js
URL: https://firefox.settings.services.mozilla.com/v1/buckets/monitor/
collections/changes/changeset?collection=search-config&bucket=main&
_expected=0
URL: https://firefox.settings.services.mozilla.com/v1/buckets/main/collections/
anti-tracking-url-decoration/changeset?_expected=1564511755134
URL: https://firefox.settings.services.mozilla.com/v1/buckets/main/collections/
query-stripping/changeset?_expected=1694689843914
URL: https://firefox.settings.services.mozilla.com/v1/buckets/main/collections/
hijack-blocklists/changeset?_expected=1605801189258
URL: https://firefox.settings.services.mozilla.com/v1/buckets/main/collections/
password-recipes/changeset?_expected=1674595048726
URL: https://firefox.settings.services.mozilla.com/v1/buckets/main/collections/
url-classifier-skip-urls/changeset?_expected=1701090424142
URL: https://firefox.settings.services.mozilla.com/v1/buckets/main/collections/
search-config/changeset?_expected=1701806851414
URL: https://content-signature-2.cdn.mozilla.net/chains/
remote-settings.content-signature.mozilla.org-2024-02-08-20-06-04.chain
Now that's certainly more files than I thought previously were being accessed using ESR 91. In fact its 45 access requests, which is more than we saw for ESR 78. What about the desktop version.Desktop version of the site on ESR 91
URL: https://duckduckgo.com/
URL: https://duckduckgo.com/static-assets/font/ProximaNova-RegIt-webfont.woff2
URL: https://duckduckgo.com/static-assets/font/ProximaNova-ExtraBold-webfont.woff2
URL: https://duckduckgo.com/static-assets/font/ProximaNova-Reg-webfont.woff2
URL: https://duckduckgo.com/static-assets/font/ProximaNova-Sbold-webfont.woff2
URL: https://duckduckgo.com/_next/static/css/c89114cfe55133c4.css
URL: https://duckduckgo.com/_next/static/css/6a4833195509cc3d.css
URL: https://duckduckgo.com/_next/static/css/a2a29f84956f2aac.css
URL: https://duckduckgo.com/_next/static/css/f0b3f7da285c9dbd.css
URL: https://duckduckgo.com/_next/static/css/ed8494aa71104fdc.css
URL: https://duckduckgo.com/_next/static/css/703c9a9a057785a9.css
URL: https://duckduckgo.com/static-assets/font/ProximaNova-Bold-webfont.woff2
URL: https://duckduckgo.com/_next/static/chunks/webpack-7358ea7cdec0aecf.js
URL: https://duckduckgo.com/_next/static/chunks/framework-f8115f7fae64930e.js
URL: https://duckduckgo.com/_next/static/chunks/main-17a05b704438cdd6.js
URL: https://duckduckgo.com/_next/static/chunks/pages/_app-ce0b94ea69138577.js
URL: https://duckduckgo.com/_next/static/chunks/41966-c9d76895b4f9358f.js
URL: https://duckduckgo.com/_next/static/chunks/93432-ebd443fe69061b19.js
URL: https://duckduckgo.com/_next/static/chunks/18040-1287342b1f839f70.js
URL: https://duckduckgo.com/_next/static/chunks/81125-b74d1b6f4908497b.js
URL: https://duckduckgo.com/_next/static/chunks/39337-cd8caeeff0afb1c4.js
URL: https://duckduckgo.com/_next/static/chunks/94623-d5bfa67fc3bada59.js
URL: https://duckduckgo.com/_next/static/chunks/95665-30dd494bea911abd.js
URL: https://duckduckgo.com/_next/static/chunks/55015-29fec414530c2cf6.js
URL: https://duckduckgo.com/_next/static/chunks/61754-29df12bb83d71c7b.js
URL: https://duckduckgo.com/_next/static/chunks/55672-19856920a309aea5.js
URL: https://duckduckgo.com/_next/static/chunks/38407-070351ade350c8e4.js
URL: https://duckduckgo.com/_next/static/chunks/pages/%5Blocale%5D/
home-34dda07336cb6ee1.js
URL: https://duckduckgo.com/_next/static/ZNJGkb3SCV-nLlzz3kvNx/_buildManifest.js
URL: https://duckduckgo.com/_next/static/ZNJGkb3SCV-nLlzz3kvNx/_ssgManifest.js
Only 30 accesses. That's really unexpected. I'm also going to collect myself a version of the full log output in case I need to refer back to it. First on ESR 78:
$ rm -rf ~/.local/share/org.sailfishos/browser $ EMBED_CONSOLE="network" sailfish-browser https://duckduckgo.com/ \ 2>&1 > log-ddg-78.txtThen also on ESR 91:
$ rm -rf ~/.local/share/org.sailfishos/browser $ EMBED_CONSOLE="network" sailfish-browser https://duckduckgo.com/ \ 2>&1 > log-ddg-91.txtThe next step will be to compare the results from ESR 78 with those from ESR 91 properly. That's where I'll pick this up tomorrow.
If you'd like to read any of my other gecko diary entries, they're all available on my Gecko-dev Diary page.
8 Jan 2024 : Day 132 #
For the last twenty hours or so my development phone has been loyally running ESR 91 in the debugger. That's because I've been searching for a suitable breakpoint to distinguish a working render of DuckDuckGo from a failing render of DuckDuckGo.
The time spent in between has been fruitful, but before I get on to that I want to first thank simonschmeisser for the useful comment on the Sailfish Forum about remote debugging. Simon highlights the fact that Firefox can be remote debugged by a second copy of Firefox. Here's how Simon explains it:
This approach isn't something I've tried before and it's true that it may need some code changes, but they may not be significant changes. I've not had a chance to try this, but plan to give it a go some time over the next week if I have time. Thanks Simon for the really nice suggestion!
Going back to the curent situation, the local gdb debugger is still running so I'd better spend a little time today making use of it. Recall that yesterday we found that on ESR 91 a breakpoint on nsDisplayBackgroundImage::AppendBackgroundItemsToTop was triggered, whereas a breakpoint on nsDisplayBackgroundImage::GetInitData() wasn't.
These two are potentially significant because the latter can be found one above the former in the stack when we visit the HTML version of DuckDuckGo. Consequently, it could be that something is happening in this method to prevent the site from rendering.
This feels like a long shot, especially because the stack for the HTML version of the page is hardly likely to be equivalent to the stack for the JavaScript version of the page. Nevetheless, we can pin this down a bit more using an ESR 78 version of the browser. If we run this on the JavaScript version of the page, we might find there's some useful comparison to be made.
I've placed breakpoints on nsDisplayBackgroundImage::GetInitData() for both versions of the browser and have run them simultaneously. On ESR 91 I get a blank page, nothing rendered, and the breackpoint remains untriggered. In contrast to this on ESR 78 the breakpoint hits with the following backtrace:
This strengthens my suspicion that there's something to be found inside AppendBackgroundItemsToTop(). Let's take a look at it.
So now I'm stepping through the code side-by-side using two phones; ESR 78 on the phone on the left and ESR 91 on the phone on the right. On my laptop display I have Qt Creator open with the ESR 78 copy of nsDisplayList.cpp on the left and the ESR 91 copy of the file on the right.
As I step through on both phones I'm comparing the source code line-by-line. They're not identical but close enough that I can keep track of them line-by-line and keep them broadly synchronised.
Eventually we hit this bit of code that's part of ESR 78, which is where the method returns:
But also in both cases the method is returning before the call to GetInitData() and what I'm really after is a case where it's called on ESR 78 but not on ESR 91. To examine that I'm going to have to step through the method a few more times, maybe place a breakpoint closer to the call. And for that, unfortunately, I've run out of time for today; it'll have to be something I explore tomorrow.
So I guess the phones will have to be left stuck on a breakpoint overnight yet again.
If you'd like to read any of my other gecko diary entries, they're all available on my Gecko-dev Diary page.
Comment
The time spent in between has been fruitful, but before I get on to that I want to first thank simonschmeisser for the useful comment on the Sailfish Forum about remote debugging. Simon highlights the fact that Firefox can be remote debugged by a second copy of Firefox. Here's how Simon explains it:
Unfortunately my attempts (via about:config) failed so far. But maybe someone else knows some more tricks?
and finally you could connect using about:debugging from desktop to debug what’s happening on the phone.
user_pref("devtools.chrome.enabled", true);
user_pref("devtools.debugger.remote-enabled", true);
user_pref("devtools.debugger.prompt-connection", false);
and then some sources claim you need to add --start-debugger-server and a port (this would obviously need to be implemented for sfos-browser...)and finally you could connect using about:debugging from desktop to debug what’s happening on the phone.
This approach isn't something I've tried before and it's true that it may need some code changes, but they may not be significant changes. I've not had a chance to try this, but plan to give it a go some time over the next week if I have time. Thanks Simon for the really nice suggestion!
Going back to the curent situation, the local gdb debugger is still running so I'd better spend a little time today making use of it. Recall that yesterday we found that on ESR 91 a breakpoint on nsDisplayBackgroundImage::AppendBackgroundItemsToTop was triggered, whereas a breakpoint on nsDisplayBackgroundImage::GetInitData() wasn't.
These two are potentially significant because the latter can be found one above the former in the stack when we visit the HTML version of DuckDuckGo. Consequently, it could be that something is happening in this method to prevent the site from rendering.
This feels like a long shot, especially because the stack for the HTML version of the page is hardly likely to be equivalent to the stack for the JavaScript version of the page. Nevetheless, we can pin this down a bit more using an ESR 78 version of the browser. If we run this on the JavaScript version of the page, we might find there's some useful comparison to be made.
I've placed breakpoints on nsDisplayBackgroundImage::GetInitData() for both versions of the browser and have run them simultaneously. On ESR 91 I get a blank page, nothing rendered, and the breackpoint remains untriggered. In contrast to this on ESR 78 the breakpoint hits with the following backtrace:
Thread 8 "GeckoWorkerThre" hit Breakpoint 1,
nsDisplayBackgroundImage::GetInitData (aBuilder=aBuilder@entry=0x7fa6e2e630,
aFrame=aFrame@entry=0x7f88744060, aLayer=aLayer@entry=0,
aBackgroundRect=..., aBackgroundStyle=aBackgroundStyle@entry=0x7f89d21578)
at layout/painting/nsDisplayList.cpp:3233
3233 ComputedStyle* aBackgroundStyle) {
(gdb) bt
#0 nsDisplayBackgroundImage::GetInitData (aBuilder=aBuilder@entry=0x7fa6e2e630,
aFrame=aFrame@entry=0x7f88744060, aLayer=aLayer@entry=0,
aBackgroundRect=..., aBackgroundStyle=aBackgroundStyle@entry=0x7f89d21578)
at layout/painting/nsDisplayList.cpp:3233
#1 0x0000007fbc1fab50 in nsDisplayBackgroundImage::AppendBackgroundItemsToTop
(aBuilder=aBuilder@entry=0x7fa6e2e630, aFrame=aFrame@entry=0x7f88744060,
aBackgroundRect=..., aList=<optimized out>,
aAllowWillPaintBorderOptimization=aAllowWillPaintBorderOptimization@entry=true,
aComputedStyle=aComputedStyle@entry=0x0, aBackgroundOriginRect=...,
aSecondaryReferenceFrame=aSecondaryReferenceFrame@entry=0x0,
aAutoBuildingDisplayList=<optimized out>, aAutoBuildingDisplayList@entry=0x0)
at layout/painting/nsDisplayList.cpp:3605
#2 0x0000007fbbffea94 in nsFrame::DisplayBackgroundUnconditional
(this=this@entry=0x7f88744060, aBuilder=aBuilder@entry=0x7fa6e2e630, aLists=...,
aForceBackground=aForceBackground@entry=false)
at ${PROJECT}/obj-build-mer-qt-xr/dist/include/nsRect.h:42
[...]
#74 0x0000007fb735e89c in ?? () from /lib64/libc.so.6
(gdb)
This is interesting because the second frame in the stack is for nsDisplayBackgroundImage::AppendBackgroundItemsToTop(). That matches what we were expecting before, and there's a good chance that DuckDuckGo will be serving the same data to ESR 78 as to the ESR 91 version of the renderer.This strengthens my suspicion that there's something to be found inside AppendBackgroundItemsToTop(). Let's take a look at it.
So now I'm stepping through the code side-by-side using two phones; ESR 78 on the phone on the left and ESR 91 on the phone on the right. On my laptop display I have Qt Creator open with the ESR 78 copy of nsDisplayList.cpp on the left and the ESR 91 copy of the file on the right.
As I step through on both phones I'm comparing the source code line-by-line. They're not identical but close enough that I can keep track of them line-by-line and keep them broadly synchronised.
Eventually we hit this bit of code that's part of ESR 78, which is where the method returns:
if (!bg) {
aList->AppendToTop(&bgItemList);
return false;
}
The ESR 91 version of this code looks like this:
if (!bg || !drawBackgroundImage) {
if (!bgItemList.IsEmpty()) {
aList->AppendToTop(&bgItemList);
return AppendedBackgroundType::Background;
}
return AppendedBackgroundType::None;
}
That's similar but not quite the same and in particular, bgItemList.mLength is zero meaning that !bgItemList.IsEmpty() is false.
(gdb) p bgItemList.mLength $6 = 0Both methods return at this point, but on ESR 78 aList->AppendToTop() has been called whereas on ESR 91 it's been skipped. There are multiple reasons why this might be and it's hard to imagine this is the reason rendering is failing on ESR 91, but it's a possibility that I need to investigate further.
But also in both cases the method is returning before the call to GetInitData() and what I'm really after is a case where it's called on ESR 78 but not on ESR 91. To examine that I'm going to have to step through the method a few more times, maybe place a breakpoint closer to the call. And for that, unfortunately, I've run out of time for today; it'll have to be something I explore tomorrow.
So I guess the phones will have to be left stuck on a breakpoint overnight yet again.
If you'd like to read any of my other gecko diary entries, they're all available on my Gecko-dev Diary page.
7 Jan 2024 : Day 131 #
I'm still stuck confused about why, specifically, the main DuckDuckGo search page doesn't render using ESR 91. As we saw yesterday, rotating the screen doesn't fix it. Copying the entire page and serving it from a different location works okay, which is the opposite of what I was hoping for and makes narrowing down the problem that much more difficult.
The only thing I can think to do now is crack open the debugger and see whether there's being any attempt to render anything of the site.
If the page is rendering, there's a good chance that some part of it will be an image. Consequently I've placed a breakpoint on nsImageRenderer::PrepareImage() and have set the browser running. Let's see if it hits.
Here's the backtrace from the breakpoint hit with the HTML-only page. This could be useful, because it may allow us to place a breakpoint further up the stack to figure out at which point the render is getting blocked. That's assuming that the problem is in the render loop, which of course it may well not be.
The 69-frame backtrace is huge, so I'm just copying out the relevant parts of it below. Rendering involves recursive calls to BuildDisplayList() which seems to be one of the reasons these stacks get so large.
I won't bore you with all of the steps, but I've followed the path up through the stack, setting breakpoints on each method call, and have found that the following breakpoint does hit for the standard rendering of the DuckDuckGo site:
But unfortunately not today: it's late and this needs a bit more time, so I'll pick it up in the morning. This is actually quite a good place to pause, having a very clear direction to explore and pick up on tomorrow.
Let's see what tomorrow brings.
If you'd like to read any of my other gecko diary entries, they're all available on my Gecko-dev Diary page.
Comment
The only thing I can think to do now is crack open the debugger and see whether there's being any attempt to render anything of the site.
If the page is rendering, there's a good chance that some part of it will be an image. Consequently I've placed a breakpoint on nsImageRenderer::PrepareImage() and have set the browser running. Let's see if it hits.
$ EMBED_CONSOLE=1 gdb sailfish-browser https://duckduckgo.com/ [...] (gdb) b nsImageRenderer::PrepareImage Function "nsImageRenderer::PrepareImage" not defined. Make breakpoint pending on future shared library load? (y or [n]) y Breakpoint 1 (nsImageRenderer::PrepareImage) pending. (gdb) r Starting program: /usr/bin/sailfish-browser [...]An interesting result: there are no hits on the breakpoint at all when loading the default DuckDuckGo page. But when loading the HTML-only page, the breakpoint hits immedately:
Thread 10 "GeckoWorkerThre" hit Breakpoint 1,
mozilla::nsImageRenderer::PrepareImage (this=this@entry=0x7f9efb0848)
at layout/painting/nsImageRenderer.cpp:66
66 bool nsImageRenderer::PrepareImage() {
In fact it hits, and continues hitting, while the page is displayed. Which is interesing: it suggests that for the JavaScript page no attempt is being made to render the page at all.Here's the backtrace from the breakpoint hit with the HTML-only page. This could be useful, because it may allow us to place a breakpoint further up the stack to figure out at which point the render is getting blocked. That's assuming that the problem is in the render loop, which of course it may well not be.
The 69-frame backtrace is huge, so I'm just copying out the relevant parts of it below. Rendering involves recursive calls to BuildDisplayList() which seems to be one of the reasons these stacks get so large.
Thread 10 "GeckoWorkerThre" hit Breakpoint 1, mozilla::nsImageRenderer::
PrepareImage (this=this@entry=0x7f9efa0848)
at layout/painting/nsImageRenderer.cpp:66
66 bool nsImageRenderer::PrepareImage() {
(gdb) bt
#0 mozilla::nsImageRenderer::PrepareImage (this=this@entry=0x7f9efa0848)
at layout/painting/nsImageRenderer.cpp:66
#1 0x0000007fbc350c5c in nsCSSRendering::PrepareImageLayer
(aPresContext=aPresContext@entry=0x7f8111dde0,
aForFrame=aForFrame@entry=0x7f813062c0,
aFlags=<optimized out>, aBorderArea=..., aBGClipRect=..., aLayer=...,
aOutIsTransformedFixed=aOutIsTransformedFixed@entry=0x7f9efa0847)
at layout/painting/nsCSSRendering.cpp:2976
#2 0x0000007fbc351254 in nsDisplayBackgroundImage::GetInitData
(aBuilder=aBuilder@entry=0x7f9efa6268, aFrame=aFrame@entry=0x7f813062c0,
aLayer=aLayer@entry=1, aBackgroundRect=...,
aBackgroundStyle=aBackgroundStyle@entry=0x7f8130f608)
at layout/painting/nsDisplayList.cpp:3416
#3 0x0000007fbc3a97a4 in nsDisplayBackgroundImage::AppendBackgroundItemsToTop
(aBuilder=0x7f9efa6268, aFrame=0x7f813062c0, aBackgroundRect=...,
aList=0x7f9efa11c8, aAllowWillPaintBorderOptimization=<optimized out>,
aComputedStyle=<optimized out>, aBackgroundOriginRect=...,
aSecondaryReferenceFrame=0x0, aAutoBuildingDisplayList=0x0)
at layout/painting/nsDisplayList.cpp:3794
#4 0x0000007fbc18c3d0 in nsIFrame::DisplayBackgroundUnconditional
(this=this@entry=0x7f813062c0, aBuilder=aBuilder@entry=0x7f9efa6268,
aLists=..., aForceBackground=aForceBackground@entry=false)
at ${PROJECT}/obj-build-mer-qt-xr/dist/include/nsRect.h:40
#5 0x0000007fbc191c90 in nsIFrame::DisplayBorderBackgroundOutline
(this=this@entry=0x7f813062c0, aBuilder=aBuilder@entry=0x7f9efa6268,
aLists=..., aForceBackground=aForceBackground@entry=false)
at layout/generic/nsIFrame.cpp:2590
#6 0x0000007fbc16fd10 in nsBlockFrame::BuildDisplayList
(this=0x7f813062c0, aBuilder=0x7f9efa6268, aLists=...)
at layout/generic/nsBlockFrame.cpp:6963
#7 0x0000007fbc1c040c in nsIFrame::BuildDisplayListForChild
(this=this@entry=0x7f81306200, aBuilder=aBuilder@entry=0x7f9efa6268,
aChild=aChild@entry=0x7f813062c0, aLists=..., aFlags=..., aFlags@entry=...)
at layout/generic/nsIFrame.cpp:4278
#8 0x0000007fbc159ccc in DisplayLine (aBuilder=aBuilder@entry=0x7f9efa6268,
aLine=..., aLineInLine=aLineInLine@entry=false, aLists=...,
aFrame=aFrame@entry=0x7f81306200, aTextOverflow=aTextOverflow@entry=0x0,
aLineNumberForTextOverflow=aLineNumberForTextOverflow@entry=0,
aDepth=aDepth@entry=0, aDrawnLines=@0x7f9efa14fc: 127)
at layout/generic/nsBlockFrame.cpp:6924
#9 0x0000007fbc170220 in nsBlockFrame::BuildDisplayList (this=0x7f81306200,
aBuilder=0x7f9efa6268, aLists=...)
at layout/generic/nsBlockFrame.cpp:7082
[...]
#33 0x0000007fbc1bce14 in nsIFrame::BuildDisplayListForStackingContext
(this=this@entry=0x7f81304940, aBuilder=<optimized out>,
aBuilder@entry=0x7f9efa6268, aList=aList@entry=0x7f9efa8078,
aCreatedContainerItem=aCreatedContainerItem@entry=0x0)
at layout/generic/nsIFrame.cpp:3416
#34 0x0000007fbc12d7ac in nsLayoutUtils::PaintFrame
(aRenderingContext=aRenderingContext@entry=0x0,
aFrame=aFrame@entry=0x7f81304940, aDirtyRegion=...,
aBackstop=aBackstop@entry=4294967295,
aBuilderMode=aBuilderMode@entry=nsDisplayListBuilderMode::Painting,
aFlags=aFlags@entry=(nsLayoutUtils::PaintFrameFlags::WidgetLayers |
nsLayoutUtils::PaintFrameFlags::ExistingTransaction |
nsLayoutUtils::PaintFrameFlags::NoComposite))
at layout/base/nsLayoutUtils.cpp:3445
#35 0x0000007fbc0b9008 in mozilla::PresShell::Paint
(this=this@entry=0x7f811424a0, aViewToPaint=aViewToPaint@entry=0x7e780077f0,
aDirtyRegion=..., aFlags=aFlags@entry=mozilla::PaintFlags::PaintLayers)
at layout/base/PresShell.cpp:6400
[...]
#69 0x0000007fb78b289c in ?? () from /lib64/libc.so.6
(gdb)
This breakpoint was set on nsImageRenderer::PrepareImage(). That hit on the HTML page but not on the JavaScript page. Let's try something further down the stack. At stack frame 34 we're inside nsLayoutUtils::PaintFrame(), so let's put a breakpoint on that and display the JavaScript version of the page to see what happens.
(gdb) delete break 1
(gdb) b nsLayoutUtils::PaintFrame
Breakpoint 2 at 0x7fbc12ce1c: file layout/base/nsLayoutUtils.cpp, line 3144.
(gdb) c
Continuing.
Thread 10 "GeckoWorkerThre" hit Breakpoint 2, nsLayoutUtils::PaintFrame
(aRenderingContext=aRenderingContext@entry=0x0,
aFrame=aFrame@entry=0x7f809f3c00,
aDirtyRegion=..., aBackstop=aBackstop@entry=4294967295,
aBuilderMode=aBuilderMode@entry=nsDisplayListBuilderMode::Painting,
aFlags=aFlags@entry=(nsLayoutUtils::PaintFrameFlags::WidgetLayers |
nsLayoutUtils::PaintFrameFlags::ExistingTransaction |
nsLayoutUtils::PaintFrameFlags::NoComposite))
at layout/base/nsLayoutUtils.cpp:3144
3144 PaintFrameFlags aFlags) {
(gdb) bt
#0 nsLayoutUtils::PaintFrame (aRenderingContext=aRenderingContext@entry=0x0,
aFrame=aFrame@entry=0x7f809f3c00, aDirtyRegion=...,
aBackstop=aBackstop@entry=4294967295,
aBuilderMode=aBuilderMode@entry=nsDisplayListBuilderMode::Painting,
aFlags=aFlags@entry=(nsLayoutUtils::PaintFrameFlags::WidgetLayers |
nsLayoutUtils::PaintFrameFlags::ExistingTransaction |
nsLayoutUtils::PaintFrameFlags::NoComposite))
at layout/base/nsLayoutUtils.cpp:3144
#1 0x0000007fbc0b9008 in mozilla::PresShell::Paint
(this=this@entry=0x7f80456d90, aViewToPaint=aViewToPaint@entry=0x7f80b73520,
aDirtyRegion=..., aFlags=aFlags@entry=mozilla::PaintFlags::PaintLayers)
at layout/base/PresShell.cpp:6400
#2 0x0000007fbbef0ec8 in nsViewManager::ProcessPendingUpdatesPaint
(this=this@entry=0x7f80b79520, aWidget=aWidget@entry=0x7f806e6f60)
at ${PROJECT}/obj-build-mer-qt-xr/dist/include/mozilla/gfx/RectAbsolute.h:43
[...]
#30 0x0000007fb78b289c in ?? () from /lib64/libc.so.6
(gdb)
And we get a hit. That means that somewhere between the call to nsLayoutUtils::PaintFrame() and nsImageRenderer::PrepareImage something is changing.I won't bore you with all of the steps, but I've followed the path up through the stack, setting breakpoints on each method call, and have found that the following breakpoint does hit for the standard rendering of the DuckDuckGo site:
Thread 10 "GeckoWorkerThre" hit Breakpoint 6,
nsDisplayBackgroundImage::AppendBackgroundItemsToTop (aBuilder=0x7f9efa6378,
aFrame=0x7f81599428, aBackgroundRect=..., aList=0x7f9efa3f08,
aAllowWillPaintBorderOptimization=true, aComputedStyle=0x0,
aBackgroundOriginRect=..., aSecondaryReferenceFrame=0x0,
aAutoBuildingDisplayList=0x0)
at layout/painting/nsDisplayList.cpp:3632
3632 aAutoBuildingDisplayList) {
(gdb)
However, moving one up from the stack we find nsDisplayBackgroundImage::GetInitData() and this method doesn't trigger when we placed a breakpoint on it:
(gdb) delete break 6 (gdb) break nsDisplayBackgroundImage::GetInitData Breakpoint 7 at 0x7fbc3511d4: file layout/painting/nsDisplayList.cpp, line 3409. (gdb) c Continuing.So that's between stack frame two and three of our original backtrace. This might suggest — although I'm not on firm ground here by any means — that the problem is potentially happening inside the call to AppendBackgroundItemsToTop(). On the other hand, that might just be a consequence of the two versions of the site having different structures. I'm going to step through the method to try to find out.
But unfortunately not today: it's late and this needs a bit more time, so I'll pick it up in the morning. This is actually quite a good place to pause, having a very clear direction to explore and pick up on tomorrow.
Let's see what tomorrow brings.
If you'd like to read any of my other gecko diary entries, they're all available on my Gecko-dev Diary page.
7 Jan 2024 : Life as a Christmas tree #
The 6th January is traditionally the day Christmas decorations are dismantled in the UK. In Finland it's the 13th January, partly because the Christmas lights are needed to counteract the shorter daylight hours and partly to avoid angering the Yulegoat. But I'm in the UK so this weekend Joanna and I took down our Christmas decorations.
In previous years we've always tried to get a Christmas tree with roots. Our success rate in keeping it alive until the next Christmas currently stands at zero percent.
This year I went out of my way to care for our Christmas tree, carefully keeping the soil in its pot moist with daily watering, avoiding bumps and bashes, not overburdening the branches with crazy decorative figurines.
It's definitely fared better than any of our previous trees and today I dug a hole in the back garden and planted it solidly.
Here are the three stages of its life I've so far been involved with, from left-to-right: sitting in our living room right after we introduced it; with decorations ready for Christmas; and now transplanted to our back garden.
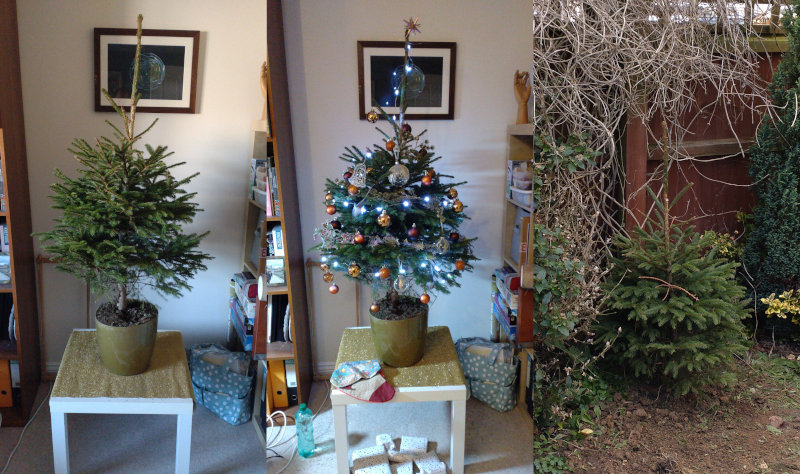
I'm no gardener and I don't rate its chances highly, but I'd love it to survive. Not only would it be wonderful to have a Norwegian Spruce living in our garden, but it would also feel like a real achievement to have a multi-year Christmas tree. I'm also counting this as one of the ecological acts needed to fulfil my New Year's Resolutions.
I'll report back later in the year on how the tree is doing. It feels like its success is now very much down to weather, nature and its will to survive. Maybe that's not the right way to look at these things, but that's why I'm not a gardener.
Comment
In previous years we've always tried to get a Christmas tree with roots. Our success rate in keeping it alive until the next Christmas currently stands at zero percent.
This year I went out of my way to care for our Christmas tree, carefully keeping the soil in its pot moist with daily watering, avoiding bumps and bashes, not overburdening the branches with crazy decorative figurines.
It's definitely fared better than any of our previous trees and today I dug a hole in the back garden and planted it solidly.
Here are the three stages of its life I've so far been involved with, from left-to-right: sitting in our living room right after we introduced it; with decorations ready for Christmas; and now transplanted to our back garden.
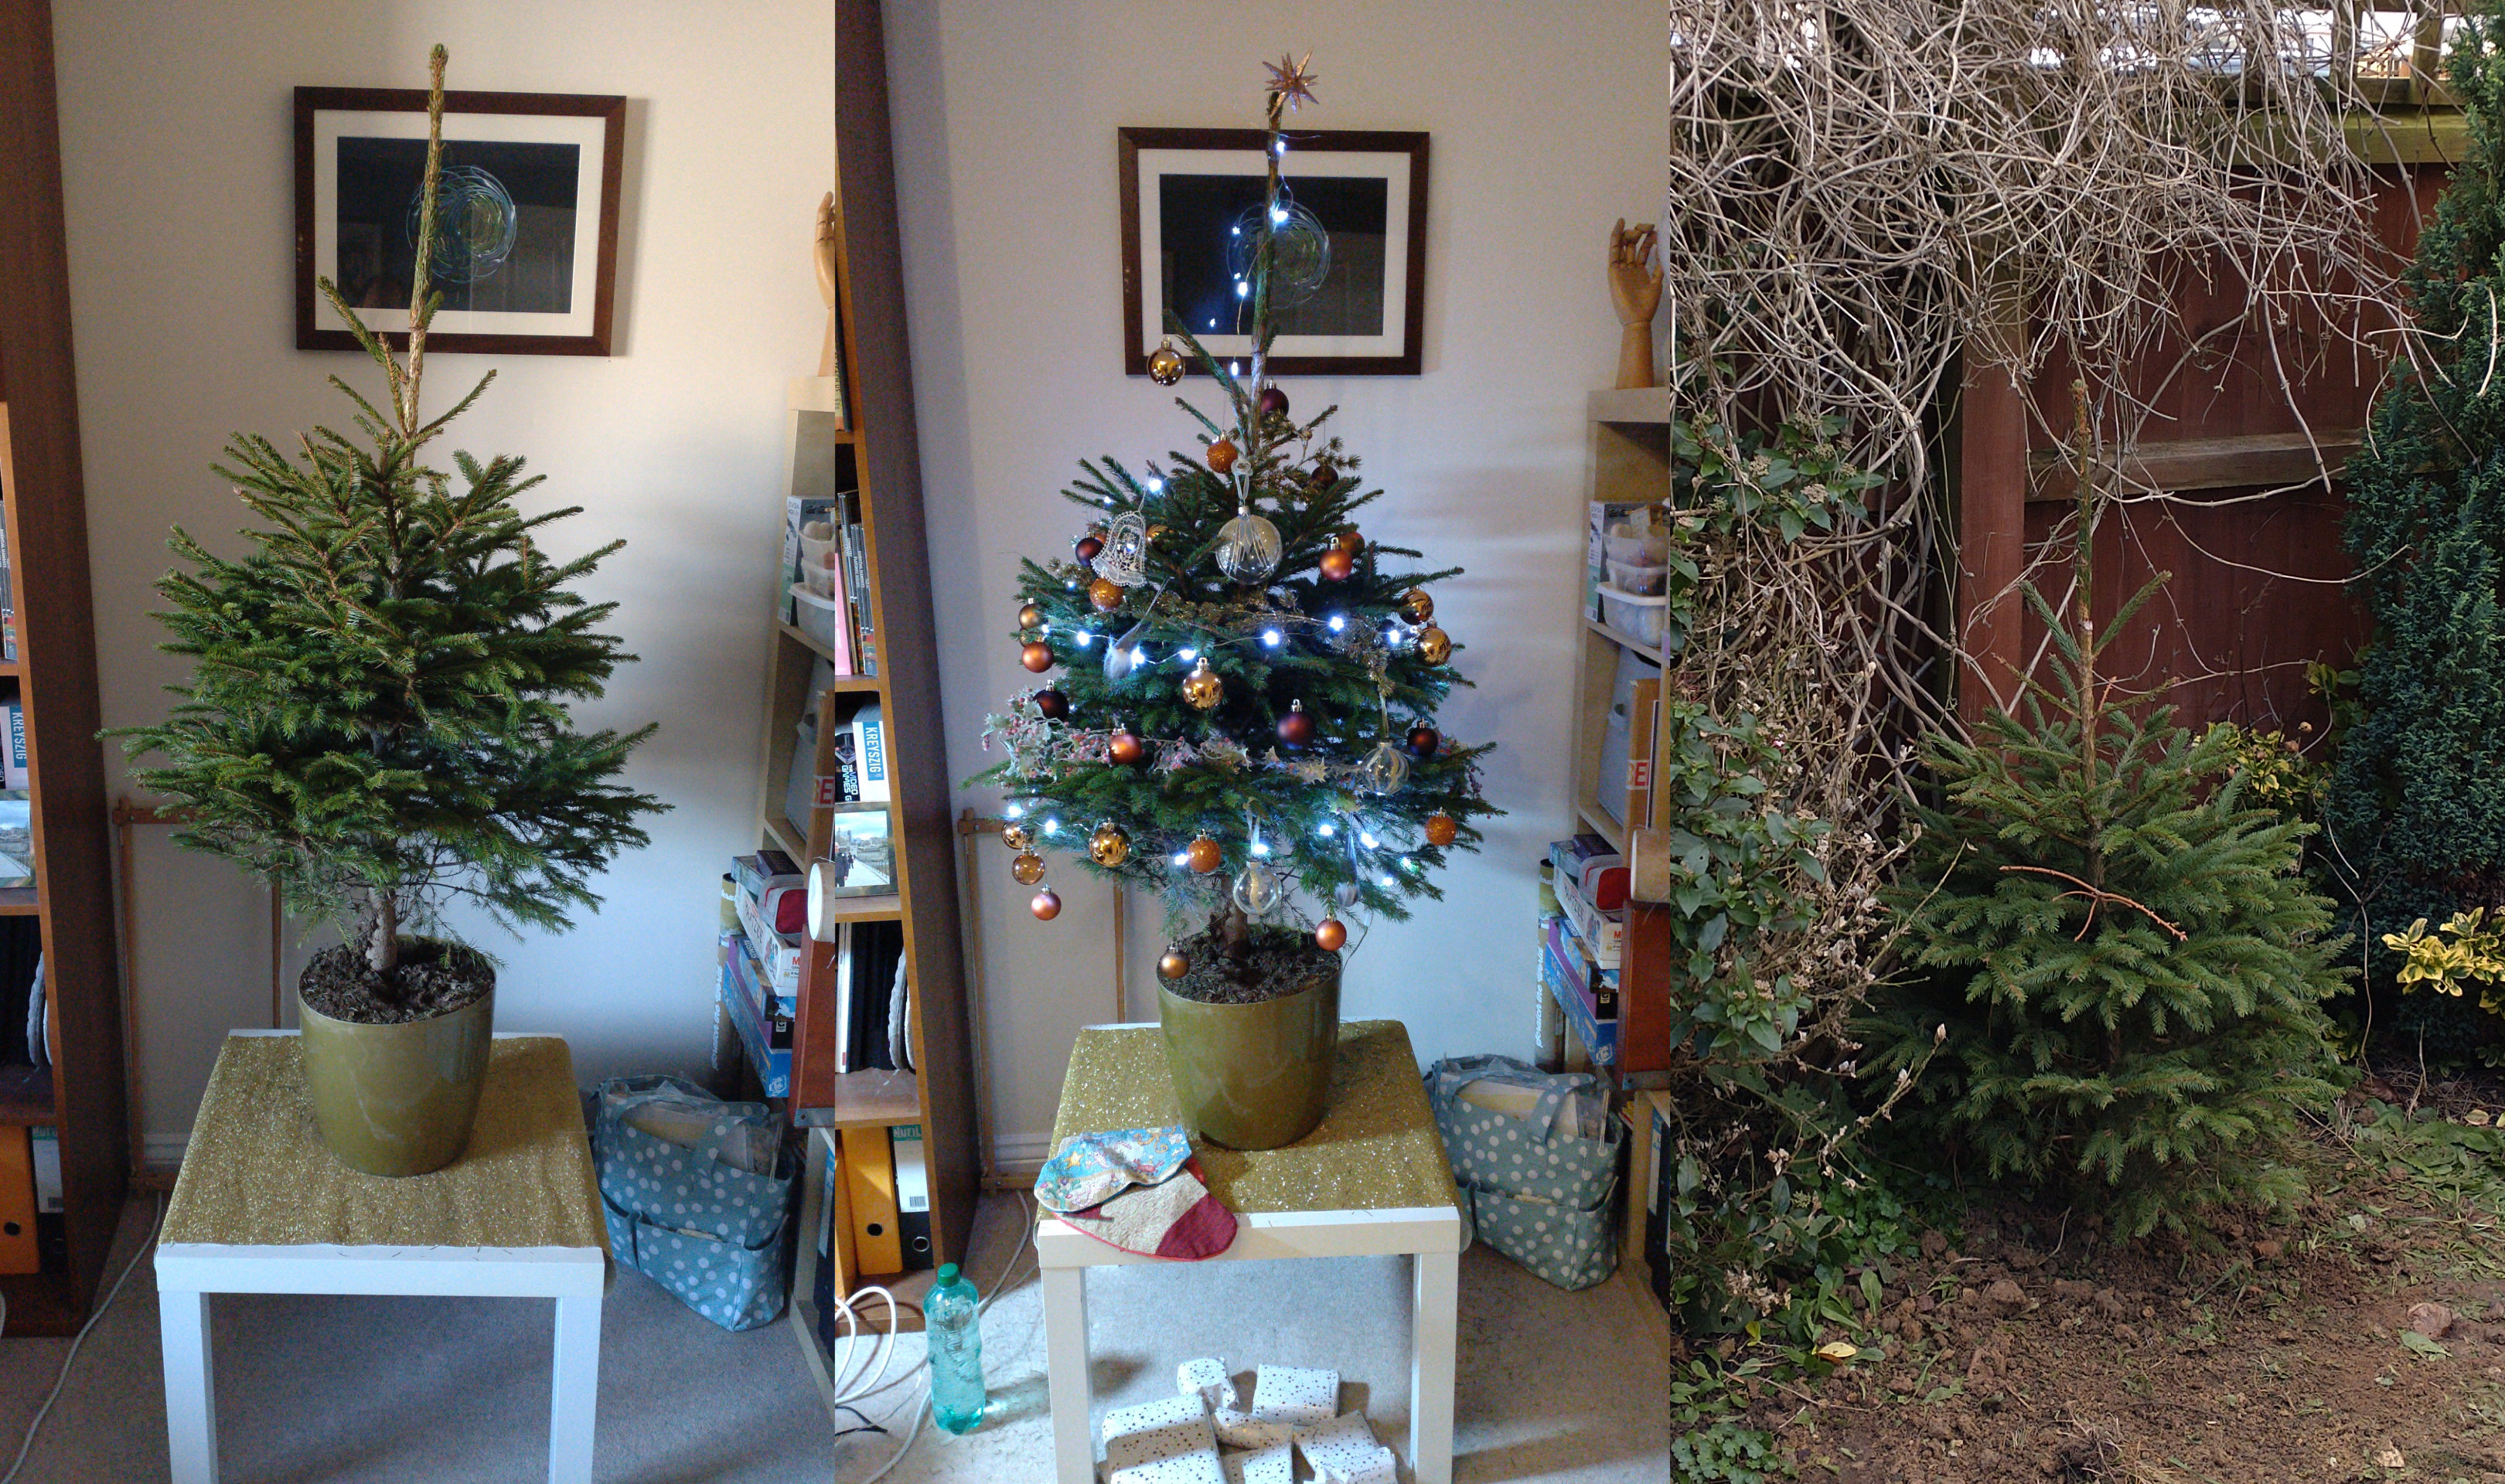
I'm no gardener and I don't rate its chances highly, but I'd love it to survive. Not only would it be wonderful to have a Norwegian Spruce living in our garden, but it would also feel like a real achievement to have a multi-year Christmas tree. I'm also counting this as one of the ecological acts needed to fulfil my New Year's Resolutions.
I'll report back later in the year on how the tree is doing. It feels like its success is now very much down to weather, nature and its will to survive. Maybe that's not the right way to look at these things, but that's why I'm not a gardener.
6 Jan 2024 : Day 130 #
We didn't make much progress yesterday despite capturing all of the data flowing through the browser while visiting DuckDuckGo. While using ESR 91 the page just comes up completely blank, with no obvious error messages in the console output to indicate why.
I left things overnight to settle in my mind and by the morning I'd come up with a plan. So I suppose letting it settle was the right move.
But before getting in to that let me first thank PeperJohnny for sympathising with my testing plight. While of course I'm not happy to PeperJohnny suffers these frustrations as well, I am reassured by the knowledge that I'm not the only one! I share — and am encouraged by — PeperJohnny's belief that the reason can't hide itself forever!
Thanks also to hschmitt and lkraav for the useful comments about similar experiences rendering the Amazon Germany Web pages using the ESR 78 engine.
As it happens I also get this with Amazon UK using ESR 78. It's mighty unhelpful because pages appear briefly before blanking out, making the site next-to-useless. I wasn't aware of the portrait-to-landscape fix, which from the useful comments, I now find works very well. So thank you both for this nice input.
Unfortunately the problem with DuckDuckGo on ESR 91 seems to be different. Unlike the Amazon case the rendering doesn't even start, so the symptoms appear to be slightly different. Following the advice I did of course also try the portrait-to-landscape trick, but sadly this doesn't have any obvious effect.
One positive I can report is that Amazon no longer exhibits this annoying behaviour when using ESR 91. It does display other problematic behaviour, but fixing that will have to wait for a future investigation.
Thanks for all of the input, I always appreciate it, and am always pleased to follow up useful tips like these. When attempting to fix this kind of thing, ideas can be the scarcest of resources, so all suggestions are valuable.
So it looks like I still need a plan of attack. Continuing with the plan I cooked up overnight, unfortunately I don't have much time to execute it today, but maybe I can make a start on it. The approach I'm going to try is a "divide and conquer" approach. I've actually used it before when trying to fix other sites broken with earlier versions of the browser. Given this I'm not sure why it didn't occur to me last night; sometimes these things just take a little while to work their way out.
So my plan is to take a complete static copy of the DuckDuckGo HTML and store it on a server I have control over and can access from my development phones. I can then visit the site and, hopefully, the page will be similarly broken.
Having got to that point I can then start removing parts of the site to figure out which particular aspect of it is causing the rendering to fail. I call it "divide and conquer" because each time I'll take away a chunk of the code and see whether that solves the problem. If not, I'll remove a different chunk. Eventually something will have to render.
The tricky part here is getting an adequate copy of the site. If it's not close enough the issue won't manifest itself.
I've started off by exporting a full copy of the site using desktop Firefox. I started by taking a copy of the page while using the Responsive Design developer option to make the site believe it's running on a phone. But taking this site, posting it on a server and accessing it using ESR 91, I find this new copy of the site now loads perfectly.
So I tried a second time, this time capturing the full desktop site. Again, when I load this using ESR 91 on my phone it looks just fine, automatically displaying the mobile version.
This is all rather unhelpful.
Unfortunately it's now super-late here and I've still not got to the bottom of this. Maybe another night's sleep will help.
If you'd like to read any of my other gecko diary entries, they're all available on my Gecko-dev Diary page.
Comment
I left things overnight to settle in my mind and by the morning I'd come up with a plan. So I suppose letting it settle was the right move.
But before getting in to that let me first thank PeperJohnny for sympathising with my testing plight. While of course I'm not happy to PeperJohnny suffers these frustrations as well, I am reassured by the knowledge that I'm not the only one! I share — and am encouraged by — PeperJohnny's belief that the reason can't hide itself forever!
Thanks also to hschmitt and lkraav for the useful comments about similar experiences rendering the Amazon Germany Web pages using the ESR 78 engine.
As it happens I also get this with Amazon UK using ESR 78. It's mighty unhelpful because pages appear briefly before blanking out, making the site next-to-useless. I wasn't aware of the portrait-to-landscape fix, which from the useful comments, I now find works very well. So thank you both for this nice input.
Unfortunately the problem with DuckDuckGo on ESR 91 seems to be different. Unlike the Amazon case the rendering doesn't even start, so the symptoms appear to be slightly different. Following the advice I did of course also try the portrait-to-landscape trick, but sadly this doesn't have any obvious effect.
One positive I can report is that Amazon no longer exhibits this annoying behaviour when using ESR 91. It does display other problematic behaviour, but fixing that will have to wait for a future investigation.
Thanks for all of the input, I always appreciate it, and am always pleased to follow up useful tips like these. When attempting to fix this kind of thing, ideas can be the scarcest of resources, so all suggestions are valuable.
So it looks like I still need a plan of attack. Continuing with the plan I cooked up overnight, unfortunately I don't have much time to execute it today, but maybe I can make a start on it. The approach I'm going to try is a "divide and conquer" approach. I've actually used it before when trying to fix other sites broken with earlier versions of the browser. Given this I'm not sure why it didn't occur to me last night; sometimes these things just take a little while to work their way out.
So my plan is to take a complete static copy of the DuckDuckGo HTML and store it on a server I have control over and can access from my development phones. I can then visit the site and, hopefully, the page will be similarly broken.
Having got to that point I can then start removing parts of the site to figure out which particular aspect of it is causing the rendering to fail. I call it "divide and conquer" because each time I'll take away a chunk of the code and see whether that solves the problem. If not, I'll remove a different chunk. Eventually something will have to render.
The tricky part here is getting an adequate copy of the site. If it's not close enough the issue won't manifest itself.
I've started off by exporting a full copy of the site using desktop Firefox. I started by taking a copy of the page while using the Responsive Design developer option to make the site believe it's running on a phone. But taking this site, posting it on a server and accessing it using ESR 91, I find this new copy of the site now loads perfectly.
So I tried a second time, this time capturing the full desktop site. Again, when I load this using ESR 91 on my phone it looks just fine, automatically displaying the mobile version.
This is all rather unhelpful.
Unfortunately it's now super-late here and I've still not got to the bottom of this. Maybe another night's sleep will help.
If you'd like to read any of my other gecko diary entries, they're all available on my Gecko-dev Diary page.
6 Jan 2024 : How lightly did I tread in 2023 #
For the last four years I've been offsetting my carbon emissions. In the long run I accept that offsetting isn't a sustainable way to address the climate crisis, but until my CO2 output reaches zero I still think it's better to offset than to not. Apart from attempting to address the balance of my impact on the world it also offers two other benefits.
First there's the personal financial cost I incur from having to pony up a hundred quid or thereabouts each year. That's a good way to incentivize myself to reduce my carbon footprint in the future. Second there's the active process of interrogating my consumption: working through the calculations is a great way to focus the mind, confront the consequences of my personal decisions and think about what I could improve on in the future.
Last year it took until April for me to run the calculations and act on them. This year I've done much better. That's partly driven by my New Year's Resolution to make at least one ecological improvement per month during the year. Even though this isn't a new thing for me, when I made the resolution the intention was always to count this as one of the tasks. And so it is.
Here's the table that shows which carbon emissions came from which activities. I've included all previous years so that some trends can be captured. I should emphasise that this represents household emissions, so covers two people, both Joanna and me. For comparison average emissions for individuals in the UK is 5.40 tonnes (10.80 tonnes for two people).
The headline result is that our total carbon emissions have been reduced compared to last year. That's mostly driven by a large decrease in the number of flights, from twenty in 2022 to just four last year. Twenty flights is a large number, a consequence of living in Finland. This year I moved back to the UK in February. That meant some flights to tidy up my life in Finland, but I've not flown again since then. In 2024 I'm hoping to push that down to zero flights.
Reduced flights was partly offset by increased train and bus travel, largely due to my weekly commute between Cambridge and London for work. I took the journey 88 times, giving me a massive total distance travelled of 19 638 km by national rail. Thankfully trains are also far more carbon efficient than planes, so while distance travelled only reduced by a factor of 1.5, carbon emissions reduced by a factor of 5.75.
One potentially confusing thing about the numbers is that natural gas usage is a negative figure. We switched from a gas boiler to a heat pump, with the result that our gas usage tumbled. But of course it wasn't negative! The negative value is due to our power company overestimating our gas usage as a result of our heating change. The overestimate was included in the figures for last year and this negative figure redresses that.
The following table gives more detail about the numbers used to perform the calculations. After pulling these together I then fed them into Carbon Footprint Ltd's carbon calculator as I have in previous years to generate the results.
As in previous years I've used the UN Framework Convention on Climate Change to offset my carbon output. The money will go to pay for improved cooking stoves in Malawi, a scheme managed by Ripple Africa.
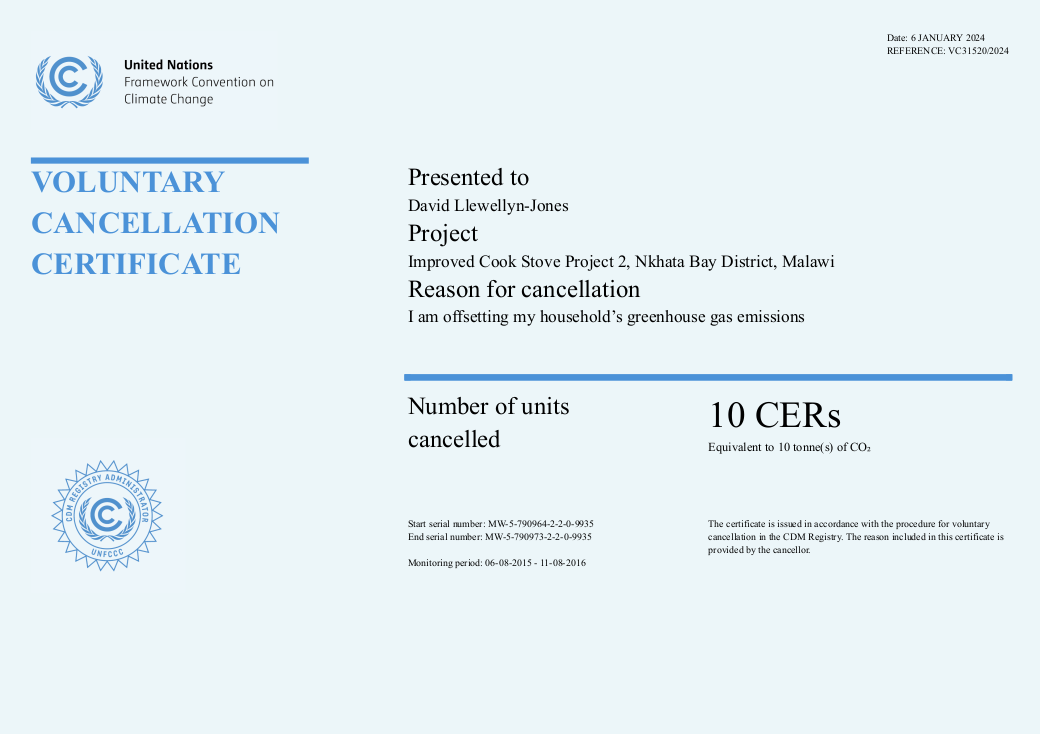
Comment
First there's the personal financial cost I incur from having to pony up a hundred quid or thereabouts each year. That's a good way to incentivize myself to reduce my carbon footprint in the future. Second there's the active process of interrogating my consumption: working through the calculations is a great way to focus the mind, confront the consequences of my personal decisions and think about what I could improve on in the future.
Last year it took until April for me to run the calculations and act on them. This year I've done much better. That's partly driven by my New Year's Resolution to make at least one ecological improvement per month during the year. Even though this isn't a new thing for me, when I made the resolution the intention was always to count this as one of the tasks. And so it is.
Here's the table that shows which carbon emissions came from which activities. I've included all previous years so that some trends can be captured. I should emphasise that this represents household emissions, so covers two people, both Joanna and me. For comparison average emissions for individuals in the UK is 5.40 tonnes (10.80 tonnes for two people).
| Source | CO2, 2019 (t) | CO2, 2020 (t) | CO2, 2021 (t) | CO2, 2022 (t) | CO2, 2023 (t) |
|---|---|---|---|---|---|
| Electricity | 0.50 | 0.40 | 0.59 | 1.14 | 1.66 |
| Natural gas | 1.18 | 1.26 | 1.66 | 0.81 | -0.25 |
| Flights | 5.76 | 2.26 | 1.90 | 5.34 | 1.32 |
| Car | 1.45 | 0.39 | 0.39 | 1.01 | 1.00 |
| Bus | 0.00 | 0.01 | 0.02 | 0.01 | 0.31 |
| National rail | 0.08 | 0.01 | 0.02 | 0.00 | 0.70 |
| International rail | 0.02 | 0.01 | 0.00 | 0.04 | 0.01 |
| Taxi | 0.01 | 0.01 | 0.01 | 0.01 | 0.01 |
| Food and drink | 1.69 | 1.11 | 1.05 | 1.35 | 1.07 |
| Pharmaceuticals | 0.26 | 0.32 | 0.31 | 0.06 | 0.13 |
| Clothing | 0.03 | 0.06 | 0.06 | 0.12 | 0.23 |
| Paper-based products | 0.34 | 0.15 | 0.14 | 0.37 | 0.38 |
| Computer usage | 1.30 | 1.48 | 0.75 | 0.93 | 0.23 |
| Electrical | 0.12 | 0.29 | 0.19 | 0.03 | 0.01 |
| Non-fuel car | 0.00 | 0.10 | 0.00 | 0.12 | 0.92 |
| Manufactured goods | 0.50 | 0.03 | 0.03 | 0.05 | 0.11 |
| Hotels, restaurants | 0.51 | 0.16 | 0.15 | 0.10 | 1.21 |
| Telecoms | 0.15 | 0.05 | 0.04 | 0.03 | 0.05 |
| Finance | 0.24 | 0.24 | 0.22 | 0.04 | 0.02 |
| Insurance | 0.19 | 0.11 | 0.10 | 0.04 | 0.04 |
| Education | 0.05 | 0.00 | 0.04 | 0.01 | 0.00 |
| Recreation | 0.09 | 0.06 | 0.05 | 0.03 | 0.06 |
| Total | 14.47 | 8.50 | 7.73 | 11.65 | 9.25 |
The headline result is that our total carbon emissions have been reduced compared to last year. That's mostly driven by a large decrease in the number of flights, from twenty in 2022 to just four last year. Twenty flights is a large number, a consequence of living in Finland. This year I moved back to the UK in February. That meant some flights to tidy up my life in Finland, but I've not flown again since then. In 2024 I'm hoping to push that down to zero flights.
Reduced flights was partly offset by increased train and bus travel, largely due to my weekly commute between Cambridge and London for work. I took the journey 88 times, giving me a massive total distance travelled of 19 638 km by national rail. Thankfully trains are also far more carbon efficient than planes, so while distance travelled only reduced by a factor of 1.5, carbon emissions reduced by a factor of 5.75.
One potentially confusing thing about the numbers is that natural gas usage is a negative figure. We switched from a gas boiler to a heat pump, with the result that our gas usage tumbled. But of course it wasn't negative! The negative value is due to our power company overestimating our gas usage as a result of our heating change. The overestimate was included in the figures for last year and this negative figure redresses that.
The following table gives more detail about the numbers used to perform the calculations. After pulling these together I then fed them into Carbon Footprint Ltd's carbon calculator as I have in previous years to generate the results.
| Source | 2019 | 2020 | 2021 | 2022 | 2023 |
|---|---|---|---|---|---|
| Electricity | 1 794 kWh | 1 427 kWh | 3 009 kWh | 4 101 kWh | 5 975 kWh |
| Natural gas | 6 433 kWh | 6 869 kWh | 9 089 kWh | 4 439 kWh | -1 362 kWh |
| Flights |
36 580 km 20 flights |
14 632 km 8 flights |
25 542 km 14 flights |
36 042 km 20 flights |
7 233 km 4 flights |
| Car | 11 910 km | 2 000 km | 3 219 km | 8 458 km | 8 369 km |
| Bus | 1 930 km | 40 km | 168 km | 133 km | 3 080 km |
| National rail | 5 630 km | 400 km | 676 km | 0 km | 19 638 km |
| International rail | 64 km | 1 368 km | 513 km | 8 684 km | 2 322 km |
| Taxi | 64 km | 37 km | 100 km | 100 km | 100 km |
| Tube | 0 km | 0 km | 0 km | 0 km | 100 km |
As in previous years I've used the UN Framework Convention on Climate Change to offset my carbon output. The money will go to pay for improved cooking stoves in Malawi, a scheme managed by Ripple Africa.