List items
Items from the current list are shown below.
Gecko
17 Mar 2024 : Day 188 #
I was still trying to find memory leaks yesterday, although I came to the conclusion that it may not be a memory leak causing the problem after all. I need to continue investigating to try to get a clearer picture, there are a couple of obvious things to try.
One approach worth trying is running the app through valgrind. I'm not super-hopeful that this will yield helpful results because gecko struggles to maintain a healthy memory map at the best of times. As a result valgrind is likely to generate a huge number of results, most of which are just the consequence of "normal" (for some definition of the word) EmbedLite behaviour and so unrelated to the problem I'm trying to fix.
So before trying out valgrind I'm going to try something simpler. That is, I thought I'd just measure the memory usage and see whether it's growing out of control, or remaining stable.
There are many ways to check memory usage: tops might be one way. But as I'm writing this up as a diary entry I thought it would be better to generate some graphs. This will also give a more concrete idea of what's happening over time.
There's also no shortage of tools for generating memory usage graphs. I've plumped for psrecord, a small Python tool, since it's easy to install and use and generates nice clean graphs of memory usage against time.
The fact it's so easy to install and run a random Python utility is one of the things I really love about Sailfish OS. All I have to do is drop to a shell (I usually have an SSH session running already anyway), create a virtual environment and use pip to install it:
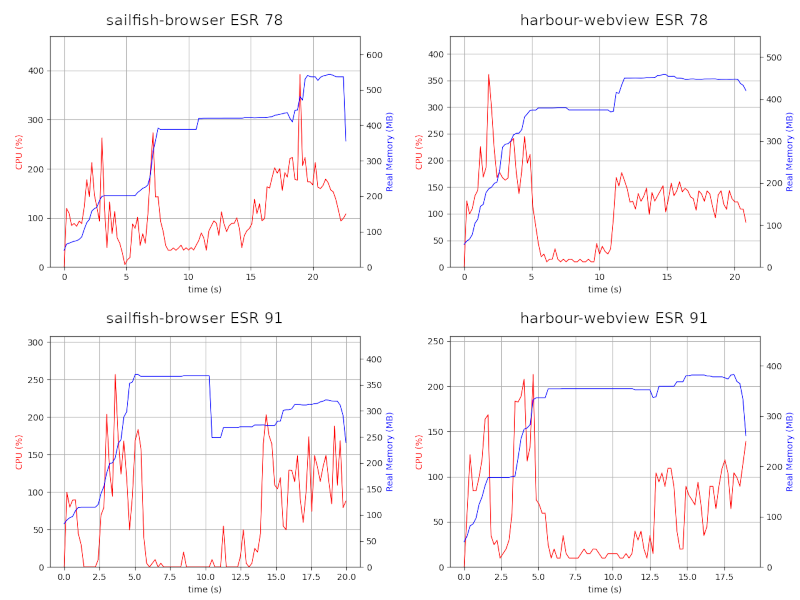
What do we find from these? With both ESR 78 and ESR 91 the browser increases memory to around 250-300 MB. It's nice to see that the memory footprint on ESR 91 is no higher than for ESR 78, in fact if anything it's lower. ESR 78 seems to accumulate memory until the app is shut down, whereas ESR 91 is more consistent.
We see a similar pattern for the WebView. ESR 78 quickly rises to 300 MB of memory usage before jumping up to 350 MB when I start scrolling the page. On ESR 91 the memory rapidly climbs to 200 MB where it stays pretty consistently throughout. Scrolling does cause some memory jitter, but not as much as on ESR 78.
This is all both encouraging and discouraging. It's encouraging to see ESR 91 isn't more of a memory hog than ESR 78. If anything it seems to be leaner. It's discouraging because the lack of excessive memory usage on ESR 91 suggests I may be looking in the wrong place for the solution to the issue I'm trying to solve.
Is that discouraging? Maybe it's encouraging. I have more information than I had before, but in truth I don't feel closer to finding a solution.
I spent a surprising amount of time investigating different ways to collect memory usage data. On top of that generating the graphs also took a whole, given it involved using two different phones and two different apps on each. So I'm going to call it a day. I still want to run the apps through valgrind — maybe this will pick up something new — but I'm going to leave that task until tomorrow.
If you'd like to read any of my other gecko diary entries, they're all available on my Gecko-dev Diary page.
One approach worth trying is running the app through valgrind. I'm not super-hopeful that this will yield helpful results because gecko struggles to maintain a healthy memory map at the best of times. As a result valgrind is likely to generate a huge number of results, most of which are just the consequence of "normal" (for some definition of the word) EmbedLite behaviour and so unrelated to the problem I'm trying to fix.
So before trying out valgrind I'm going to try something simpler. That is, I thought I'd just measure the memory usage and see whether it's growing out of control, or remaining stable.
There are many ways to check memory usage: tops might be one way. But as I'm writing this up as a diary entry I thought it would be better to generate some graphs. This will also give a more concrete idea of what's happening over time.
There's also no shortage of tools for generating memory usage graphs. I've plumped for psrecord, a small Python tool, since it's easy to install and use and generates nice clean graphs of memory usage against time.
The fact it's so easy to install and run a random Python utility is one of the things I really love about Sailfish OS. All I have to do is drop to a shell (I usually have an SSH session running already anyway), create a virtual environment and use pip to install it:
$ python3 -m venv venv
$ . ./venv/bin/activate
$ pip install --upgrade pip
$ pip install psrecord matplotlib
Beautiful! I'm sure there's a nice way to use Python on Android (using Termux?) and iOS (Pythonista?) but I'm not sure I'd be able to install and use psrecord quite so easily.
$ harbour-webview & psrecord --plot mem-harbour-webview-esr91.png \
    --interval 0.2 "$!"
$ sailfish-browser & psrecord --plot mem-sailfish-browser-esr91.png \
    --interval 0.2 "$!"
Then, when I'm done, I can deactivate and delete the virtual environment to restore my phone to its previous state.
$ deactivate
$ rm -rf venv
The resulting graphs are pretty clear, giving both memory usage in MB and CPU usage as a percentage of the total available. We're really only interested in memory usage though. For context, these graphs were collected by running each of the apps for 20 seconds. After 10 seconds I started scrolling the page up and down with my finger, since the problem doesn't seem to manifest itself when the display is static.
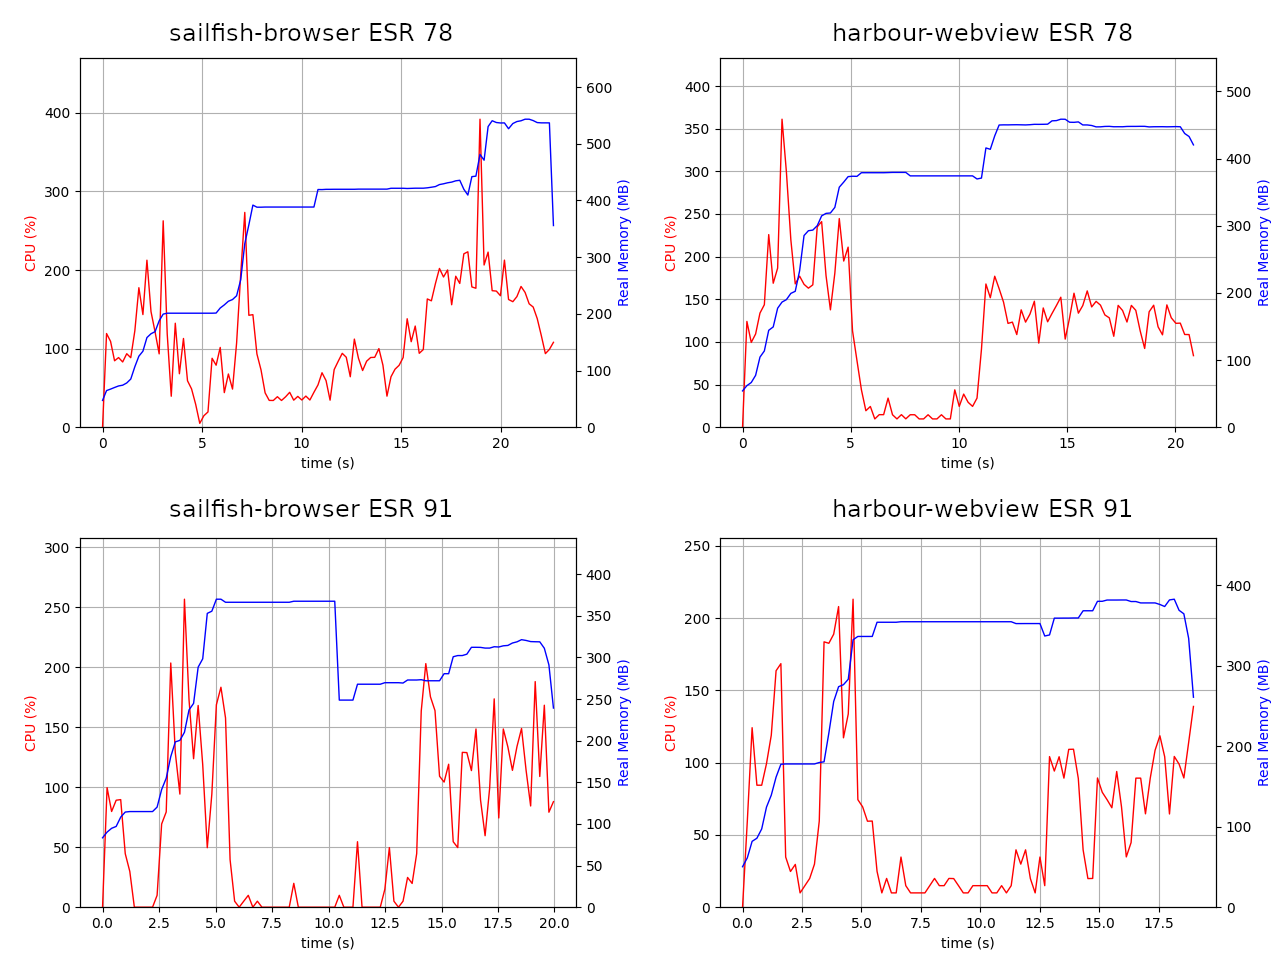
What do we find from these? With both ESR 78 and ESR 91 the browser increases memory to around 250-300 MB. It's nice to see that the memory footprint on ESR 91 is no higher than for ESR 78, in fact if anything it's lower. ESR 78 seems to accumulate memory until the app is shut down, whereas ESR 91 is more consistent.
We see a similar pattern for the WebView. ESR 78 quickly rises to 300 MB of memory usage before jumping up to 350 MB when I start scrolling the page. On ESR 91 the memory rapidly climbs to 200 MB where it stays pretty consistently throughout. Scrolling does cause some memory jitter, but not as much as on ESR 78.
This is all both encouraging and discouraging. It's encouraging to see ESR 91 isn't more of a memory hog than ESR 78. If anything it seems to be leaner. It's discouraging because the lack of excessive memory usage on ESR 91 suggests I may be looking in the wrong place for the solution to the issue I'm trying to solve.
Is that discouraging? Maybe it's encouraging. I have more information than I had before, but in truth I don't feel closer to finding a solution.
I spent a surprising amount of time investigating different ways to collect memory usage data. On top of that generating the graphs also took a whole, given it involved using two different phones and two different apps on each. So I'm going to call it a day. I still want to run the apps through valgrind — maybe this will pick up something new — but I'm going to leave that task until tomorrow.
If you'd like to read any of my other gecko diary entries, they're all available on my Gecko-dev Diary page.
Comments
Uncover Disqus comments